Full Text
 > High res figure
Deep ocean bathyspheres, looking up toward the sea surface.
High-altitude sensors, gazing through lenses down at the surface of the sea,
watching the bathyspheres emerge from their dive.Vision through vitreosity.
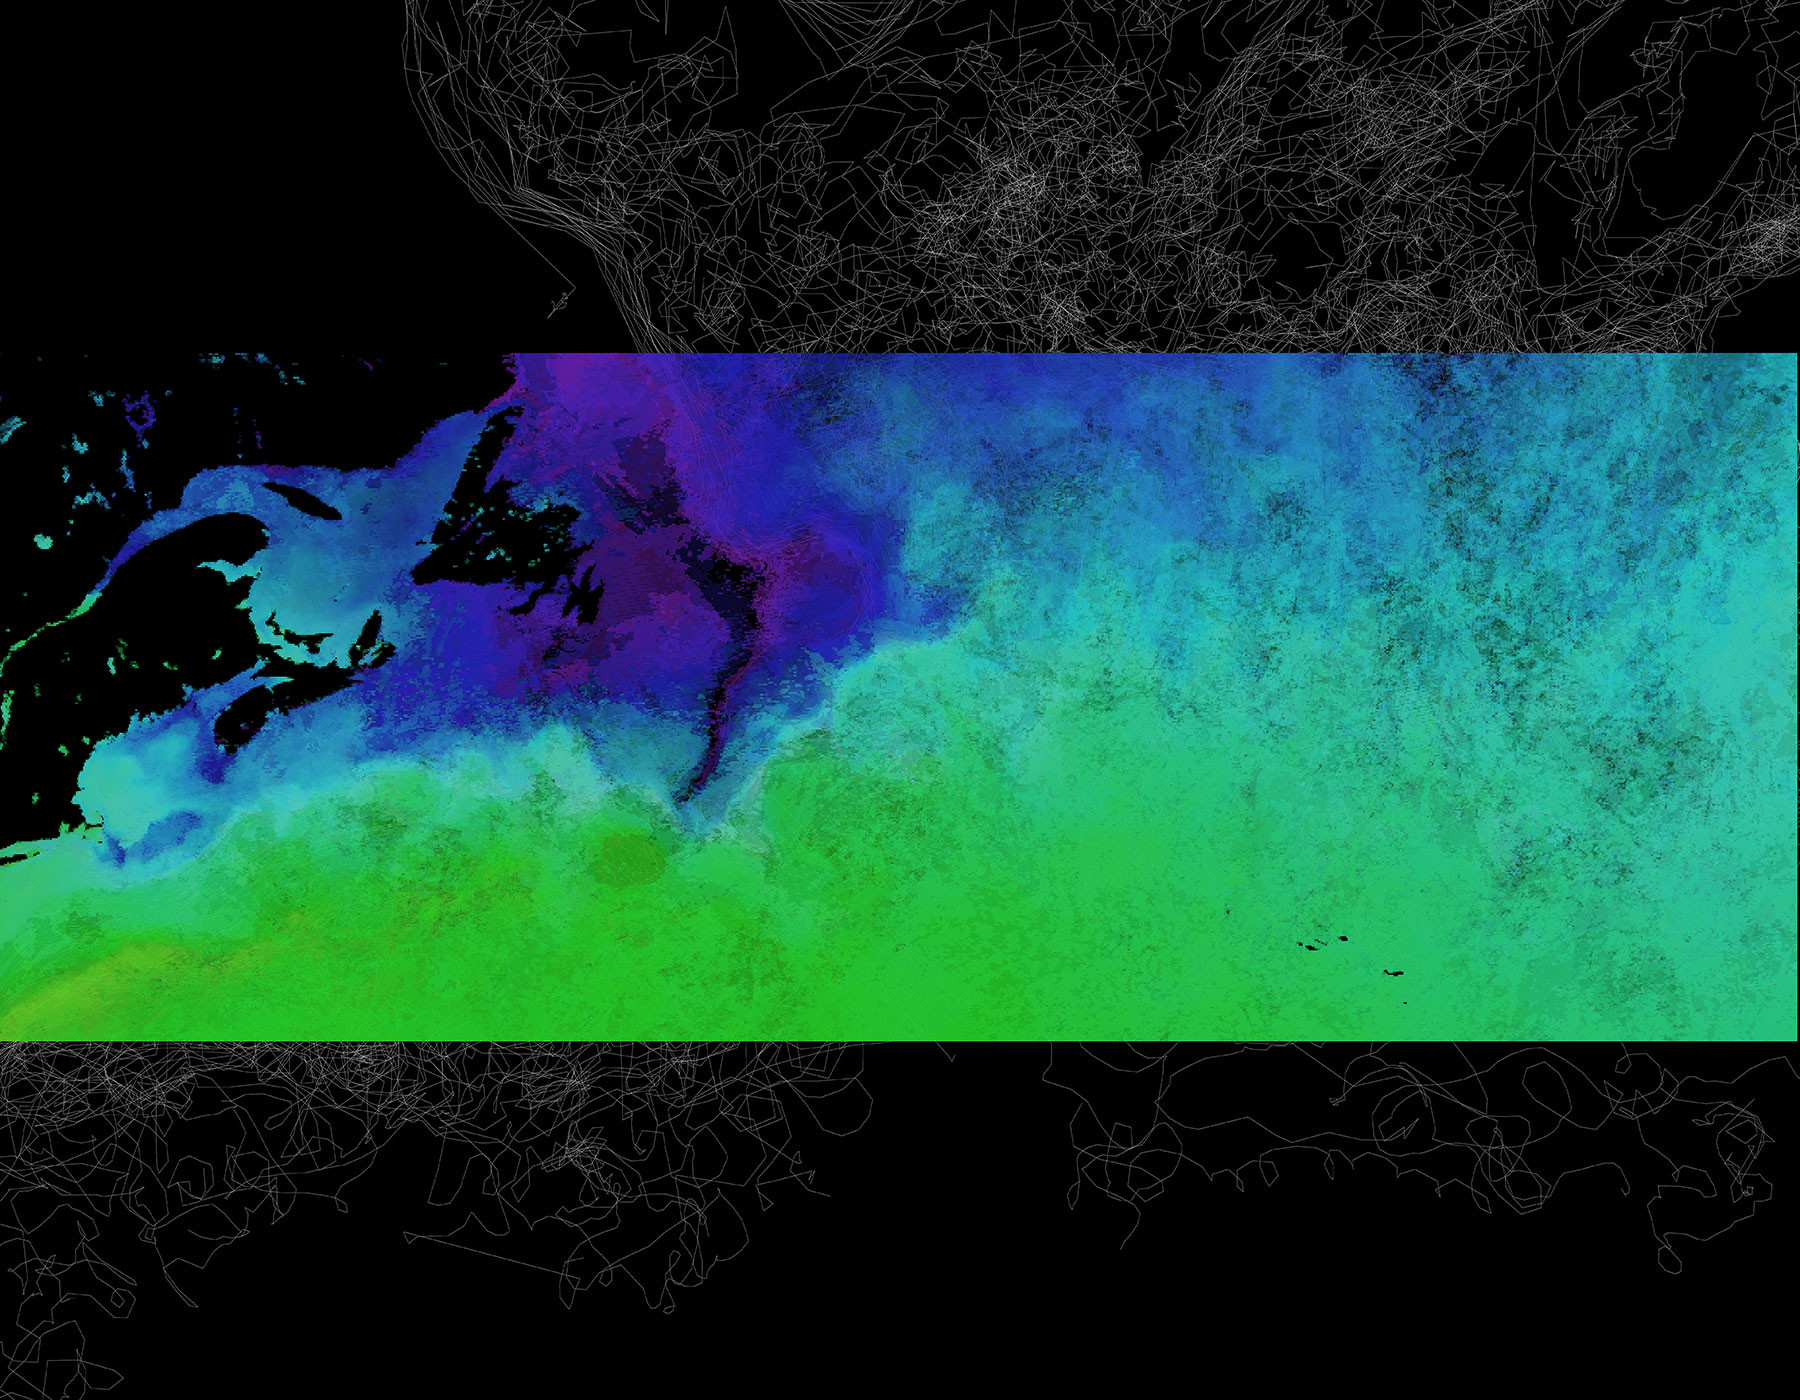
The visualization displayed on this page was generated using Seaglass, a network-based data visualization system I’ve been developing since 2016. For this image, eight panes of eight-day averaged sea surface temperature (SST), derived from satellite measurements throughout 2017, were blended into a single frame using a thermal color palette. Clouds block satellite measurement of SST and are represented in each pane in black. Gray lines display ~250 Argo ocean profiler tracks spanning multiple years and profiler types (including Core Argo, Biogeochemical Argo, and Deep Argo). Profiler locations are a function of surface and deep ocean currents. SST panes are comprised of 4 km-resolution nighttime measurements collected by the Moderate Resolution Imaging Spectroradiometer (MODIS) sensor mounted on the sun-synchronous Terra satellite. To visualize MODIS sensor data, Seaglass queries the Physical Oceanography Distributed Active Archive Center (PODAAC) API (Jet Propulsion Laboratory) for the selected area and time period and plots the response containing the SST data. To visualize Argo tracks, Seaglass queries the Argovis API (University of Colorado) for the selected area and time period and plots the response containing the profiler track data.

