Full Text
The Southern Ocean absorbs a great deal of heat and carbon dioxide (CO2) from the atmosphere, helping to shape the global climate. This oceanic service comes at a cost: the Southern Ocean is becoming warmer, fresher, less oxygenated, and more acidic—in effect heating up, losing breath, and becoming corrosive. The consequences of these changes are difficult to monitor and remain poorly understood.
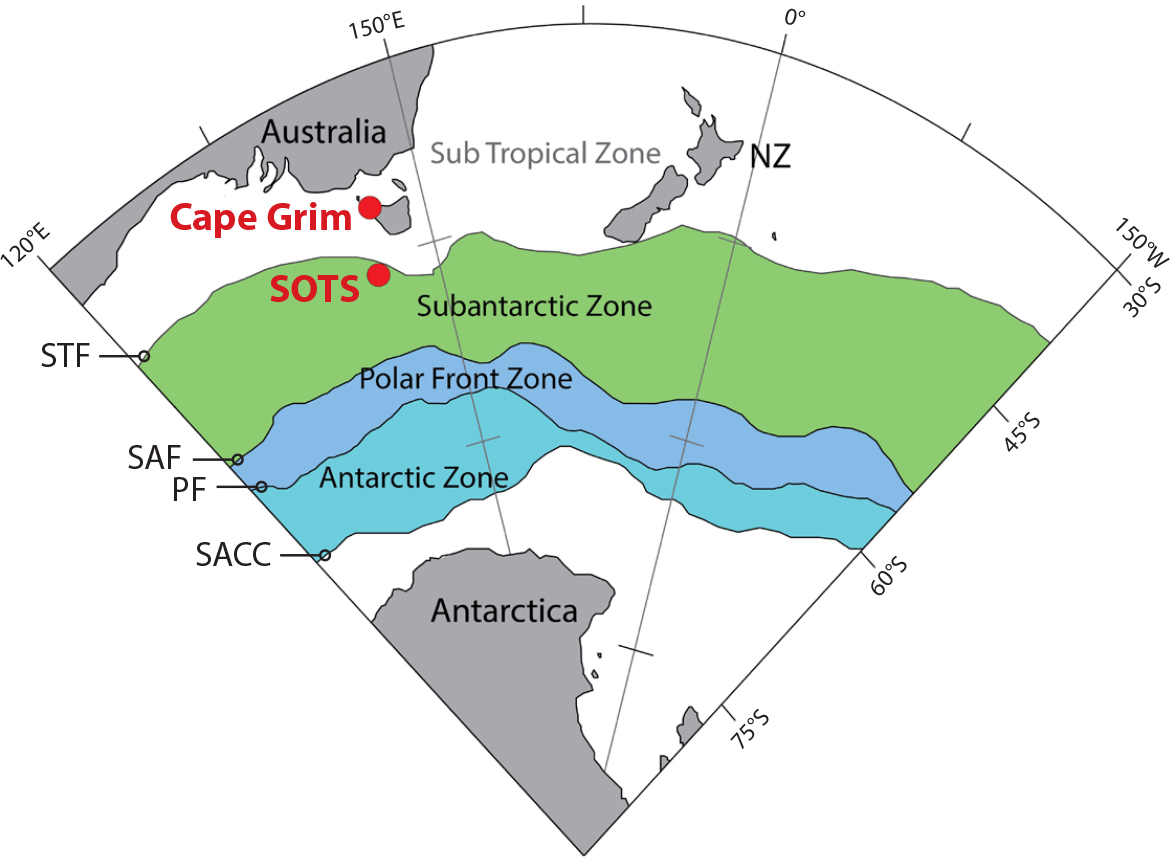
With observations collected by the longest biogeochemical moored time series in the Southern Ocean, we are making an integrated and ongoing assessment of the processes that control the carbon cycle in the Subantarctic Southern Ocean (47°S, 142°E, Figure 1)—now recognized as globally important in the uptake and storage of anthropogenic CO2.
|
|
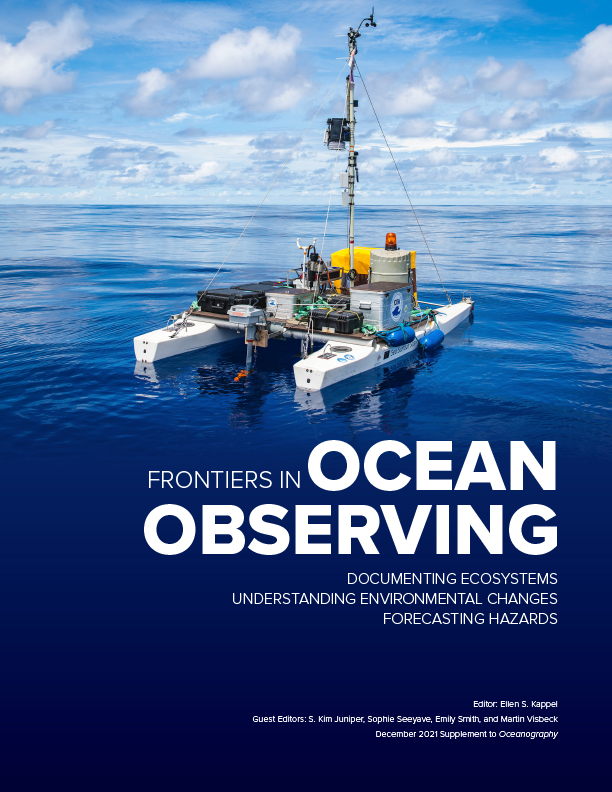
The Southern Ocean Time Series (SOTS) consists of two deep-water moorings: the Subantarctic Zone (SAZ) sediment trap mooring and the Southern Ocean Flux Station (SOFS) air-sea flux and biogeochemistry mooring, both supported by the Australian Integrated Marine Observing System (IMOS; https://imos.org.au/). Mooring data from the surface ocean and the atmosphere are transmitted in near-real time, while data logged at depth are collected when the moorings are retrieved. Automated samplers on the moorings provide precious samples year-round, and annual research voyages are essential for turn-around of the moorings, sensor calibration, and process studies. All data streams combine to deliver a suite of autonomous, year-round, multitrophic observations, providing an unparalleled multiyear record of the Southern Ocean. Data collected at SOTS are freely available from the Australian Ocean Data Network (AODN; https://portal.aodn.org.au/).
The goal of SOTS is to assess air-sea exchange, biological production, and carbon uptake and export in the Subantarctic Zone. Because these exchanges occur over many spatial and temporal scales, for example, from daily insolation cycles to seasonal cycles in biological production and decadal oscillations over whole ocean basins, high-frequency observations collected over many years are required. The current context of relentless anthropogenic forcing of rapid climate change increases the urgency of this work.
Changing Ocean Chemistry at SOTS
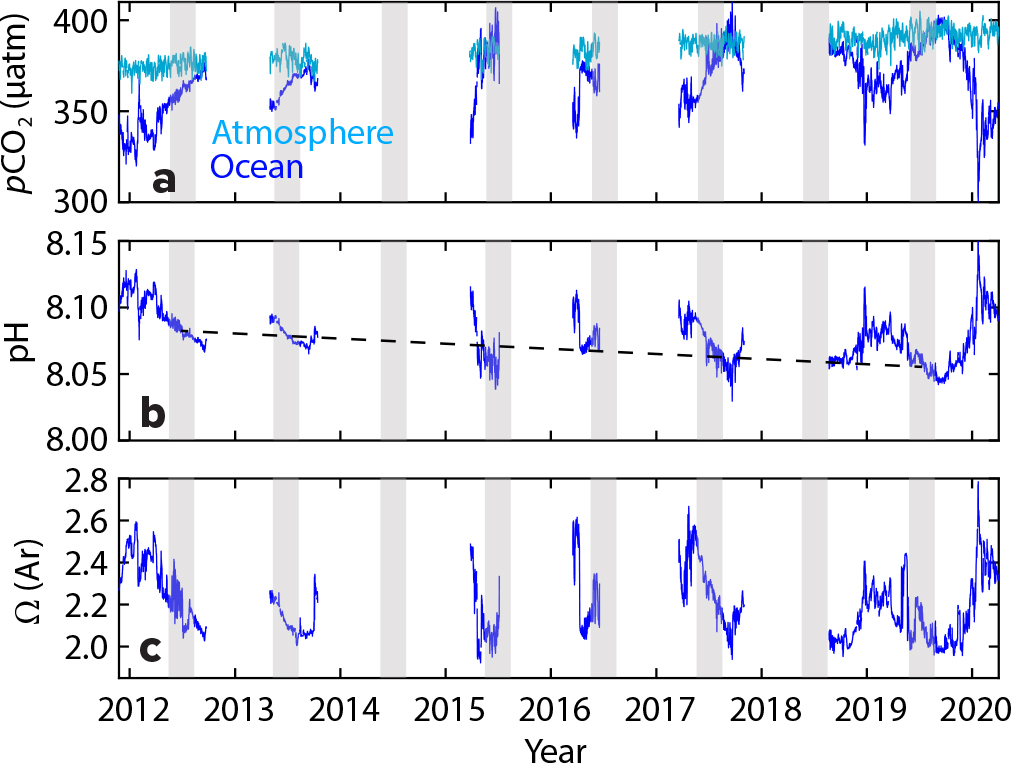
Measuring the amounts of CO2 (in parts per million or ppm) in the air and the ocean provides key indicators of climate change. Sensor records from SOTS show an increase of atmospheric CO2 from roughly 375 ppm in 2012 to 390 ppm in 2019 (Figure 2a); this change of approximately 15 ppm over seven years, or ~2.14 ppm/yr, is consistent with observations from the Cape Grim Baseline Air Pollution Station in northwestern Tasmania (Figure 1). By contrast, in the 1960s, the rate of increase of atmospheric CO2 was much smaller, only 0.5 ppm/yr; not only are the atmospheric CO2 concentrations much higher today, the rate of increase has continued to grow.
|
|
Measurements of surface ocean CO2 at SOTS show an increase from an average winter (June–August in the Southern Hemisphere) concentration of ~360 ppm in 2012 to ~388 ppm in 2019 (Figure 2a), a change of approximately 3.6 ppm/yr, exceeding the rate of CO2 increase in the atmosphere. Increasing CO2 corresponds to a decrease in ocean pH; average winter pH has decreased from 8.08 in 2012 to 8.05 in 2019 (Figure 2b,c). We have also observed a decrease in the carbonate saturation state, Ω (a metric for the conditions required by calcifying organisms that construct plates, scales, or shells from calcium carbonate [CaCO3]), from 2.16 to 2.08. If Ω drops below a particular threshold, it may be more difficult for these organisms to calcify, and if Ω falls below a value of 1.0, CaCO3 dissolution may occur.
Ocean chemistry also changes throughout the year as a result of biological processes (e.g., the growth of phytoplankton, respiration, and the process of making CaCO3 bodies) and physical processes (e.g., changes in temperature and salinity, the air-sea exchange of CO2). Changes in surface ocean CO2 concentration over a 12-month period at the SOTS site can be as large as 100 ppm (Figure 2a), which makes detecting the longer-term changes described above particularly challenging.
Coccolithophore Surprises
Ocean acidification is expected to impact many organisms ranging from bacteria to fish, but especially calcifying organisms. In the Southern Ocean, this includes the coccolithophores, a group of beautifully ornate phytoplankton that grow in the ocean’s sunlit layers (Figure 3). Observations from SOTS reveal the relationship between seasonal biogeochemical conditions and the degree of calcification in Emiliania huxleyi (Rigual-Hernández et al., 2020a) as well as the broader composition of the coccolithophorid community (Figure 3) and its impacts on carbon export (Rigual-Hernández et al., 2020b).
|
|
We found that the response of coccolithophores to changing environmental conditions is complex and not always as predicted: the more heavily calcified forms of E. huxleyi were most abundant in the winter months, when sea surface temperature, calcite saturation state, and pH are at their annual minimum (i.e., not the best chemical conditions for building CaCO3). It’s likely that the extensive genetic variability present in natural populations and the varying response of different genetic strains to seasonal changes in light, nutrients, and temperature underpin this result.
Additional analyses of cocolithophores collected by the SAZ sediment trap mooring allowed the role of coccolithophore biodiversity in CaCO3 export to be determined. Contrary to the prevailing notion that E. huxleyi dominates carbonate export in the Subantarctic region, we found less abundant but larger species accounted for a larger fraction of the CaCO3 flux. This nuance is important for the assessment of probable ecosystem impacts of ocean acidification as well as their feedbacks to climate change, because changing carbonate removal by organisms affects the ability of the ocean to remove atmospheric CO2.
Disentangling natural variability and climate change requires observations collected over all seasons and many years. The SOTS observatory provides an important baseline for understanding the evolution of the physical, chemical, and biological processes in the Subantarctic region. These observations are essential to provide advice about how climate variability is affecting us now and is likely to affect us in the future.


