Introduction
Biological communities on the Chukchi Sea shelf are strongly influenced by seasonal ice cover and by the advection of Pacific origin water through the Bering Strait (reviewed by Hunt et al., 2016). Sea ice typically covers the whole Chukchi Sea shelf each winter but gives way to mostly open water as winds, seasonal warming, and the advection of warmer waters through the Bering Strait contribute to largely ice-free conditions by late summer (Frey et al., 2020). However, recent climate trends have led to earlier ice retreat and longer ice-free conditions on the Chukchi shelf. Resident and migratory species across trophic levels are adapted to seasonal extremes, including endemic Arctic species adapted to cold winter conditions, short-lived species that complete their life cycles during the short production season, and seasonal migrants that capitalize on high summer production but overwinter south of the Arctic (Sigler et al., 2011; Moore, 2016).
Ocean warming (Danielson et al., 2020), changes in regional winds (Pickart et al., 2013), and increased advection through the Bering Strait (Woodgate, 2018; Woodgate and Peralta-Ferriz, 2021) have accelerated the loss of sea ice in the northern Bering and Chukchi Seas and may be contributing to a potential system-wide transformation of the Pacific Arctic (Huntington et al., 2020). Such a transformation is likely to impact downstream biological communities in the Chukchi Sea, with the impacts differing among species and assemblages and potentially resulting in major ecosystem adjustments. Changes in some communities have already been documented, for example, long-term changes in the bivalve macrofauna composition (Grebmeier, 2012; Goethel et al., 2019). However, Arctic benthic taxa can have higher environmental tolerances and may be metabolically or trophically more resistant to environmental changes than previously assumed (Kędra et al., 2019; Renaud et al., 2019; Koch et al., 2020). In contrast, zooplankton communities in the eastern Chukchi Sea have been sensitive to warming trends and have exhibited a steady increase in the spread of Pacific-origin species across the entire eastern Chukchi shelf (Ershova et al., 2015; Spear et al., 2020). Warming trends have also been associated with changing seabird communities across the northern Bering and eastern Chukchi shelves, overall favoring planktivorous over piscivorous species (Gall et al., 2017; Kuletz et al., 2020). Similar changes in the Barents Sea have been referred to as the borealization of Arctic ecosystems (Fossheim et al., 2015; Polyakov et al., 2020) and are associated with the northward expansion of boreal (subarctic) species into the Arctic with potentially large impacts on Arctic marine food webs (Kortsch et al., 2015).
Although many biological studies have been conducted in the Chukchi Sea over recent decades, only a few examples provide integrated assessments across multiple trophic levels on broad geographical scales. For example, Sigler et al. (2011) characterized zooplankton, pelagic fishes, epibenthic organisms (fishes and invertebrates), and seabirds across the Bering, eastern Chukchi, and Beaufort Seas using data from a range of years, but with inconsistent spatial coverage. Sigler et al. (2017) followed up on the zoogeographic description of assemblages in Sigler et al. (2011) based upon sampling in 2012 and identified broad nearshore-offshore and north-south gradients in community structure, as well as a distinct assemblage encompassing species from multiple trophic levels on the northeastern Chukchi shelf.
Other studies encompassing multiple biological assemblages in this region include Day et al. (2013), who synthesized results from a localized study in the northeast Chukchi Sea that spanned the transition from a pelagic-dominated system in Pacific origin waters to a benthic-dominated system in Arctic waters. The former is characterized by lower benthic diversity, a higher biomass of oceanic zooplankton, and more fishes and planktivorous seabirds, while the latter has a higher biomass and density of benthic organisms, more neritic zooplankton, and more benthic-feeding mammals.
The characteristics of individual communities or assemblages relative to environmental variability during the ice-free season have been described for key assemblages in the eastern Chukchi Sea. Benthic infaunal species composition is related to sediment grain size, sediment water content, and C/N ratios of the organic fraction of surface sediments (Feder et al., 1994). Suspension feeders dominate in coastal areas on coarser substrate, while surface and subsurface deposit feeders dominate offshore on muddy substrates. Benthic epifauna is dominated by crustaceans (in particular, the snow crab Chionoecetes opilio) in deeper, offshore regions influenced by Bering Sea waters and by echinoderms (primarily brittle stars and sand dollars) in nearshore areas and south of Hanna Shoal (Ravelo et al., 2014). The composition of the epibenthic assemblage is primarily related to sediment characteristics and bottom water masses (Ravelo et al., 2014), with the biomasses of both benthic infauna and epifauna highest near the mouth of Barrow Canyon and south of Hanna Shoal, where abundant prey support large feeding populations of gray whales and walrus (Schonberg et al., 2014). The high biomass is sustained by advective supplies of organic matter associated with currents from the northern Bering Sea, as well as strong pelagic-benthic coupling and upwelling in Barrow Canyon (Grebmeier et al., 2006; Schonberg et al., 2014). Bottom fish assemblages are relatively species poor and are dominated by small cod-like fishes, sculpins, and flounders, with a higher abundance and diversity of species with Pacific affinities in the south (Norcross et al., 2013).
In contrast to benthic assemblages, which are often structured by substrate characteristics, pelagic assemblages, including seabirds, typically reflect the distribution of different water mass characteristics (Gall et al., 2013; Norcross et al., 2013; Questel et al., 2013). Although microbes (bacteria and protists) in the Chukchi Sea have been poorly sampled to date, recently Lee et al. (2019) have documented that surface bacteria show strong latitudinal gradients with a possible transition zone between the southern and northern Chukchi Sea. Protists in the Chukchi Sea include sea ice algae, which are gradually replaced by open-water phytoplankton and other single-celled plankton after the ice melts (Selz et al., 2018). Both sea ice-associated and open-water protist assemblages are typically dominated by large diatoms, which are the most important primary producers in the Arctic and play an essential role in carbon cycling, including the export of surface carbon to the seafloor. Zooplankton assemblages are dominated by expatriates from the Bering Sea in water masses of recent Pacific origin, whereas Arctic species or populations dominate in colder Arctic waters (Pinchuk and Eisner, 2017). In addition to an increasing trend in the abundance of Pacific-origin zooplankton over recent decades (Ershova et al., 2015), the distribution and composition of zooplankton assemblages varies greatly year to year due to differences in sea ice melt, water temperature, and advection (Questel et al., 2013). Seabirds migrate to the Chukchi Sea to feed on zooplankton or fish and often aggregate at feeding hotspots that are associated with oceanographic fronts where prey may concentrate (Kuletz et al., 2015). Consistent with an increase in zooplankton abundance, there has been an overall increase in planktivorous seabirds in the eastern Chukchi Sea over recent decades, although the spatial patterns and magnitudes of changes are highly species specific (Gall et al., 2017; Kuletz et al., 2020).
Here, we build on these and other prior efforts to better understand patterns in diversity and community composition within and across an expanded set of species assemblages ranging in scale from microbes to seabirds in a region spanning the transition from Pacific to Arctic waters. We use data from two multidisciplinary surveys conducted on the eastern Chukchi Sea shelf in 2015 and 2017 as part of the Arctic Marine Biodiversity Observing Network (AMBON; Iken et al., 2019). Our primary objectives are to (1) evaluate spatial patterns in the diversity and species composition of these assemblages across the eastern Chukchi Sea, (2) test for differences in the diversity and species composition of multiple assemblages between 2015 and 2017, (3) assess linkages between environmental drivers and each assemblage, and (4) quantify the strength of cross-assemblage connections. Ultimately, these objectives can lead to a better understanding of how the biological community responds to environmental variability, including climate change, in this rapidly transforming region.
Methods
Study Region
The Chukchi Sea, together with the northern Bering Sea, forms a shallow inflow shelf that connects the Pacific Ocean to the Arctic Ocean (Figure 1). Waters entering through the Bering Strait advect heat, nutrients, and organisms from the Bering Sea to the Chukchi Sea (Hunt et al., 2016; Woodgate, 2018). The flow through the Bering Strait transports about 1.0 Sv northward, with stronger flow in the summer than in winter (Roach et al., 1995; Woodgate et al., 2005), an increase from about 0.8 Sv over recent decades (Woodgate, 2018). The Bering Strait region and the Chukchi Sea form a transition zone between subarctic and arctic communities that is characterized by strong gradients in species composition, diversity, and abundance of fish and invertebrates (Stevenson and Lauth, 2012; Sigler et al., 2017; Iken et al., 2019). The shallow Chukchi Sea shelf is characterized by high primary production fueled by both advected and regenerated nutrients that support high standing stocks of zooplankton and a rich community of benthic invertebrates (Grebmeier et al., 2015). High local production combined with advection of zooplankton through the Bering Strait attracts large numbers of seabirds and marine mammals, many of which seasonally migrate to the Chukchi Sea to take advantage of abundant prey (Hunt et al., 2013; Kuletz et al., 2015). As in other Arctic shelf systems, high benthic productivity in the Chukchi Sea ecosystem is driven by tight pelagic-benthic coupling linked to the timing of the seasonal sea ice retreat (Grebmeier et al., 2006).
The Pacific water signature extends into the northeastern Chukchi Sea but varies in spatial extent from year to year (Weingartner et al., 2017). During summer, a strong frontal zone separates Pacific waters extending northward into the Chukchi Sea from Arctic waters that typically consist of cold bottom water from the previous winter and meltwater at the surface (Weingartner, 1997). The position of the front varies among years, resulting in interannual variations in the distribution of zooplankton and their predators (Day et al., 2013). The AMBON study approach used cross-shelf and along-shelf transects encompassing Pacific to Arctic transition points to sample the multiple water masses occupying the eastern Chukchi shelf (Figure 1).
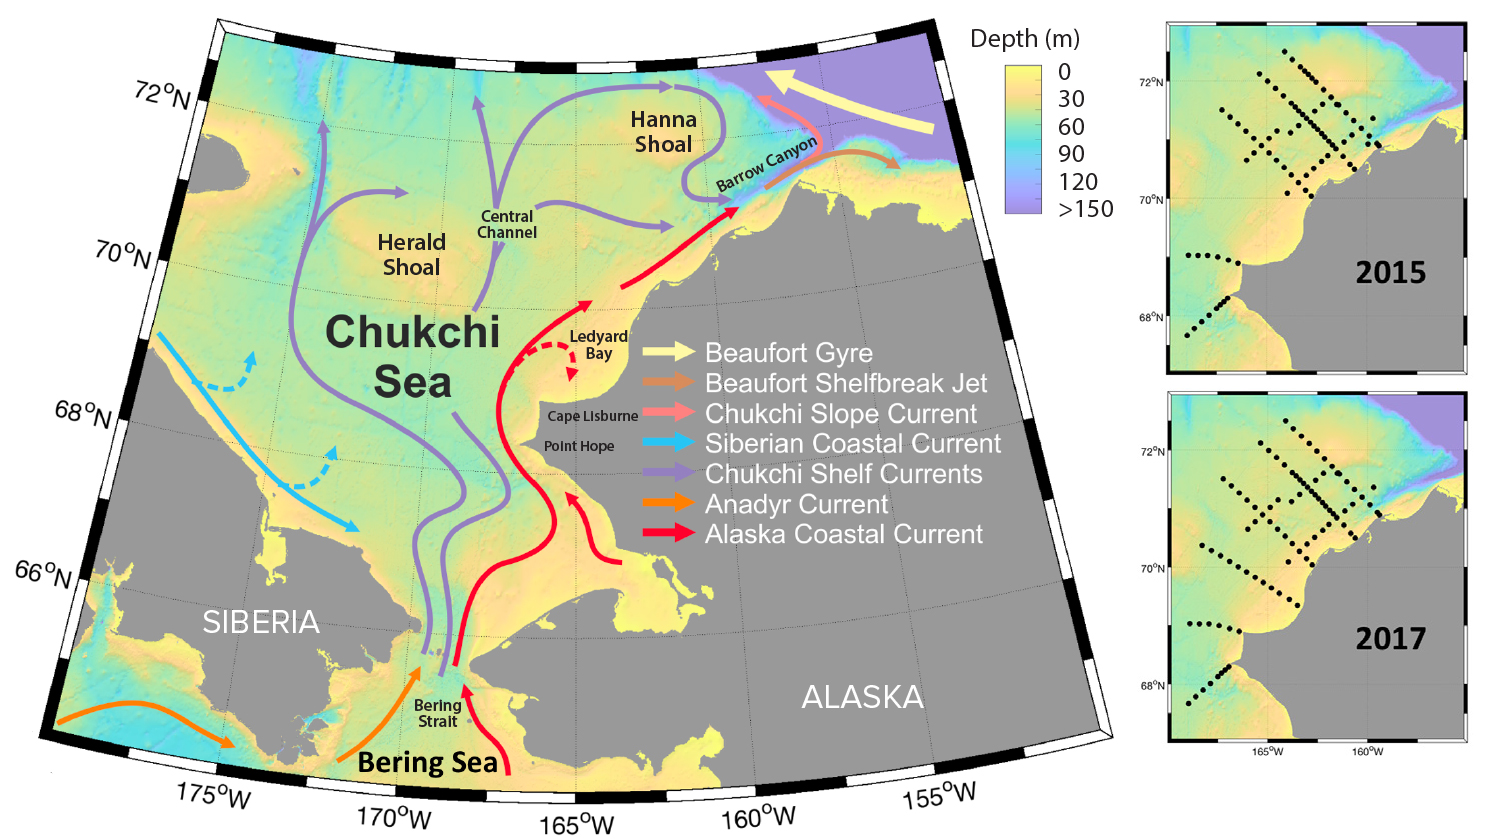
Figure 1. Map of the Arctic Marine Biodiversity Observing Network (AMBON) sampling region showing bathymetry and major currents, as well as stations sampled in 2015 and 2017. > High res figure
|
Data Collection
All data presented here were collected as part of the AMBON project (Iken et al., 2019). Oceanographic and ecosystem surveys were conducted onboard R/V Norseman II in the Chukchi Sea between 67°40'N and 72°30'N (Figure 1) during the summers of 2015 (August 10 to September 3) and 2017 (August 7 to August 22). Biological sample coverage varied among major biological assemblages and between years (Table 1), with collections at a total of 67 main stations in both years and along an additional transect with 12 stations mid-shelf in 2017 (Figure 1). Most analyses were conducted using all available stations, unless otherwise noted.
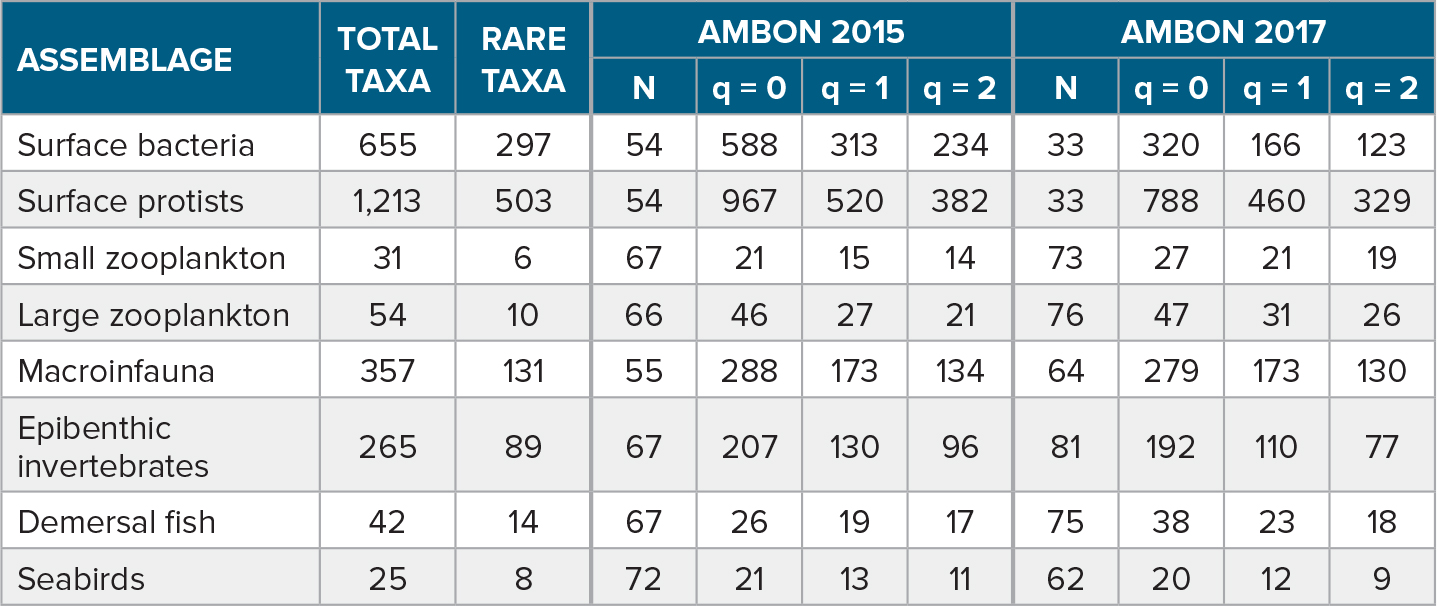
Table 1. Assemblages and total number of taxa sampled during AMBON surveys in 2015 and 2017, as well as the number of rare taxa that occurred at fewer than four stations and were excluded from multivariate analyses. Values shown for each survey year include the number of stations available for analysis of a given assemblage (N) and values for three metrics of species diversity (Hill numbers, q). These metrics estimate the number of species (richness, q = 0) or the equivalent number of species (Simpson diversity, q = 1; Shannon diversity, q = 2) expected to be captured at 50 stations. Hill numbers were obtained through rarefaction if N >50 or extrapolation if N <50. > High res table
|
At each station, water column properties were profiled using a CTD (Sea-Bird SBE 911), and water samples were collected at discrete depths for inorganic macronutrient, stable oxygen isotope, chlorophyll-a, and microbial (environmental DNA, or eDNA) analyses. Zooplankton were collected using vertically hauled 150 μm and obliquely towed 505 μm plankton nets; surface sediment samples were collected using a 0.1 m2 weighted van Veen grab for assessing sediment surface chlorophyll, organic carbon, nitrogen, grain size, and benthic macroinfauna; and a small beam trawl was deployed to collect demersal fish and epibenthic invertebrates. The presence and identity of microbes were assessed through metagenomics shotgun sequencing of filtered eDNA samples using two primers targeting the 16S rRNA gene (bacteria and archaea) and the 18S rRNA gene (eukaryotes) (Stoeck et al., 2010; Apprill et al., 2015). Zooplankton and benthic macroinfauna were preserved at sea for sorting and identifying in the laboratory to the lowest practical taxonomic resolution. Fish and epibenthic invertebrates were identified and their biomasses determined in the field to the lowest practical taxonomic resolution, or they were returned to the laboratory for identification. In addition, seabirds were assessed using visual sampling methods along the ship’s track during daylight hours. Additional sampling details are provided in Iken et al. (2019).
A total of eight assemblages were assessed in the present analysis, including surface water bacteria and protists, small and large zooplankton, benthic macroinfauna, epibenthic invertebrates, demersal fish, and seabirds. Small zooplankton was defined as taxa whose adult size was less than ~2 mm as sampled with the 150 µm mesh net, while large zooplankton consisted of larger taxa as sampled with the 505 µm mesh net, including gelatinous zooplankton. Macroinfauna was defined as >1 mm, so excluding meiofauna, but also excluding motile epifauna and encrusting epibenthos. For quantifying diversity and species composition, we used the lowest possible taxonomic resolution, typically at the species or genus level (Supplementary Table S1). Unless known to be a distinct species or taxon, unidentified species were aggregated at the genus or higher level; otherwise, they were excluded from analysis. An exception was seabirds, for which unidentified species were apportioned within a genus based on identified birds (see Kuletz et al., 2020, for details). This implies that for most assemblages some distinct taxa may not be accounted for at a given station or overall, resulting in a probable underestimation of taxonomic diversity. However, consistent taxonomic resolution was applied across all stations within a year and between the two years for a given assemblage type. The number of taxa analyzed ranged from 25 for seabirds to 1,213 for surface protists (Table 1).
For assessing diversity, only presence (1) or absence (0) of each taxon at each station was considered. For multivariate analyses of species composition, presence-absence data were also used for bacteria and protists because abundance estimates may not be reliable. For other assemblages, abundances were standardized as biomass per unit volume (zooplankton), numbers per unit area (fish, seabirds), or biomass per unit area (infauna, epifauna). For consistency, and to facilitate comparisons across assemblages, all analyses were conducted using stations as the basic sampling unit. For zooplankton, epibenthos and demersal fish, a single sample was typically processed per station. However, between one and three stations located at the intersection of two transects (Figure 1) were sampled twice for zooplankton, benthic macroinfauna, and seabirds. For the current study, these samples and associated environmental parameters were averaged by station. For assessing macroinfaunal biomass, up to four 0.1 m2 grab samples were processed and averaged following Grebmeier et al. (2018). Strip-transect-based estimates of seabird density were calculated for ~3 km segments (Kuletz et al., 2020), which were then aggregated to the nearest sampling station (using a threshold of 10 km) by computing the average density across all segments associated with that station. Sampling effort was consistent across stations for eDNA samples but varied across stations for zooplankton (volume filtered: 11–81 m3 for 150 µm nets, 96–615 m3 for 505 µm nets), epibenthos and demersal fish (area swept: 113–1,138 m2), macroinfauna (number of grabs: 1–4), and seabirds (total km surveyed: 5.84 km to 61.2 km). Therefore, effort was considered as a covariate in statistical analyses. However, zooplankton abundances were determined through stratified subsampling that resulted in approximately the same number of individuals identified at each station; thus, no adjustment for volume filtered was made. Sensitivity analyses were conducted to assess the impact of removing stations from the analysis that were sampled only in 2017 along the added transect (Figure 1). The results suggested very minor differences in the estimated diversity metrics, and conclusions did not change; therefore, we included all available data in the results presented here.
Environmental Variables
Patterns in community composition were assessed in relation to local environmental conditions at each station and for differences between sampling years. Variables considered in the analysis included surface and bottom water temperatures and salinities, integrated water column chlorophyll, nutrient concentrations in near-bottom waters (ammonium, phosphate, silicate, nitrate + nitrite), sources of freshwater present in surface and bottom water (i.e., proportions of river runoff and sea ice melt), a stratification index computed as the mean water column density gradient, and sediment characteristics (Table S2). The proportions of different water masses in surface and near-bottom waters were estimated from salinity and stable isotope (δ18O) ratios using a mixing model with three end members: deep Pacific waters (salinity = 34.7, δ18O = –0.17; Craig and Gordon, 1965), river runoff (salinity = 0, δ18O = –21.5; Cooper et al., 2006), and sea ice melt (salinity = 4, δ18O = –1; Logvinova et al., 2016). Due to strong correlations among many of the sediment characteristics, the number of surface sediment variables was first reduced using a principal component analysis (PCA) of grain size proportions (phi sizes from 0 to 5), total organic carbon (TOC), total organic nitrogen (TON), the C/N ratio, chlorophyll in surface sediments, and stable isotope ratios for nitrogen (δ15N) in the organic fraction of surface sediments. To reduce skewness in the grain size metrics of the coarse fraction, all values for phi 0–phi 3 were fourth-root transformed prior to the PCA. The first three principal components accounted for 83% of the variability in sediment characteristics, with the first PC alone accounting for 51%. These three PCs were readily interpreted based on their component loadings. Specifically, high values of PC1 describe sediments with a high proportion of sand (high positive loadings on phi 1–phi 3), a low proportion of silt and clay (high negative loading on phi 5), and low organic content (negative loadings on TOC and TON). PC2 reflected a gradient from sediments with a high proportion of coarse sand and gravel (high positive loadings on phi 0 and phi 1), no fine sands, relatively high organic content (TOC, TON), and a high C/N ratio on one end of the gradient (high PC2 values) to sediments with the opposite characteristics on the other end (low PC2 values). Finally, high values of PC3 also reflected a high proportion of very coarse sediments (high positive loadings on phi 0 and phi 1) but, in contrast to PC2, were associated with low C/N ratios and high δ15N values. The PCs were used as sediment covariates in the analysis in place of individual variables to minimize multi-collinearity and reduce the number of explanatory variables.
Graphical and Statistical Analyses
We compared taxonomic diversity and species composition between years and relative to environmental gradients. First, we computed and visualized three metrics of taxonomic diversity for each assemblage by year, including species richness, Shannon diversity, and Simpson diversity. We then calculated and mapped local species richness by year and assessed relationships between diversity and water mass characteristics (temperature and salinity). Finally, we visualized patterns in species composition by year and related differences in species composition to environmental variables.
Taxonomic Diversity
Following Ellison (2010), we used Hill numbers of orders q = 0, 1, and 2, corresponding to species richness, Shannon diversity, and Simpson diversity, respectively (Chao et al., 2014). Simple species richness disregards relative abundances, thereby emphasizing each species equally and effectively highlighting rare species in an assemblage. Hill numbers of order q > 0 emphasize more abundant species and can be interpreted as the equivalent number of common species (Shannon diversity, q = 1) or dominant species (Simpson diversity, q = 2) (Chao et al., 2014).
We used the presence (1) or absence (0) of species in each sampling unit (station) to estimate biodiversity and its uncertainty across stations at the scale of the study region. Because the number of species detected depends on the number of stations sampled (N), and those relationships may differ among assemblages, we used a rarefaction and extrapolation framework (Colwell et al., 2012) to compare metrics of diversity over a range of sampling efforts (number of stations). We estimated the expected number of actual or equivalent species for sample sizes from 1 to 81, the latter being the maximum number of stations sampled within a year. For sample sizes smaller than the observed number of samples, we used sample-based rarefaction (interpolation) to obtain the expected number of species. For larger sample sizes, we extrapolated Hill numbers using the predicted number of species (or equivalent species) based on a Bernoulli product model (Colwell et al., 2012). The expected number of species or equivalent species as a function of sample size was visualized using species accumulation curves by sampling year for each assemblage. We also summarized the expected number of taxa caught in a “standard survey” consisting of a random sample of 50 stations. We estimated Hill numbers for each assemblage and year and constructed 95% confidence intervals for each estimate using a bootstrap approach (Chao et al., 2014) as implemented in the iNEXT package version 2.0.20 (Hsieh et al., 2016).
Local Species Richness
To examine spatial patterns in species richness for each assemblage, we used the number of species sampled at each station (hereafter local richness). Prior to mapping, we tested whether local richness was influenced by sampling effort. We first tested for statistically significant relationships between local richness and measures of sampling effort (area or volume sampled, number of van Veen grabs, or transect length) using a penalized regression spline and assuming that the number of species follows a Poisson distribution (Wood et al., 2016). If a significant relationship was found, local species richness was adjusted for the estimated effect of sampling effort by adding the residuals from the fitted model to the predicted mean richness at the average sampling effort and rounding to the nearest integer. To compare spatial patterns in richness of an assemblage between years, we mapped the estimated local richness by year, as well as the difference in species richness between 2015 and 2017.
Finally, exploratory scatter plots suggested linear relationships between local richness and water characteristics, especially temperature, for most assemblages. To assess the strength of these relationships and compare them between years, we fit linear regressions of local species richness on surface temperature and salinity (pelagic assemblages and seabirds) or bottom temperature and salinity (benthic assemblages) by sampling year. The relative magnitude of the effects of temperature or salinity and interannual differences on diversity was compared using partial coefficients of determination.
Species Composition
Differences and similarities in species composition among stations and between years were quantified and visualized for each assemblage using a non-metric multidimensional scaling (NMDS) ordination based on pairwise Bray-Curtis dissimilarities (Beals, 1984). To quantify species composition, we used presence or absence (microbes), effort-standardized abundances (zooplankton, fish, birds), or effort-standardized biomass (infauna, epifauna) of each taxon at each station. Standardized abundances and biomass are referred to as catch per unit effort (CPUE). Prior to computing Bray-Curtis dissimilarities, CPUE values were fourth-root transformed to reduce the influence of occasional large catches. To give equal weight to each taxon in the analysis, transformed values were standardized by taxon to a maximum of 1. Because of the large number of environmental variables considered, and to reduce the chances of identifying spurious relationships, we first identified the set of environmental variables that had the strongest overall Mantel correlation with the species composition of a given assemblage (Clarke and Ainsworth, 1993). Using this set of environmental variables, as well as a categorical variable for sampling year to test for any unexplained interannual differences in species composition, we quantified the effects of the variables on species composition using permutation-based multivariate analyses of variance (PERMANOVA; Anderson, 2001). The unique contribution of each variable to explaining variability in species composition (after accounting for the effects of all other variables) was quantified using marginal R2 values (McArdle and Anderson, 2001). Multivariate analyses were implemented using the vegan package for R, version 2.5.6 (Oksanen et al., 2019).
To interpret differences in species composition between the two sampling years, we identified taxa whose CPUE differed between years. Because of the large number of microbial taxa, we aggregated presence/absence data for bacteria and protists at the phylum level. For microbes, the incidence (frequency of occurrence) of each phylum was compared between years using a generalized linear model with a binomial (0/1) response. For other assemblages, taxon-specific CPUEs were compared between years using two measures. First, we computed proportional changes in CPUE between 2015 and 2017 for each taxon to illustrate the relative magnitude of change ranging from –1 (100% decline to a mean CPUE of zero in 2017) to infinity (any increase from a mean CPUE of zero in 2015). Second, we computed changes in the mean log-transformed CPUE of a given taxon between years and their standard errors (SE). For each taxon, the magnitude of change in log(CPUE) between years was standardized relative to the variability in CPUE across stations by computing the t-statistic (mean/SE). Only taxa with a significant difference in CPUE (p <0.05) are shown.
Finally, we assessed the strength of cross-community associations by computing pairwise Mantel correlations based on Bray-Curtis dissimilarity matrices for each combination of assemblages and for each year separately. For each pairwise Mantel correlation we used the set of stations where both assemblages were sampled. Mantel correlations were computed using rank-based Spearman correlations. All statistical analyses were done in R version 4.0.3 (R Core Team, 2020) and the underlying data and code are available at https://doi.org/10.5281/zenodo.5527125.
Results
Water column properties differed between 2015 and 2017 with significantly elevated temperatures and salinities observed in 2017 compared to 2015 (Table S2). Spatial patterns in these differences varied with surface temperatures and bottom salinities in 2017 elevated at the more southern stations, while bottom temperatures and surface salinities tended to be more elevated at the northernmost stations (Figure 2). These patterns reflect elevated northward transport of warmer (>0°C), more saline Pacific waters in 2017 compared to 2015 (Woodgate and Peralta-Ferriz, 2021). Overall taxonomic diversity in the study region, as measured by three metrics, differed significantly between years for most assemblages (Figure 3, Table 1). Differences in diversity were generally consistent across sample sizes and among the three diversity metrics, suggesting that the patterns were not primarily driven by either rare or common species. Exceptions were the large zooplankton and epibenthic invertebrate assemblages, which showed differences in species richness for intermediate numbers of stations sampled but converged at larger sample sizes, while the Simpson and Shannon indices suggested consistent differences across sample sizes. Diversity was higher in 2017, the warmer year, for the zooplankton and fish assemblages but was higher in 2015 for bacteria, protists, epibenthos, and seabirds (Figure 3). Diversity did not differ significantly between years for benthic macroinfauna. Differences were particularly pronounced for microbes, with the expected number of species sampled at 50 stations being 84% and 23% higher in 2015 compared to 2017 for bacteria and protists, respectively (Table 1). These microbial differences were large for all three diversity measures, suggesting that they were not primarily due to the influence of rare taxa.
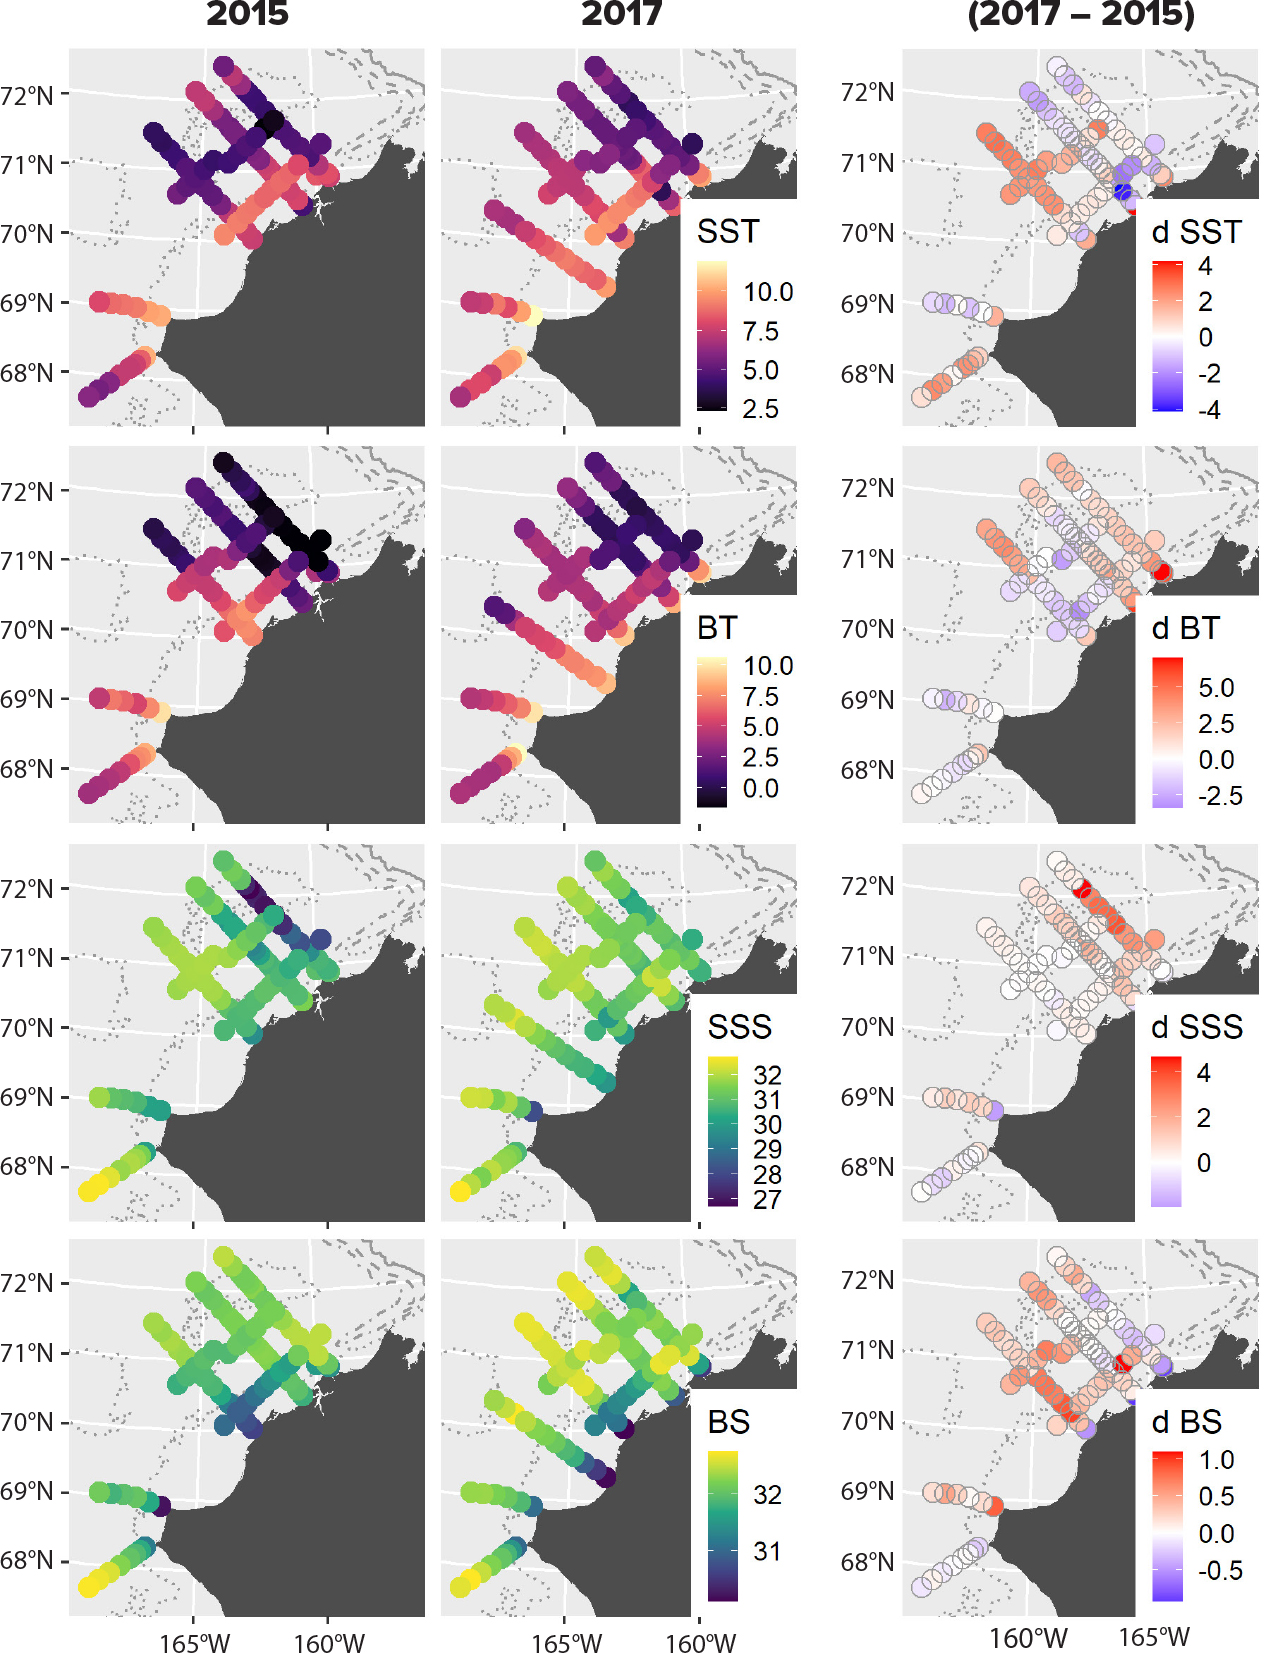
Figure 2. Spatial gradients in surface (SST, SSS) and bottom (BT, BS) temperatures and salinities recorded during AMBON sampling in 2015 (left column) and 2017 (center column) and differences between years at stations sampled in both years. Note differences in scale between surface and bottom data. Positive values (red) indicate higher temperatures or salinities in 2017. > High res figure
|
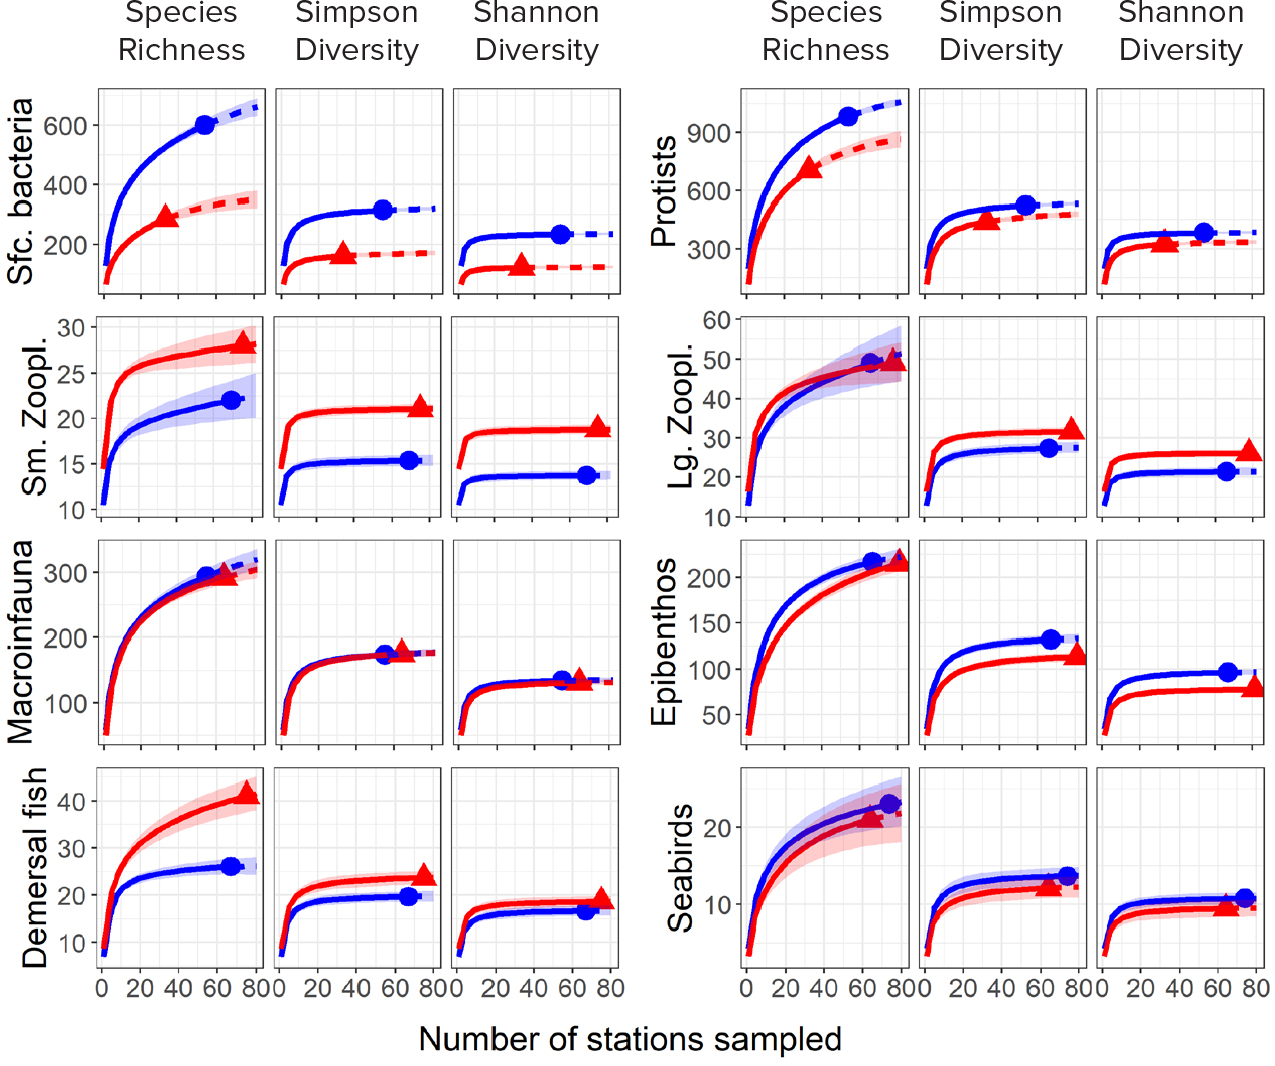
Figure 3. Diversity accumulation curves for three metrics of species diversity (Hill numbers)—species richness, Simpson diversity, and Shannon diversity—by assemblage and sampling year (blue: 2015, red: 2017). Assemblages are noted along the y-axis with lines indicating the expected number of species and shading denoting 95% bootstrap confidence bands. > High res figure
|
Spatial patterns in local (station-level) richness differed among assemblages and showed contrasting differences between years (Figure 4). Local species richness was patchy, with hotspots on the northern portions of the shelf for bacteria, benthic macroinfauna, and epibenthic invertebrates, while other pelagic assemblages (zooplankton and seabirds) and mobile demersal fish typically had higher species richness along the more southern transects. Across much of the study region, local richness increased between 2015 and 2017 for zooplankton and fish but tended to decrease for microbes and benthic macroinfauna and epifauna. Although total species richness for seabirds was slightly lower in 2017 (Figure 3), some of the northern stations had higher richness that year (Figure 4). Spatial patterns for protists and large zooplankton were similar to those for bacteria and small zooplankton, respectively, and are not shown.
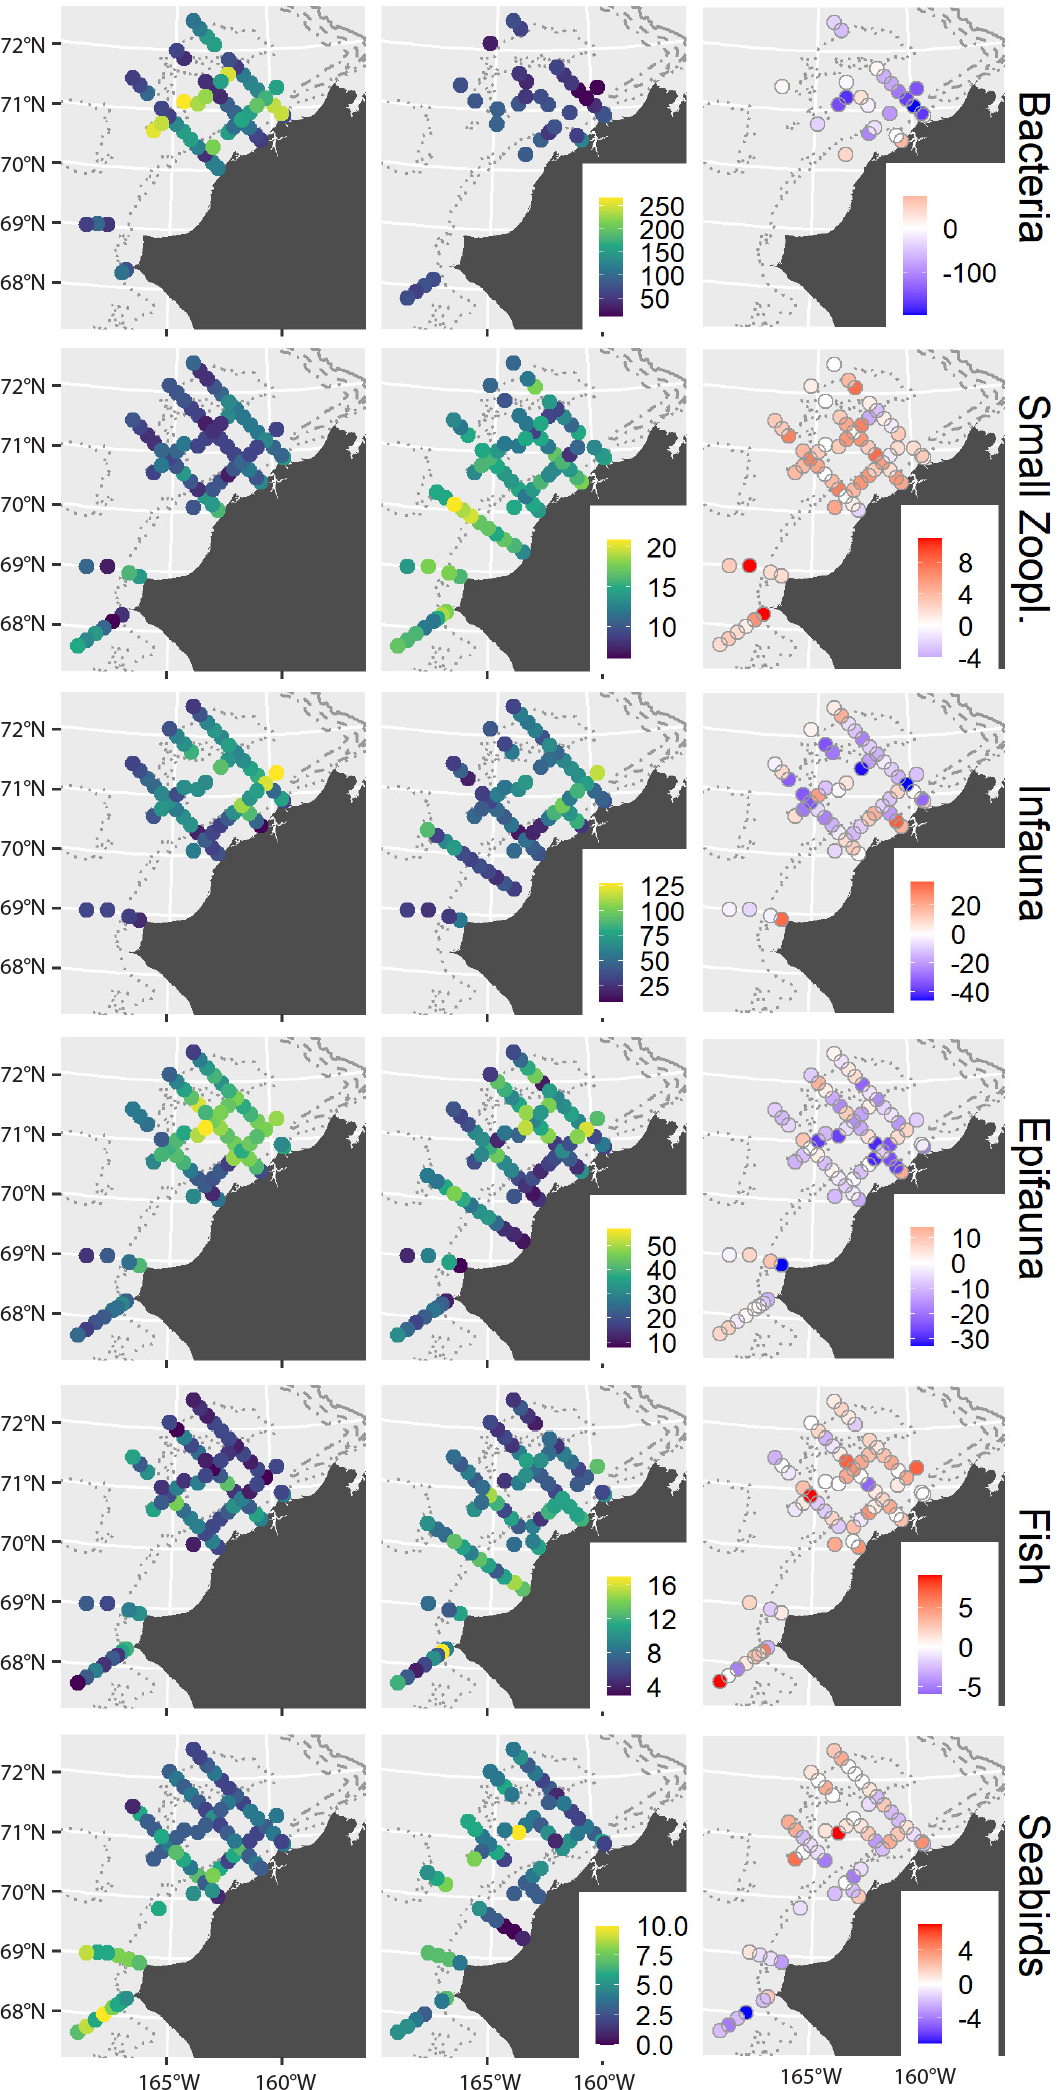
Figure 4. Spatial gradients in local species richness of six assemblages sampled during AMBON 2015 (left column) and 2017 (center column), with lighter colors and larger sizes denoting higher species richness. Shading in the right column shows differences in local richness (number of species) between years, with blue colors indicating higher richness in 2015. > High res figure
|
Differences in local richness were associated with variations in surface or bottom temperatures (Figure 5). These relationships were mostly consistent between years, and slopes were significant in at least one year. Local richness of benthic macroinfauna and epibenthos in both years and of large zooplankton in 2017 decreased significantly with temperature (p < 0.001), whereas local richness of fish in both years and of bacteria, protists, and seabirds in 2015 increased significantly with temperature (p < 0.001, p = 0.034, and p = 0.005, respectively, Figure 5). In contrast to large zooplankton, the local richness of small zooplankton increased significantly with temperature across the study region in 2017 (p < 0.001). Local temperature effects accounted for more of the variability in species richness than interannual differences for macroinfauna, epibenthos, and demersal fish, whereas interannual differences were more pronounced than local temperature effects for microbes and zooplankton. Although species richness was also significantly related to salinity for macroinfauna, epifauna, fish, and seabird assemblages, with the exception of seabirds, none of these relationships were significant when both salinity and temperature were included in the same models (p > 0.05, with or without interaction), suggesting that temperature was the primary driver of species richness. For seabirds, we found that species richness was significantly and positively associated with both sea surface salinity (p = 0.001) and sea-surface temperature (p = 0.015, Figure 5).
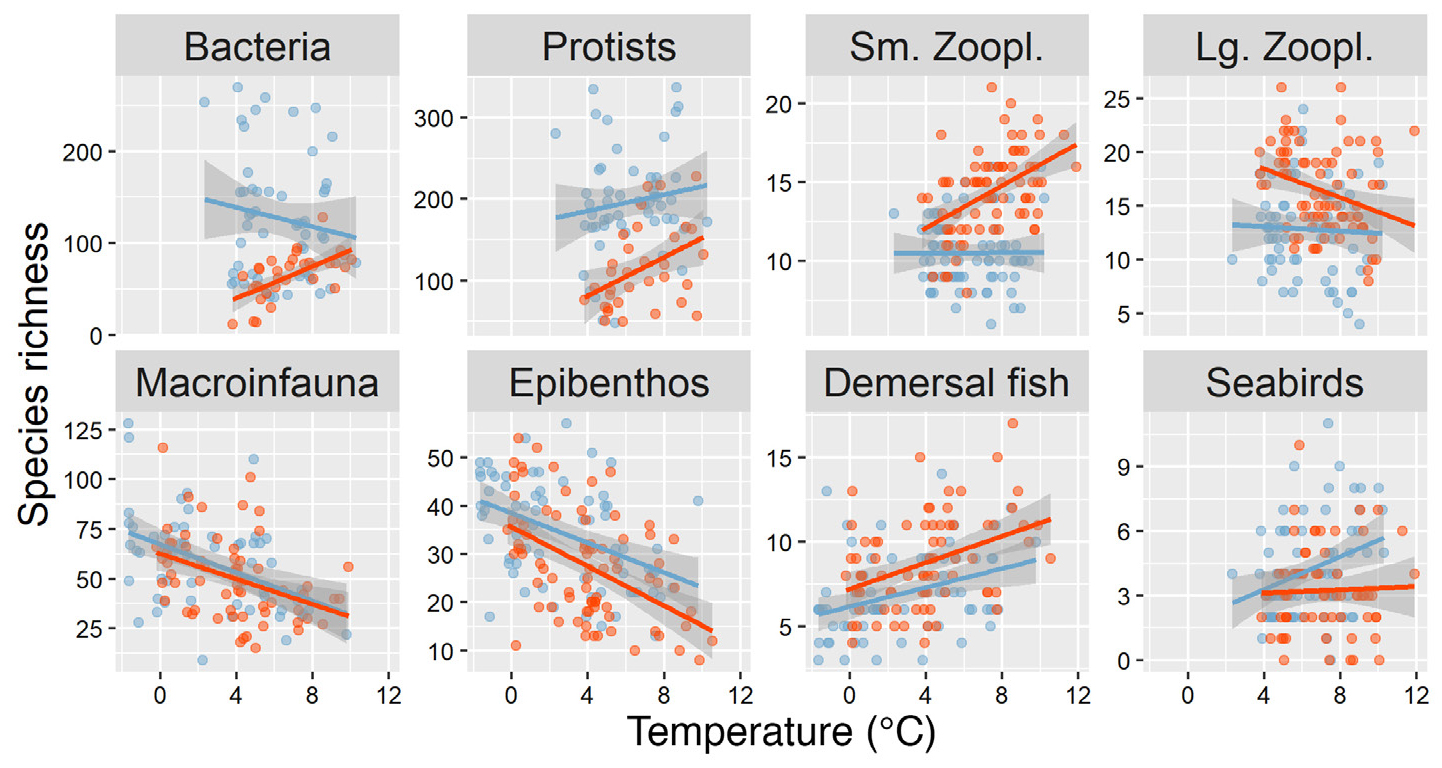
Figure 5. Local species richness against temperature with estimated linear relationships and 95% confidence bands by year (blue for 2015, orange for 2017). Bottom temperatures were used for benthic communities (macroinfauna, epibenthos, demersal fish), sea surface temperatures for other assemblages. > High res figure
|
Species composition of each assemblage across stations was strongly associated with two to four environmental gradients and showed the most pronounced differences between years for microbes and large zooplankton (Figure 6, Table S3). Bacteria were significantly associated with surface temperatures and salinities, as well as with the fraction of sea ice melt present, while protists were primarily associated with sea surface temperature and bottom layer nutrient concentrations (Table S2). These environmental variables accounted for a total of 16% (bacteria) and 17% (protists) of the variability in species composition with other, unexplained differences between years accounting for a relatively large fraction of the remaining variability (10% and 13%, respectively). The species composition of both small and large zooplankton was primarily associated with bottom water characteristics (temperature and salinity), as well as with surface temperature and chlorophyll-a concentration (large zooplankton only). Together, environmental variables accounted for 19% (small zooplankton) and 17% (large zooplankton) of the variability in species composition, with other interannual differences accounting for an additional 9% and 11%, respectively (Table S3). The three benthic assemblages were primarily associated with sediment gradients and bottom water characteristics (temperature and salinity). The environmental gradients accounted for 18% (infauna) and 22% (epibenthos, demersal fish) of the variability in species composition. In addition, there were small but significant differences in species composition between years that were not accounted for by the environmental variables (marginal R2 = 2%, 4%, and 4%, for infauna, epibenthos, and fish, respectively, Table S3). Similar to zooplankton, seabirds were significantly associated with bottom water characteristics that together accounted for 16% of variability in species composition, with other interannual differences accounting for an additional 7%.
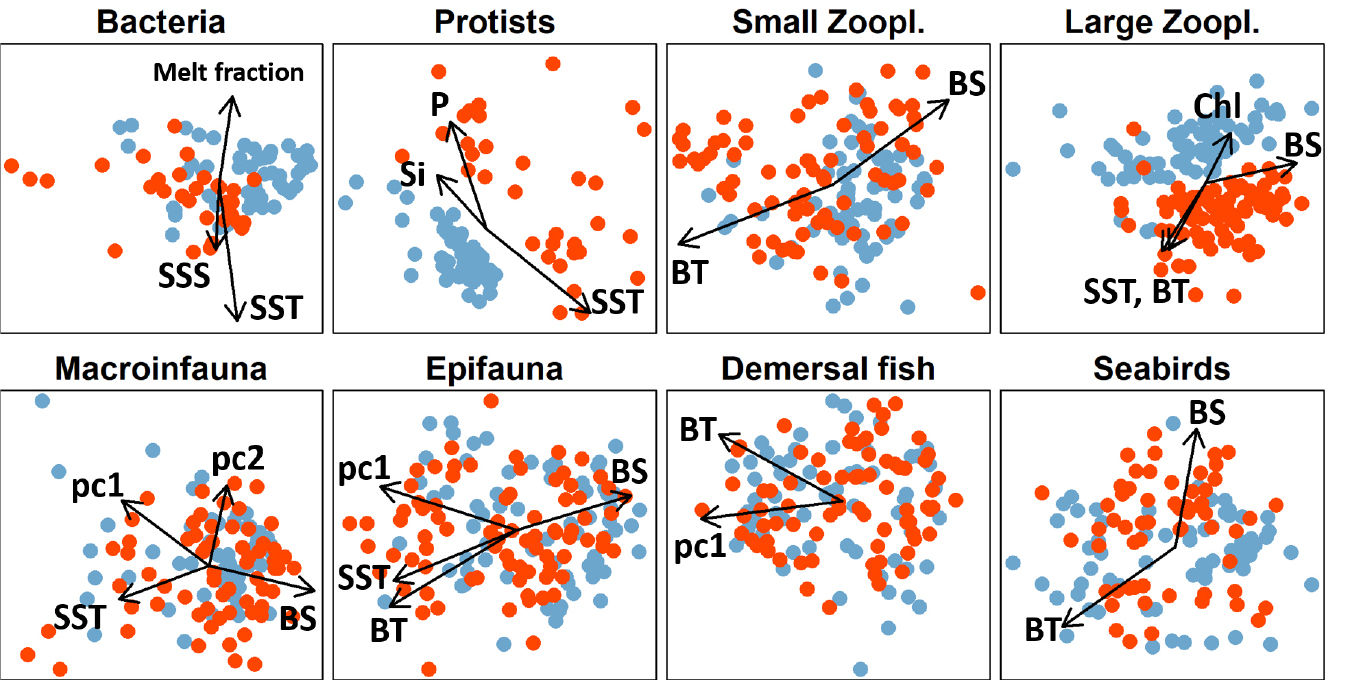
Figure 6. Non-metric multidimensional scaling (NMDS) ordinations of eight assemblages sampled in 2015 (blue) and 2017 (orange) in the space of the first two NMDS axes. Arrows indicate significant relationships between assemblage compositions and environmental variables based on correlations between each environmental variable and the biological ordination axes. Environmental variables included surface and bottom water temperature (SST, BT) and salinity (SSS, BS), bottom water nutrient concentrations (Nitrite/nitrate N, phosphate P, silicate Si), integrated chlorophyll-a (Chl), fractions of sea ice melt and freshwater runoff, and three measures of sediment characteristics (pc1–pc3) from a principal components analysis (see text for interpretation). > High res figure
|
The proportion of taxa in an assemblage that changed significantly between 2015 and 2017 ranged from 8% (protists) to 48% (small zooplankton). All microbial groups that changed significantly decreased in frequency of occurrence (FO) in 2017 (Table S4). Similarly, the FO and CPUE of a majority of infaunal, epibenthic, and seabird taxa with significant changes decreased, whereas those of a majority of zooplankton and fish taxa increased in 2017 (Table S4). Of 31 small zooplankton taxa, the CPUE of 12 species increased significantly, while that of only three species decreased significantly. Five taxa that were not observed in 2015 were caught at 6 to 23 stations in 2017 (Cerianthus spp., Tortanus discaudatus, Sipuncula, Oithona setigera, Plotocnide borealis; Table S4). Among 22 large zooplankton taxa with significant changes, the FO of 12 and the CPUE of 13 increased in 2017; two taxa, Hippolytidae and Aeginopsis laurentii, were not observed in 2015, but in 2017 were caught at 60 and 16 stations, respectively. Out of a total of 352 infaunal taxa, the FO and the CPUE of 31 decreased, while those of 13 increased, including five taxa that were not caught in 2015 but were caught at 10 or more stations in 2017 (Maldane glebifex, Retusa obtuse, Nutricola lordi, Nephasoma spp., Nephtys ciliata) and five taxa that were only observed in 2015. The CPUE of 37 out of 259 epibenthic invertebrate taxa decreased, while the CPUE of only 13 taxa increased. The most significant decreases occurred in Gammaridae, Musculus glacialis, Arcteobia anticostiensis, Diastylis alaskensis, and Henricia spp., with 12 additional species that were caught in 2015 but not in 2017. The most significant increases occurred in Eualus fabricii, E. macilentus, Crangon spp., and Retifusus roseus with six more species that were not caught in 2015 but were caught at four to 10 stations in 2017 (Table S4). The CPUE of six out of 41 fish taxa increased significantly and by more than fivefold between 2015 and 2017 (Aspidophoroides spp., Boregadus saida, Lycodes polaris, Leptoclinus maculatus, Anisarchus medius, Limanda aspera), while only one snailfish species (Liparis tunicatus) decreased significantly. In contrast, of five bird species whose CPUE changed significantly, all but one (Fulmarus glacialis [northern fulmar]) decreased by 30% to 90% (Phalaropus fulicarius [red phalarope], Ardenna tenuirostris [short-tailed shearwater], Aethia cristatella [crested auklet], Uria aalge [common murre]). Thus, both planktivorous and piscivorous seabirds declined in 2017.
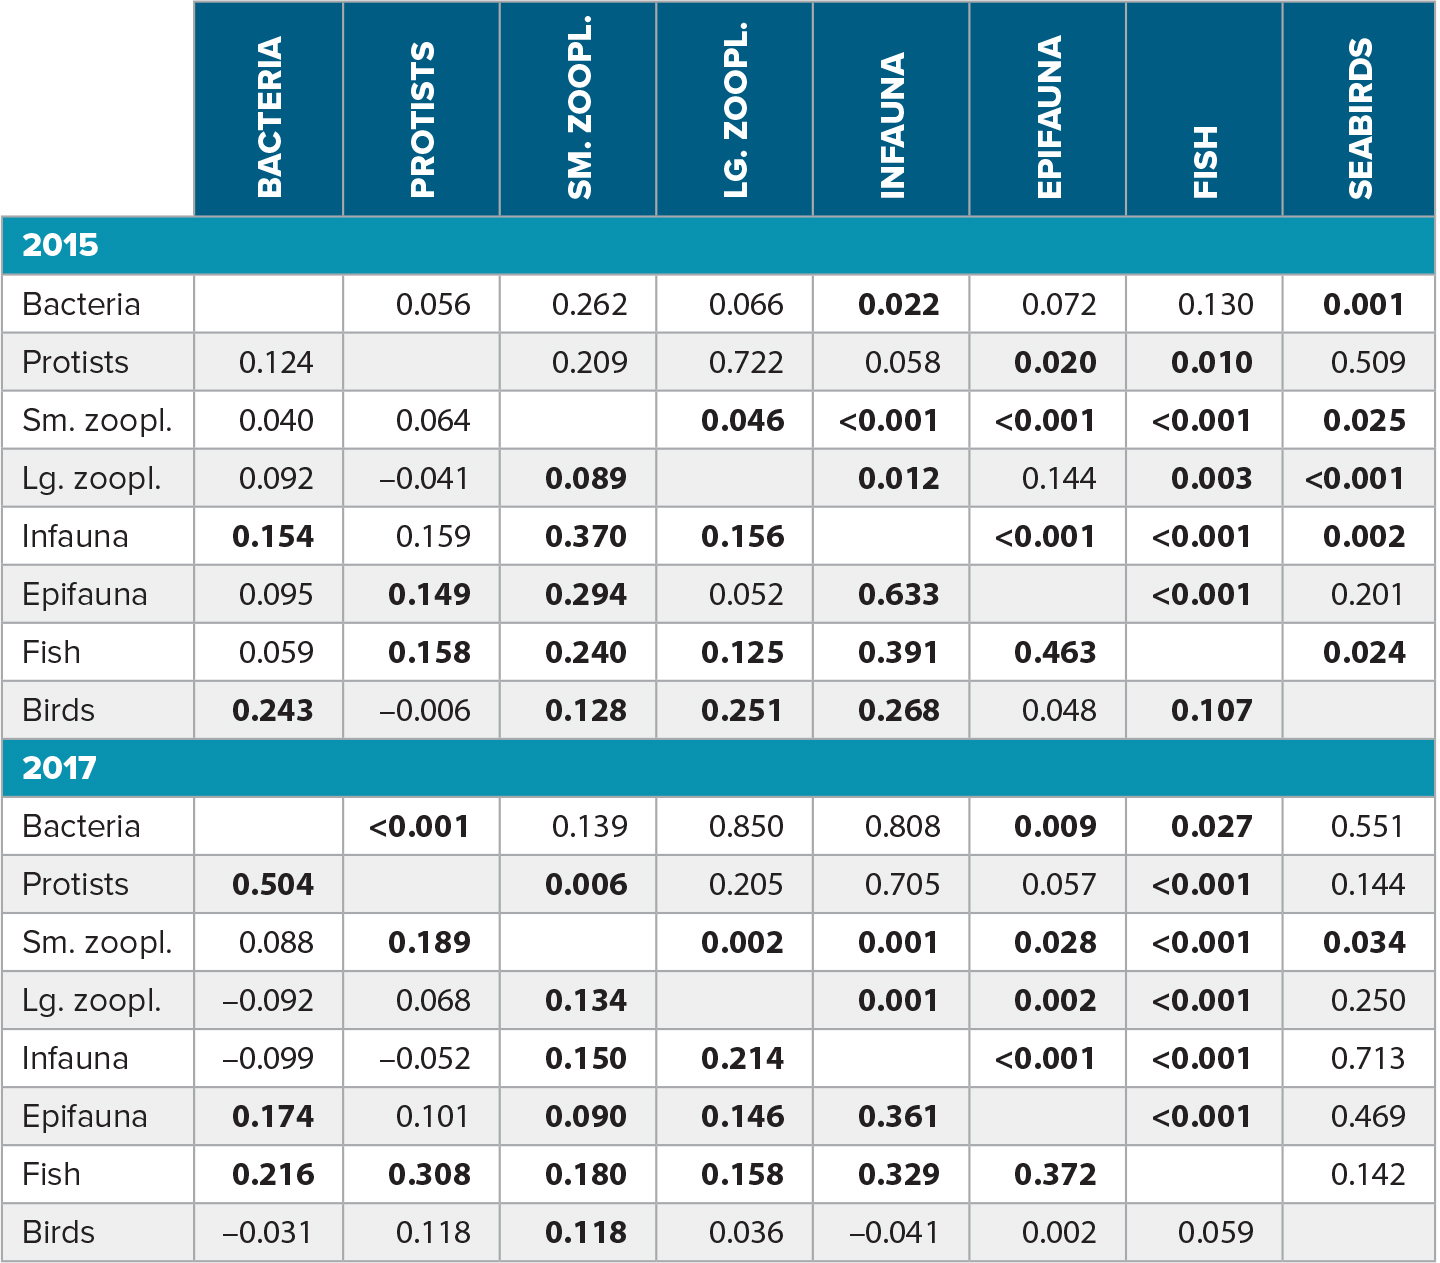
Associations across assemblages showed some consistencies between 2015 and 2017, but also revealed surprising differences (Table 2). With some exceptions, cross-assemblage linkages were weaker in 2017 (overall mean of pairwise Mantel correlations: r = 0.14) than in 2015 (r = 0.18). The differences were particularly pronounced for benthic macroinfauna (2015: r = 0.30, 2017: r = 0.12) and for seabirds (2015: r = 0.15, 2017: r = 0.04), suggesting a decoupling between these and other assemblages in 2017. In contrast, protists were strongly and significantly associated with bacteria in 2017 (r = 0.50, p < 0.001) but not in 2015 (p = 0.12, p = 0.056). The overall strongest association was found between benthic macroinfauna and epibenthic invertebrates in 2015 (r = 0.633, p < 0.001). Demersal fish were the only assemblage consistently associated with most other assemblages in both 2015 and in 2017. By contrast, seabirds were significantly associated with all assemblages except protists and epifauna in 2015, but with none of the assemblages in 2017 (Table 2).
Table 2. Cross-assemblage associations by year as quantified by pairwise Mantel correlations between Bray-Curtis dissimilarity matrices computed on a common set of stations that was sampled for both assemblages in a given year. Mantel correlations for each year are below the diagonal, and corresponding p-values are shown above the diagonal. Significant correlations (p < 0.05) are highlighted in bold. > High res table
|
Discussion
Contrasting physical conditions on the eastern Chukchi Sea shelf between 2015 and 2017 were associated with differences in taxonomic diversity and community composition across eight biological assemblages ranging from microbes to seabirds. Both study years were relatively warm, but 2017 brought greater intrusions of Pacific water that was more saline and extended much farther north over the shelf (Figure 2). Although some surface waters along the northernmost transects were cooler in 2017 than in 2015, observed salinities and oxygen isotope ratios suggest that sea ice meltwater was largely absent over the shelf in 2017 (maximum 2.5% fraction of surface waters in 2017 compared with 5.8% in 2015; Table S2). These physical differences and the resulting biological changes are broadly consistent with ongoing borealization of Arctic marine ecosystems, which is particularly pronounced on Arctic inflow shelves such as the Bering and Chukchi shelves and in the Barents Sea
(Mueter et al., in press).
Borealization of the Chukchi Sea Shelf
Recent spatial and temporal gradients in diversity and species composition in the Bering and Barents Seas have been associated with the northward expansion of mobile predators, such as demersal fish and large invertebrates, and a resulting reorganization of the benthic food web (Mueter and Litzow, 2008; Fossheim et al., 2015; Kortsch et al., 2015). Our results suggest that similar processes, commonly referred to as borealization of Arctic systems, may also be altering assemblages in the Chukchi Sea. Observed decreases in the diversity of benthic fauna and increases in the diversity of demersal fish and small zooplankton, along a spatial temperature gradient from warmer subarctic to colder Arctic waters (Figure 5), are consistent with corresponding decreases and increases in the diversity of most assemblages as the Chukchi Sea warmed between summer 2015 and summer 2017 (Figure 3). The taxonomic compositions of these assemblages, as well as those of large zooplankton and seabirds, were associated with gradients in near-bottom temperatures and salinities (Figure 6), which primarily reflect the origin of water masses in the Bering Sea for regions strongly influenced by oceanic advection. This suggests that even for pelagic assemblages, water origin may be a strong driver of assemblage composition in addition to local processes that modify surface waters in the Chukchi Sea (e.g., summer heating [Lu et al., 2020] and winter freezing), perhaps reflecting the importance of advection to Chukchi Sea communities.
Unlike in the Barents Sea, the expansion of boreal predators into the Bering Sea and their top-down impact on Chukchi Sea benthic communities is likely constrained by the narrow Bering Strait. Although abundances of several fish species increased significantly in 2017 (Table S3), these abundances were still at least an order of magnitude lower than on the Bering Sea shelf (unpublished data of author Mueter). Therefore, the observed changes in the diversity of epifauna and in the species composition of benthic infauna and epifauna between 2015 and 2017 are more likely due to bottom-up effects associated with borealization, such as changes in biological rates due to warmer bottom waters, changes in the advective supply of food (Feng et al., 2016), and changes in pelagic-benthic coupling due to earlier ice retreat and warmer surface waters (Grebmeier et al., 2018). These changes, in turn, impact carbon cycling and the quality and quantity of food available to benthivores.
Although clearly influenced by dynamically changing conditions such as temperature, benthic assemblages were primarily associated with sediment characteristics in this study (Figure 6, Table S3), consistent with previous work (e.g., Bluhm et al., 2009; Ravelo et al., 2014). In contrast, pelagic communities and seabirds responded more strongly to changes in oceanographic conditions (primarily bottom water characteristics) and showed larger, unexplained differences in taxonomic composition between years. High zooplankton diversity in 2017 (Figure 3) and considerable differences between the two years in taxonomic composition, particularly of large zooplankton (Figure 6), likely reflect the dominant influence of advection on zooplankton (reviewed in Hunt et al., 2016), as opposed to local processes or active movement. Specifically, stronger advection in 2017 may have increased the transport of relatively rare taxa of Pacific origin into the Chukchi Sea (Table S4), with the highest richness of small zooplankton observed at the warmest stations in 2017 (Figure 5). Although the species richness of large zooplankton was also higher in the warmer year, it was highest at some of the colder, more northern stations in 2017 (Figure 5), suggesting that zooplankton diversity can be enhanced where Pacific and Arctic waters mix. These changes are consistent with a continuation of the previously reported borealization of the Chukchi Sea zooplankton community (Ershova et al., 2015).
In contrast to zooplankton, seabirds are highly mobile, hence, their feeding distributions and abundances in the Chukchi Sea can change independently of water masses and can in part be driven by feeding conditions in other areas such as the northern Bering Sea (Kuletz et al., 2020). Nevertheless, we found that species composition was related to the gradient from warm, saline Pacific water to cold, less saline Arctic water (Figures 4 and 6), likely reflecting associations between seabirds and their preferred prey. However, while these associations were evident in 2015 in moderate correlations between the seabird assemblage and several potential prey assemblages (zooplankton and fish), seabird communities were largely decoupled from other assemblages in 2017 (Table 2), suggesting an inability to quickly adapt to large changes in prey conditions. This may have resulted in slightly lower taxonomic diversity (Figure 5), but much reduced abundances of both planktivorous and piscivorous seabirds in 2017 (Table S4), contrary to previously observed increases in planktivores in a warming Chukchi Sea (Gall et al., 2017). It is unclear whether this decoupling persisted after 2017, but the decline in diversity was likely short-lived as a more extensive data set suggests similar or higher diversities in the northern Chukchi Sea in 2017–2019 compared to the preceding decade (Kuletz et al., 2020).
Knowledge of the diversity and species composition of microbial communities in the Chukchi Sea has recently been advanced following methodological improvements in metagenomics. Due to their short life cycles, microbes likely reflect local conditions, as evident in the patchy distribution of diversity (Figure 4). In addition to moderate correlations with surface water characteristics, surface assemblages of bacteria and protists were associated with near-
bottom nutrient concentrations, consistent with Lee et al. (2019). This likely reflects the direct dependence of many autotrophs on nutrient supplies. Although associations with other assemblages were variable between the two years, surface bacteria and protists were primarily associated with benthic assemblages (infauna, epifauna, and demersal fish), possibly reflecting the strong dependence of benthic organisms on vertical fluxes (Cooper et al., 2015). Although the diversity of both bacteria and protists was strongly and positively associated with the surface temperature gradient in 2017 (Figure 5), diversity was on average much higher and much more variable in 2015 when conditions were cooler. One contributing factor to higher microbial diversity in 2015 could be the later sea ice retreat at the northern stations, as indicated by higher meltwater fractions present in surface waters, which may be associated with the presence of sea-ice associated algae and bacteria. Pronounced differences in the species composition of protists between years were not aligned with any of the environmental gradients examined (Figure 6), suggesting random variability between years, an unknown environmental or ecological driver, or a methodological artifact. The large observed differences in the protist assemblage between 2015 and 2017, while remaining unexplained, suggest that these communities are highly susceptible to changing conditions in the Arctic.
Effects of Future Warming and Advective Changes on Chukchi Sea Communities
As regional warming continues, increases in water column temperatures will likely not be uniform across space, among seasons, or throughout the water column. Differences may arise in the contributions of solar heating and ice melt to stratification, the turnover of the fall water column as the shelf cools to the freezing point, the lateral advection of heat, and the timing of these processes. As a consequence, thermal controls on biological rates may differentially impact pelagic and benthic communities. In the benthic realm, the amount of time that the benthic community is exposed to cold (<–1°C) winter water in the ice-free period is likely to decrease, thereby raising metabolic rates and oxygen demands. In the pelagic realm, additional warming in late spring and summer and into the fall can be expected. Although warmer temperatures increase the growth potential for zooplankton and fish, this requires a coincident and adequate supply of phytoplankton or other prey to support both increased growth and increased metabolic costs. Warmer surface temperatures may also increase stratification and inhibit mixing of nutrient-rich waters from depth, although this may be counteracted by a longer production season and increased mixing in the fall, which can lead to late-season blooms over the shelf.
In addition to the direct effects of temperature on biological rates, changes in temperature and sea ice conditions will modify the availability of nutrition and prey to both pelagic and benthic consumers. The supply of lipid-rich sea ice algae to the benthic realm will likely be reduced, whereas enhanced phytoplankton growth will benefit pelagic consumers (e.g., Moore et al., 2018). Warmer temperatures also tend to favor smaller over larger phytoplankton and zooplankton, thereby reducing the transfer efficiency from primary producers to both pelagic and benthic consumers. This was supported in our data by the larger proportion of small zooplankton (12 of 31 taxa, 39%) compared to large zooplankton (13 of 54 taxa, 24%) that showed significant increases in 2017 (Table S4). Moreover, the proportion of large zooplankton that increased significantly was even lower when gelatinous zooplankton were excluded (5 of 32 taxa, 16%).
Although transport through the Bering Strait has increased, the incoming water is fresher (Woodgate, 2018) and likely to have lower nutrient loads (Codispoti et al., 2013). Hence, it is unclear whether the nutrient fluxes and pre-bloom nutrient standing stocks in the Chukchi Sea have any temporal trend. Nitrate concentrations on the Chukchi Shelf at the end of winter show large interannual and spatial variability (Mordy et al., 2020), suggesting that the year-to-year variations likely overwhelm any long-term trend in nutrient supply. However, a delayed freeze-up, in combination with fall storms, can provide regenerated nutrients to surface waters and enhance production and food availability in the fall (Nishino et al., 2015), a critical period for many marine organisms to store sufficient lipids for overwintering. A second, and perhaps more important consequence of increased transport is that the fronts separating the Bering Sea and Arctic water masses will move through the region earlier and advance farther, as was the case in 2017. This is reflected in the high seasonal and interannual variability of zooplankton assemblages and their habitat affinity in the northeast Chukchi Sea (Questel et al., 2013; Spear et al., 2020).
Clearly, direct and indirect effects of warming and changes in advection will differentially affect different species and communities, altering trophic linkages and the diversity and species composition of interconnected biological assemblages in the Chukchi Sea (Figure 7). However, these incremental bottom-up effects on Chukchi Sea communities could ultimately be surpassed by the top-down effects of large demersal predators such as Pacific cod (Gadus macrocephalus) and walleye pollock (G. chalcogrammus) that have recently expanded on the northern Bering Sea shelf to at least the Bering Strait (Stevenson and Lauth, 2019) and also into the western Chukchi Sea (Orlov et al., 2020). Although the combined effects of bottom-up and top-down processes associated with further borealization are difficult to predict, coastal communities and resource managers should be prepared for the possibility of transformative changes in the Chukchi Sea ecosystem.
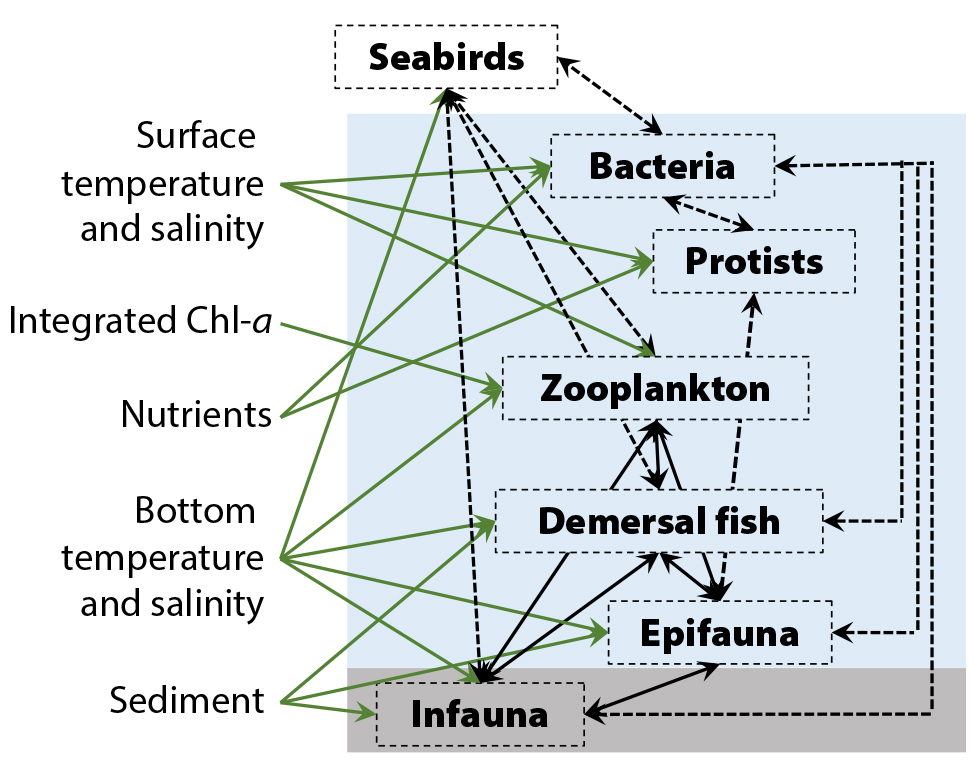
Figure 7. Schematic of bottom-up drivers of Chukchi Sea assemblages (green arrows), based on significant relationships (p < 0.05) between environmental variables and species composition, and significant multivariate correlations among assemblages that were consistent between 2015 and 2017 (black solid lines) or were significant in only one year (dashed lines). > High res figure
|
Acknowledgments
This work was funded through a National Ocean Partnership Program Grant (NA14NOS0120158) from the National Oceanographic and Atmospheric Administration (NOAA), the Bureau of Ocean Energy Management, and Shell Exploration & Production, under management of the Integrated Ocean Observing System (IOOS). We specifically appreciate the support of Gabrielle Canonico (NOAA-IOOS) and Cathy Coon (Bureau of Ocean Energy Management Alaska). We thank the captain and crew of R/V Norseman II, Norseman Maritime, for excellent field support. We also appreciate the help of students and technicians with field and lab work. We thank George Hunt and two anonymous reviewers for their valuable comments on an earlier draft of the manuscript.