Full Text
Both in situ and remote sensing observations of Arctic Ocean hydrography and circulation have improved dramatically in recent decades, and combining the two can yield the most complete picture of Arctic Ocean change. Recent results derived from classical hydrography and satellite ocean altimetry illustrate this synergy and also reveal a fundamental in situ sampling challenge.
Prior to 1990, the Soviet Union made extensive in situ observations of the Arctic Ocean using drifting stations and annual airborne hydrographic surveys. Since then, improved instrumentation, especially the development of more autonomous sampling (e.g., using drifting buoys), have greatly expanded temporal coverage, particularly in less remote regions such as the Beaufort Sea. These observations captured an increase in the strength of the Beaufort Gyre anticyclonic circulation and its freshwater content, which are commonly taken as representing Arctic Ocean circulation and freshwater content as a whole (e.g., Hofmann et al., 2015; Proshutinsky et al., 2015).
The pan-Arctic perspective on circulation and freshwater content provided by satellite altimeters, for example, ICESat and CryoSat-2 (Kwok and Morison, 2011, 2016) and the GRACE and GRACE-FO gravity satellites (Morison et al., 2012), points to challenges associated with geographically limited in situ observing. For example, ICESat-derived dynamic ocean topography (DOT) reveals basin-wide circulation before (Figure 1a) and after (Figure 1b) a significant increase in the wintertime Arctic Oscillation index in 2007 (Morison et al., 2012, 2021). Studies that relied solely on extensive in situ data confined mainly to the Beaufort Sea and the Transpolar Drift attributed the 2005/2006 (Figure 1a) to 2008/2009 (Figure 1b) changes in Arctic Ocean circulation to a spin-up of the anticyclonic Beaufort Gyre (e.g., McPhee et al., 2009). In contrast, the broader perspective provided by ICESat altimetry reveals an eastward extension of the trough of depressed DOT that resulted in enhanced cyclonic circulation along the Russian side of the Arctic Ocean, changing the pathways of Eurasian runoff to increase freshwater content in the Beaufort Sea (Morison et al., 2012). Comparison of 2011–2012 CryoSat-2 with 2008–2009 ICESat DOT illustrates the opposite shift after the record Arctic Oscillation minimum in 2010 (Morison et al., 2021).
|
|
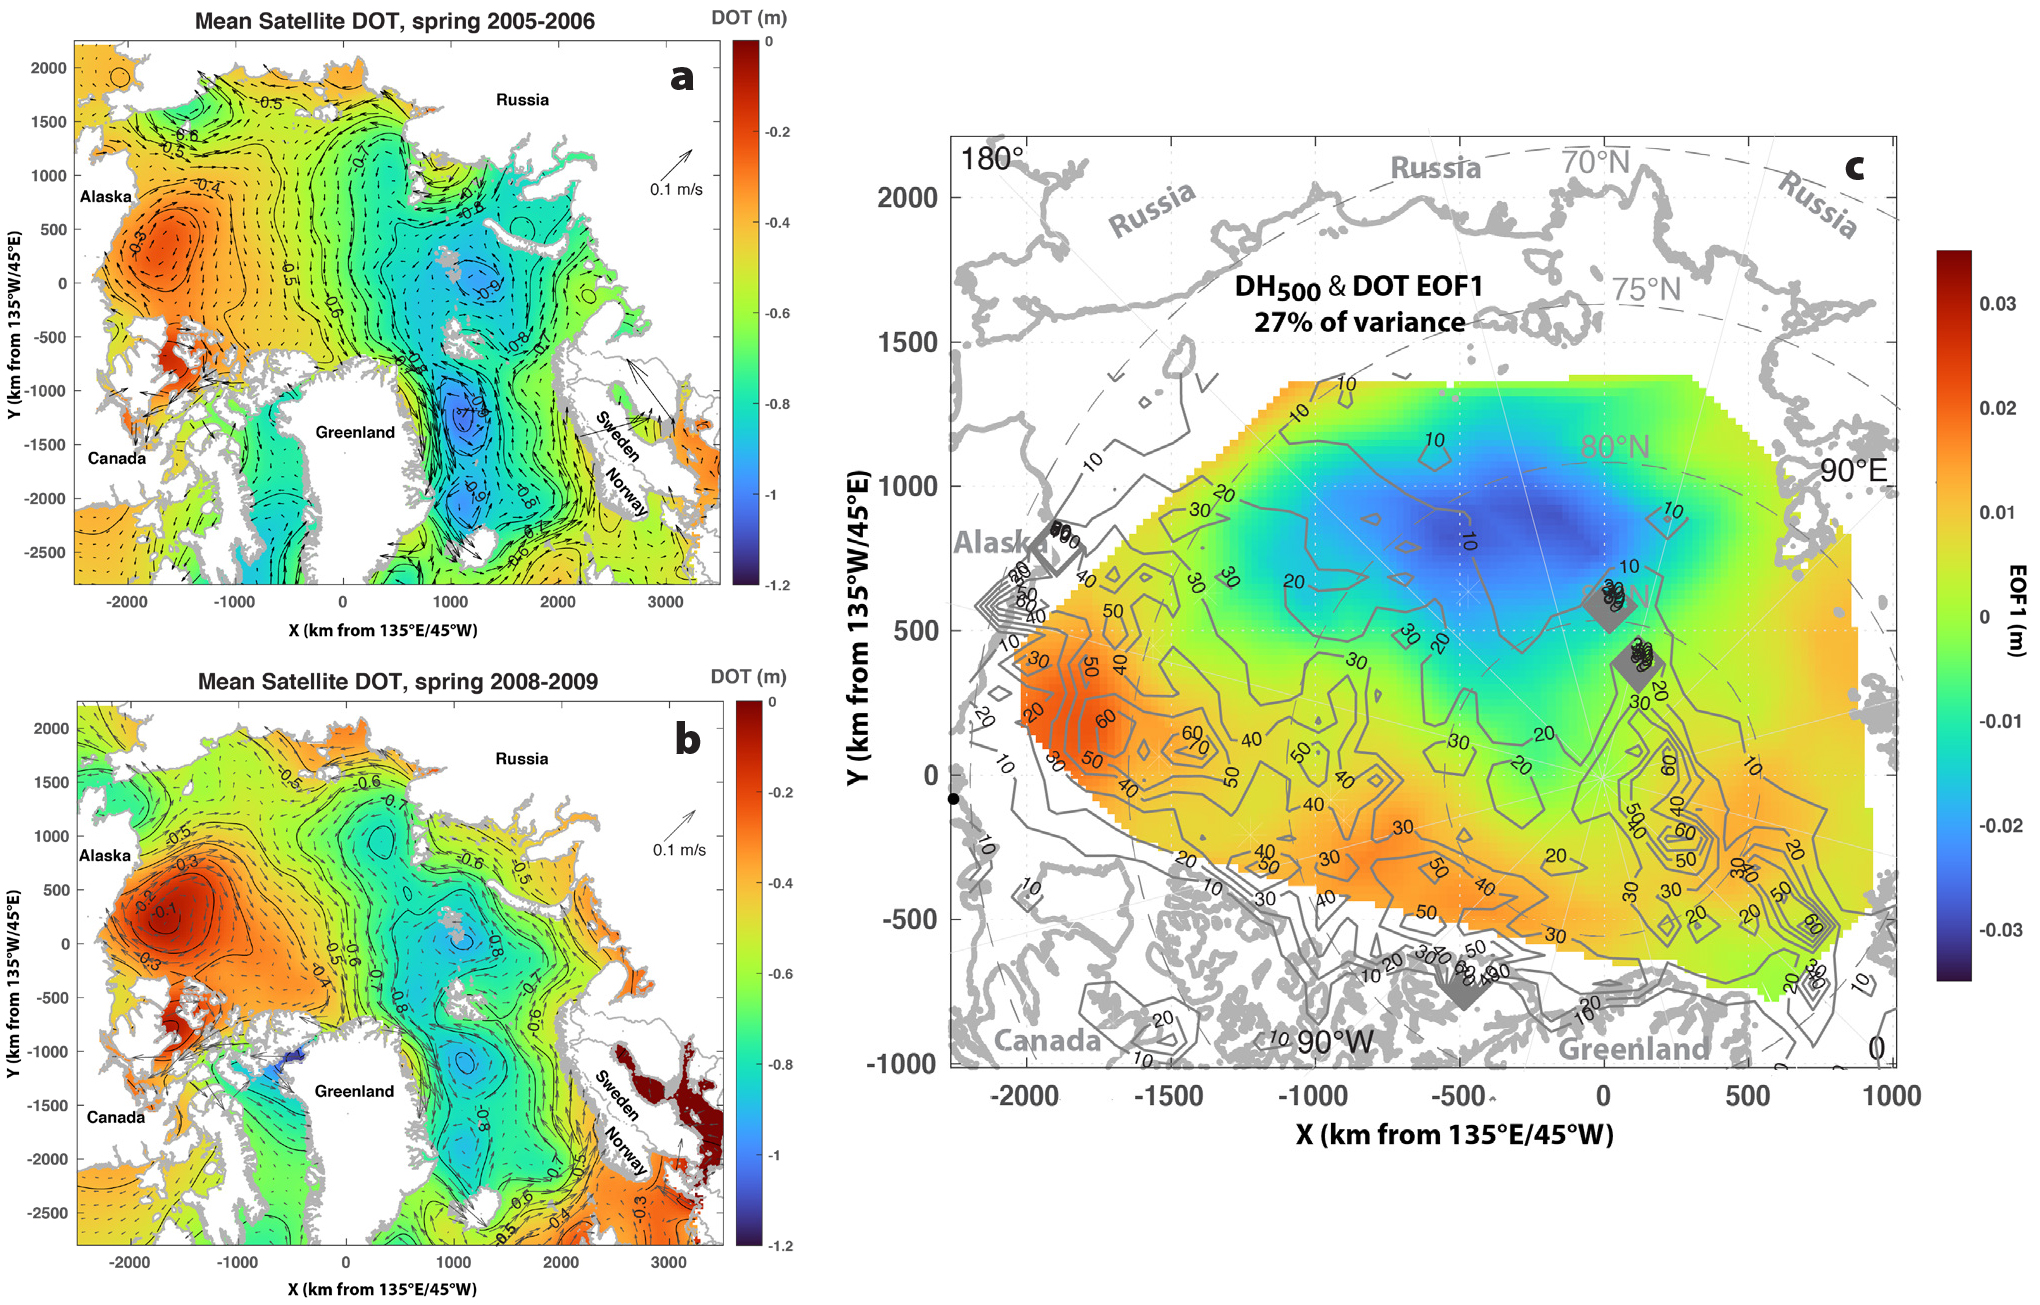
Presently, analyses based solely on in situ measurements are blind to a fundamental mode of circulation variability because there are so few observations on the Russian side of the Arctic Ocean. Morison et al. (2021) characterize circulation changes over the last 70 years using an empirical orthogonal function (EOF) analysis of annual maps of Arctic Ocean dynamic heights (DH) derived from historical (1950–1989) in situ data (Environmental Working Group, 1997) and satellite altimetry measurements of dynamic ocean topography (2004–2019). Analysis of the anomaly of DH and DOT about the mean winter DH and DOT pattern yields a leading EOF that in its positive (cyclonic) phase is characterized by depressed DOT and cyclonic circulation along the Russian side of the Arctic Ocean centered roughly in the Makarov Basin (Figure 1c). Based on buoys tracked by the International Arctic Buoy Program from 2001 to 2021, the chances of finding any buoy, much less an oceanographic buoy capable of measuring dynamic height or freshwater content, in any 250 km square region (Figure 1c) are lowest in the center of the dominant feature of EOF1 in the Makarov Basin. The chance of finding a buoy there is less than 10%, while the chance of finding a buoy in the Beaufort Sea is 30%–60%. To make matters worse, though EOF1 is overwhelmingly a depression-causing cyclonic circulation change, it also includes a localized positive-bulge-causing anticyclonic circulation change in the Beaufort Sea. Thus, the sense of circulation change (e.g., more anticyclonic) in the oversampled Beaufort Sea is the opposite of the actual sense (e.g., more cyclonic) of the overall change.
These results heighten the importance of sea surface heights obtained from ICESat-2 and the Surface Water and Ocean Topography satellite (SWOT; planned for launch in November 2022). The ICESat-2 mission, launched in 2018 (Markus et al., 2017), yields multibeam laser profiles with 10 m resolution that resolve leads in sea ice and thus provide DOT, ice freeboard, and ice thickness. The SWOT mission will be the first space-borne radar interferometer capable of providing wide-swath height maps—50 km on each side of the nadir ground track—of the open and ice-covered oceans (Armitage and Kwok, 2017). It will observe two-dimensional ocean structures that are previously not resolved by traditional profiling altimeters.
The combination of remote sensing and in situ observations provides the most comprehensive picture of Arctic Ocean circulation. Dynamic ocean topography from satellite altimetry combined with in situ temperature and salinity profiles yields vertical profiles of geostrophic velocity, as well as estimates of heat and salt transports. Drifting buoys equipped with high precision GPS receivers will be especially useful for validation of current (e.g., ICESat-2) and future (SWOT) satellite missions.