The Rising Awareness of Extreme Events
Extreme weather events are generally defined as rare and severe environmental events (e.g., Herring et al., 2015). Often, extreme events can be formally defined based on the frequency distribution of observations recorded at a location, and as lying in the upper or lower tail of the probability distribution (with various thresholds for “extremeness” commonly based on different high or low percentiles; Perkins and Alexander, 2013). Examples include meteorological, hydrological, and oceanographic events such as storms, cyclones, floods, droughts, and terrestrial and marine heatwaves (Herring et al., 2015). Extreme events can significantly impact both natural systems and human societies; their historic and social consequences have ranged from societal collapse due to earthquakes, famine resulting from droughts, and loss of life from tsunamis (Zhang et al., 2007; Herring et al., 2015). Recent insurance records indicate that the frequency of economic loss events has more than doubled globally since the early 1980s, from about 350 to around 1,000 events per year, mostly due to the increase of weather- and climate-related events (Munich Re, 2016). Over this period, inflation-corrected losses have increased from ~US$50B to ~US$200B, and payout for insured losses has grown from less than US$5B to over US$30B per year (Munich Re, 2016).
Oceanic extreme events have received less attention than terrestrial events, yet still lead to major biological and economic impacts. These extremes include periods of intense upwelling (Feely et al., 2008; Yang et al., 2012; Evans et al., 2015; Benthuysen et al., 2016), deoxygenation events (Diaz and Rosenberg, 2008; Stramma et al., 2010), and ocean temperatures that are unusually warm (Wernberg et al., 2013; Di Lorenzo and Mantua, 2016) and cold (Crisp, 1964; Firth et al., 2011). Extreme temperatures, in particular, exert a strong influence on biological systems. A variety of impacts have been associated with these anomalous events, including shifts in species ranges and local extinctions (Southward and Crisp, 1954; Garrabou et al., 2009; Wernberg et al., 2016), and economic impacts on aquaculture (Oliver et al., 2017) and seafood industries through declines in important fishery species (Mills et al., 2013; Caputi et al., 2016; Hobday et al., 2016). While sustained periods of above average temperatures are sometimes associated with different phases of large-scale climate modes, such as the El Niño Southern Oscillation (ENSO; Salinger et al. 2016), extreme events with significant environmental impacts often occur over shorter time periods as well (Hobday et al., 2016).
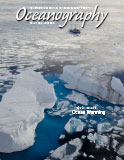
Extreme warm ocean temperature events observed around the world have been termed marine heatwaves1 (MHWs). Following atmospheric conventions, an MHW is defined as a “prolonged discrete anomalously warm water event that can be described by its duration, intensity, rate of evolution, and spatial extent” (Hobday et al., 2016). While MHW events have occurred in the more distant past, there is increased scientific (Figure 1) and public interest in a range of recent MHWs. Furthermore, analysis of historical data (Zhang et al., 2007; Oliver et al., 2018) show trends in MHW intensity and frequency as a result of anthropogenic climate change. Research around the world is showing that MHWs, while not as dramatic as earthquakes and cyclones, have a range of important biological impacts such as habitat loss (Wernberg et al., 2016), coral bleaching (Hughes et al., 2017), and mass seabird mortality (Jones et al., 2018). Because these biological impacts can in turn disrupt dependent human systems (Mills et al., 2013; Frölicher and Laufkötter, 2018), there is considerable public and management interest in understanding and predicting MHWs.
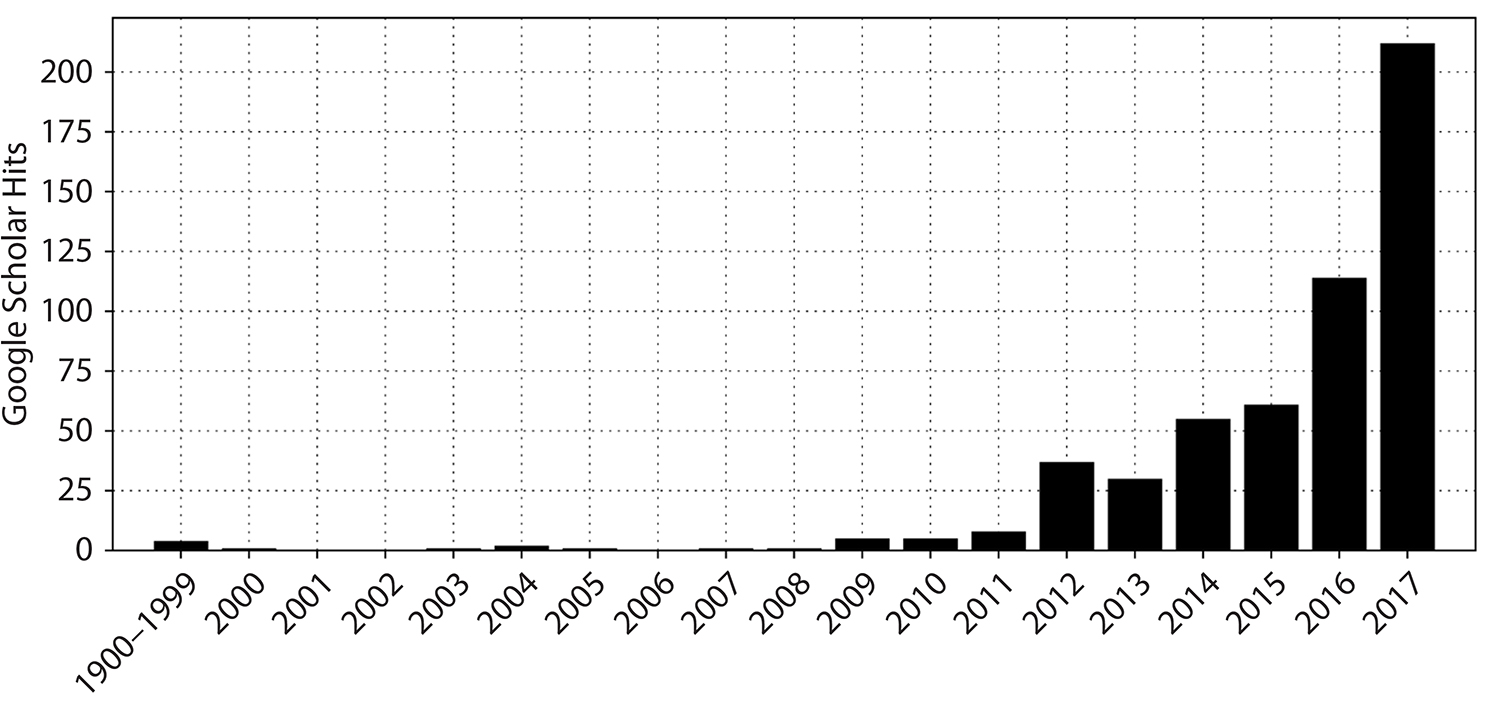
Figure 1. Frequency of publications returned from a Google Scholar search based on the search terms “marine heatwave” and “marine heat wave.” Note the first bin (1999) contains all records for the period 1900–1999. > High res figure
|
There is a long tradition of categorizing extreme events according to some intensity measure, and/or to name them following certain conventions. Categorization enables comparison of events across different regions, and facilitates comparison of the different events in a globally consistent framework. Naming provides a unique and unambiguous identifier for each event in a certain period, which greatly facilitates communication among experts as well as to the general public (Nairn and Fawcett, 2013). While categorization or naming is commonly applied to a range of extreme environmental events such as tropical cyclones, earthquakes, or atmospheric heatwaves, it is not currently used consistently for MHWs. One notable exception is “the Blob,” a Northwest Pacific MHW that appeared between 2014 and 2016 (Bond et al., 2015; Di Lorenzo and Mantua, 2016). Overall, increasing global occurrence of and interest in MHWs strengthens the potential benefits of developing categorization and naming schemes.
Our aim here is to present a detailed categorization scheme for MHWs that (1) enhances the existing binary classification (Hobday et al., 2016), (2) provides a consistent way to compare such events, and (3) enhances scientific and public awareness of these important events. More specifically, we describe Category I, II, III, and IV MHWs based on the degree to which temperatures exceed the local climatology. Finally, we demonstrate how the use of this new scheme can help explain variation in biological impacts associated with different MHWs.
1 While there is some use of the term “heat wave” rather than “heatwave,” we follow the convention used for earthquake (not earth quake) and bushfire (not bush fire).
Naming and Measuring Extreme Events
A range of extreme events and natural disasters have been identified by formal and informal naming systems, and measured on some kind of scale (Table 1). Providing names and measurements of intensity has a number of benefits, including clarity when discussing historical events, which aids identification and communication with the general public (Nairn and Fawcett, 2013). The familiarity that names provide also builds public awareness regarding these events away from their impact region, and enhances risk awareness regarding future events. Scientists also benefit from naming and categorization2, via improved meta-analyses (events can be clearly recognized in published literature) and in retrospective studies that seek to relate the magnitude of an event to some observed impact. For example, hurricanes and cyclones are given names from predetermined lists to aid communication between forecasters and the general public regarding forecasts and warnings. For other extreme events, naming is more informal and may be based on the time of the event or the region, such as the Black Saturday, Black Friday, Ash Wednesday, and Black Tuesday bushfires in Australia, the “Godzilla” El Niño of 2016, the 2017 Lucifer heatwave in Europe, or the Australian Federation and Millennium droughts. In some cases, the informal naming approach will soon run out of options (e.g., only seven days of the week for “Black” bushfires in Australia) while other names provide little identifying information.
Table 1. Examples of naming and categorization schemes used for extreme events and natural disasters. Single events may have attracted a name in popular media, without formal naming. > High res table
|
In addition to the benefits of naming extreme events, their measurement can also provide advantages for communication and comparison. The best-known examples have been the development of magnitude scales for earthquakes (the Richter scale) and hurricanes (the Saffir-Simpson scale; Table 1). Lesser-known magnitude scales have also been assigned for other types of extreme events, including for droughts in the United States (Palmer drought severity index) and fire risk in Australia (e.g., McArthur Forest Fire Danger Index3).
2 https://en.wikipedia.org/wiki/Wikipedia:WikiProject_Disaster_management/Naming
3 The McArthur Forest Fire Danger Index was developed in the 1960s by CSIRO scientist A.G. McArthur to measure the degree of fire danger in Australian forests. The index combines a record of dryness, based on rainfall and evaporation, with meteorological variables for wind speed, temperature, and humidity.
Categories of Marine Heatwaves
The only current quantitative definition of MHWs is primarily binary: MHWs are defined at locations where an upper locally determined threshold (90th percentile relative to the local long-term climatology) is exceeded for at least a five-day period, with no more than two below-threshold days (Hobday et al., 2016). As more regional studies have been completed regarding MHWs, scientists have recognized that biological impacts can vary dramatically and appear to be context-dependent. For example, MHWs occurred in both eastern Tasmania and the northern and central Great Barrier Reef (GBR) in 2015/16, with the temperature anomaly on the GBR (+2°C) being two-thirds of that off eastern Tasmania (+3°C). Despite this temperature difference, the reported biological impacts were only moderate for the Tasmanian MHW (Oliver et al., 2017) compared to the widespread and dramatic coral bleaching documented for the GBR MHW, which resulted in an overall coral mortality of ~22% (Hughes et al., 2017).
These differences in the apparent biological and socioeconomic impacts of MHWs suggest that the metrics proposed by Hobday et al. (2016) may be extended to further understand the apparent differences. In addition, with long-term anthropogenic warming, the binary threshold used to define MHWs may be permanently exceeded at some time in the future. The Hobday et al. (2016) MHW definition offers potential metrics that may be useful in constructing a categorization scheme. Several important design criteria can ensure that the MHW categorization scheme is useful for communication and extension as well as for post-event studies. These criteria include:
- It should be possible to describe and update the category as an MHW progresses. Based on this criterion, MHW duration, mean intensity, rate of onset, and rate of decline are not suitable measures, as they are not known until the MHW has concluded. Hence, real-time reporting would not be possible.
- The category should reflect local thermal impact. The same MHW may have a stronger impact in some locations than in others, and this is important to recognize when undertaking impact assessment, especially for spatially extensive events. Thus, MHW area is not a suitable measure, as it would apply singularly to all locations identified within the boundary of the MHW in question.
- It should be possible to change the category in time as events strengthen and weaken, just as for cyclone categorization. Thus, measures related to MHW intensity, such as I, Icum, and Imax are all suitable candidates (see below for details).
- The metric should not be overly complicated in order to facilitate simplicity of communication and wide adoption.
We propose an MHW categorization scheme based on intensity (I), which is the sea surface temperature anomaly (SSTA) based on the long-term climatology for a location (Hobday et al., 2016). After an event has concluded, the maximum intensity (Imax) can be used to categorize the overall event, as for tropical cyclones. Measures of cumulative intensity (Icum) were considered based on use of a moving sum, in a similar fashion to measures of degree-heating weeks used by coral reef bleaching programs (e.g., Maynard et al., 2009). However, use of the moving sum is more complicated, and there is no single definition that is used by all coral reef biologists (e.g., Selig et al., 2010). More comprehensive approaches, based on combinations of other MHW metrics, may be required to further describe events, as in Hobday et al. (2016).
The thresholds that define MHW categories could be based on percentiles of the historical distribution of SST values in a region (e.g., 90th, 95th, 98th), which is consistent with the 90th percentile definition for an MHW (Hobday et al., 2016). However, unless the baseline period is adjusted, this measure will saturate with additional ocean warming, meaning that all days in a year might be classified as heatwave days, as this definition is bounded by a maximum value at the 100th percentile of the observed distribution.
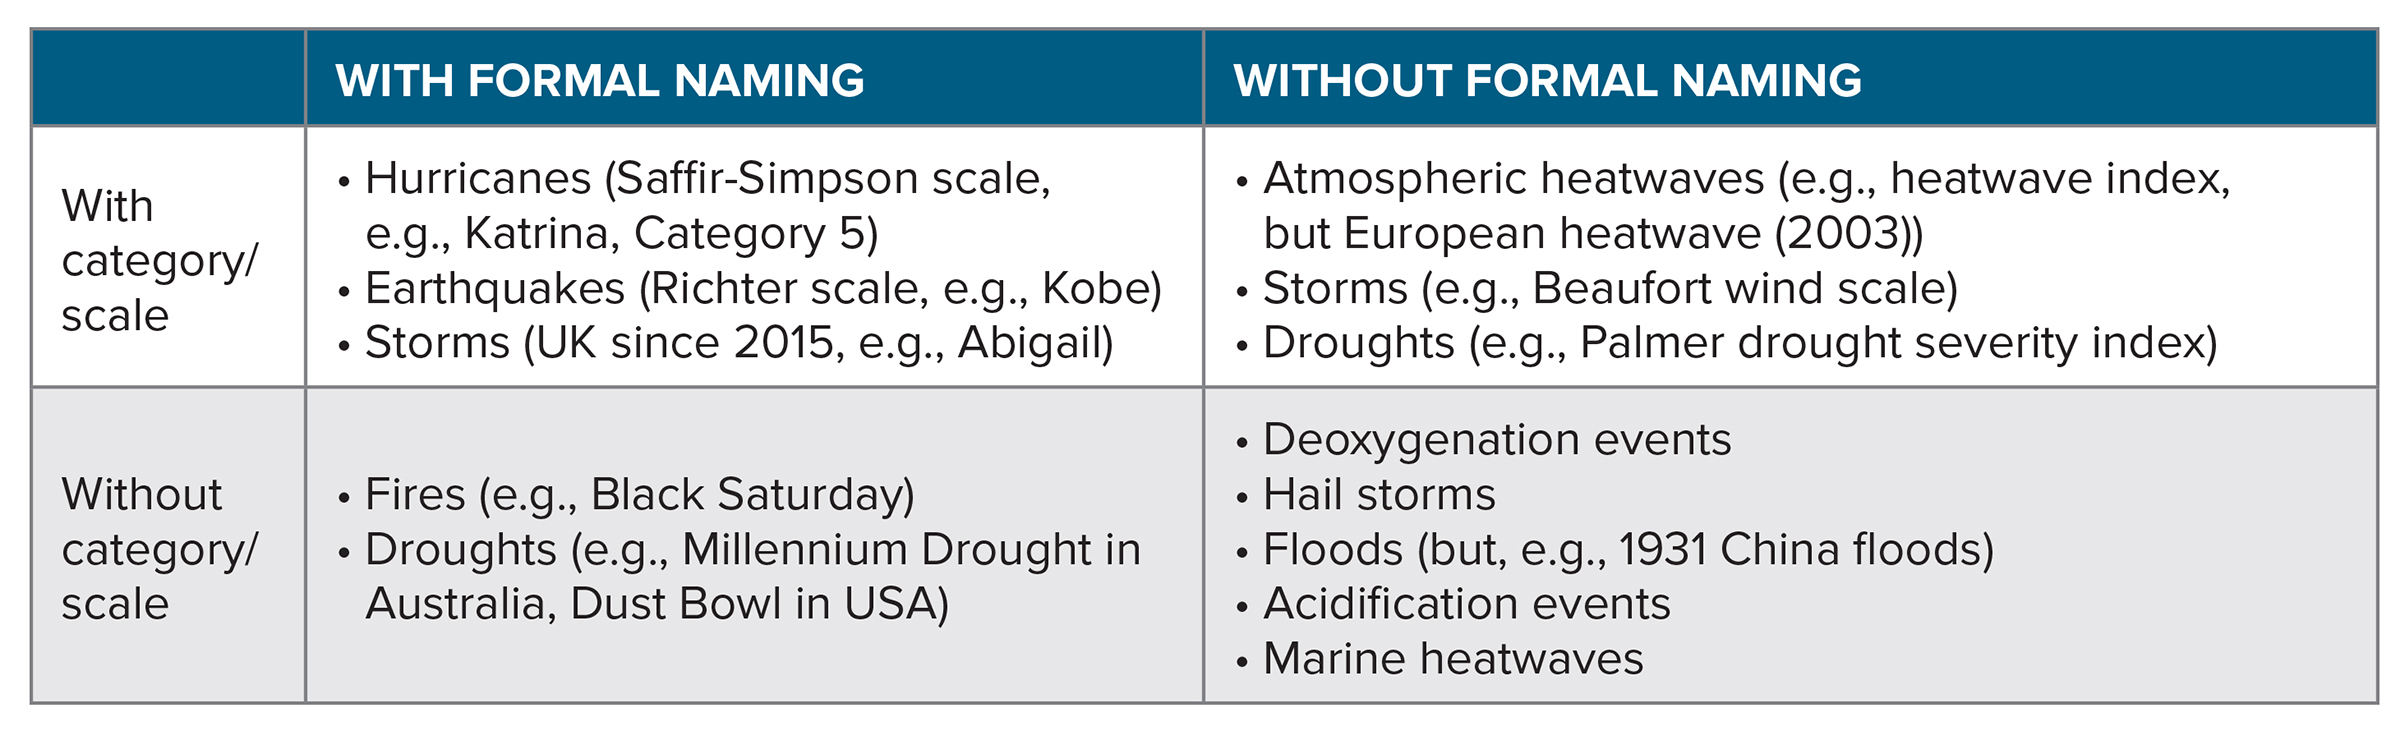
Here, we propose to base categories of MHWs, identified as described above, on multiples of the value represented by the local difference between the climatological mean and the climatological 90th percentile, which is the threshold used to identify MHWs (Figure 2). This anomaly differs by location and time of year (Hobday et al., 2016). Multiples of this local difference will describe different categories of MHWs. Magnitude of scale descriptors, defined as moderate (1–2×, Category I), strong (2–3×, Category II), severe (3–4×, Category III), and extreme (>4×, Category IV), can be allocated at each point in space and time of an MHW event, based on the intensity (I) measure (Figure 2). We also recommend that the baseline period for determining these thresholds should be fixed, as otherwise baseline updates as the world warms will change the categories for past events. Unfortunately, the length of the period for which data are available will vary between observations, satellite data, and model output. Where possible, we suggest a 30-year baseline period of 1983–2012, as used here, based on first availability of global satellite sea surface temperature in the NOAA Optimum Interpolation Sea Surface Temperature (OISST) data set (Reynolds et al., 2007). Minor differences in MHW statistics may arise if different historical baselines are used (e.g., the Tasman Sea MHW was established on the baseline used in Oliver et al., 2017). We also acknowledge that different baseline periods might be appropriate for different study motivations. For example, if in the future defining heatwaves as “unusual” for the time, rather than as the new normal, were desired, a moving 30-year climatology might be appropriate. This would capture unusually warm events through time relative to conditions that are based on a recent historical period (i.e., the previous 30 years) that will shape ecosystem response and human perceptions of the severity of the event. In the following sections, we examine the patterns in these categories, and explore the use of the categorization with a range of case studies (Table 2).
Figure 2. Categorization schematic for marine heatwaves (MHWs) showing the observed temperature time series (dashed line), the long-term regional climatology (bold line), and the 90th percentile climatology (thin line). Multiples of the 90th percentile difference (2× twice, 3× three times, etc.) from the mean climatology value define each of the categories I–IV, with corresponding descriptors from moderate to extreme. This example peaked as a Category IV (extreme) MHW. > High res figure
|
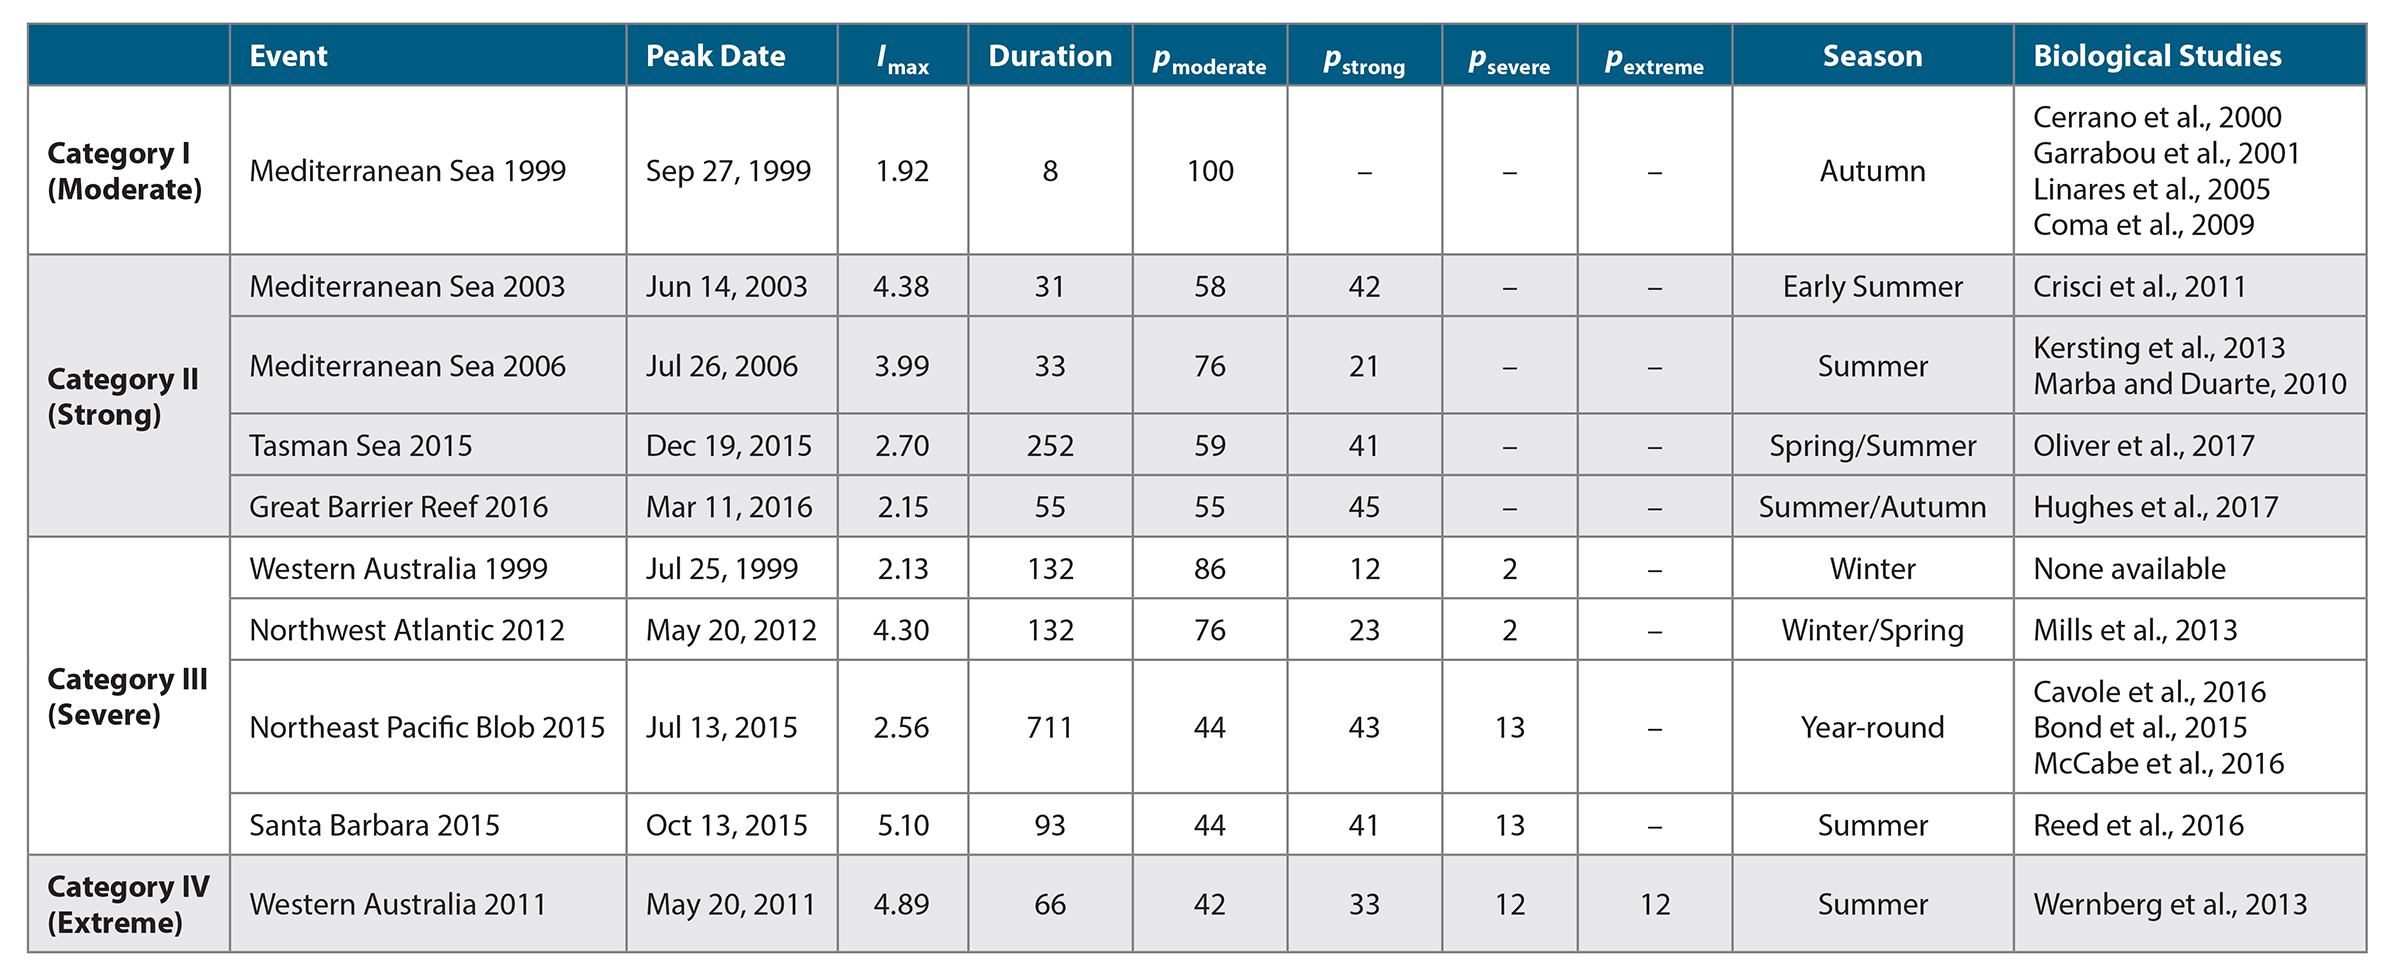
Table 2. Examples of recent marine heatwaves (MHWs) classified into four categories of increasing severity and associated heatwave metrics (for event regions, see Figure 3). The entry for each event lists the date of peak intensity, the category and intensity (Imax, °C) on that date, the total duration of the event (days), the proportion (p, %) of time spent in each of the four MHW categories over the duration of the event, and the season in which the event occurred. Note that the proportions do not always add up to 100% due to the presence of “gap days” linking successive events (see Hobday et al., 2016), days that are not classified into any of the four categories. > High res table
|
Example Marine Heatwaves
Numerous MHWs have been reported in recent decades along with a range of biological impacts (see Table 2 for examples). Our proposed categorization scheme reveals the relative intensity of these events and the duration in each category. Notably, these MHWs have occurred across all seasons. The benefit of using an instantaneous measure of MHW categorization is also illustrated, because like hurricanes, MHWs can intensify and dissipate over their “lifetimes.” Real-time reporting can thus reflect the current classification, and post-event reporting can refer to the maximum classification, as with hurricanes. We present 10 well-known examples in each of the categories from Moderate (Category I) to Extreme (Category IV) based on analysis of the NOAA OISST V2 data set and reported impacts.
Mediterranean Sea 1999 – Category I (Moderate)
A number of studies examined the impacts of the Mediterranean Sea 1999 MHW that, based on our original classification (Hobday et al., 2016), had a maximum intensity of 1.92°C and lasted eight days in autumn (Table 2, Figure 3a). Despite being classified as a “moderate” MHW in our new classification system, most of these studies documented significant impacts on different temperate corals, in particular, octocorals and red corals (Cerrano et al., 2000; Garrabou et al., 2001; Linares et al., 2005; Coma et al., 2009). For example, the proportion of dead colonies varied from 26% to 62% (mean of 46%) of the population across sites around the island of Menorca (Spain) for the octocoral Eunicella singularis following the MHW. There was also evidence to suggest that seagrass growth was reduced and leaf mortality increased during this warm period (Diaz-Almela et al., 2007). These examples highlight that even moderate MHWs can have severe biological effects, particularly for organisms that live near their upper thermal tolerances.
Mediterranean Sea 2003 – Category II (Strong)
A variety of biological impacts were attributed to the Mediterranean Sea 2003 MHW, which was classified as Category II for 42% of the 31-day duration, with maximum intensity of 4.38°C (Table 2, Figure 3b). For example, a massive bloom of mucilage (largely composed of brown filamentous alga) covered many of the shallow-water habitats around Portofino, Italy, in the Ligurian Sea. However, damages to benthic organisms underneath the mucilage were short-lived as the mucilage was moved to deeper waters during a severe storm (Schiaparelli et al., 2007). Similar to the 1999 MHW in this region, temperate benthic invertebrates were significantly affected, with local mass bleaching and mortality (Garrabou et al., 2009; Crisci et al., 2011), and seagrass growth was reduced during the warm anomaly (Diaz-Almela et al., 2007). Finally, only subtle community changes were observed in sedimentary infauna; for example, animal assemblages switched from snail- to worm-dominated in shallow ponds in northeastern Italy (Munari, 2011). These examples show that different types of organisms can respond very differently to the same MHW.
Mediterranean Sea 2006 – Category II (Strong)
The Mediterranean Sea 2006 MHW was classified as strong for 21% of the 33-day duration, with maximum intensity of 3.99°C (Table 2, Figure 3c). This event was linked with marked increases in shoot mortality in populations of the seagrass Posidonia oceania, which were subjected to water temperatures above 26.6°C (Marba and Duarte, 2010). As for previous MHWs in the Mediterranean Sea, negative effects on temperate benthic invertebrates were reported (Kersting et al., 2013; Kružić et al., 2014), although impacts were less severe than for the 1999 and 2003 events (Bensoussan et al., 2010; Crisci et al., 2011).
Tasman Sea, Australia 2015 – Category II (Strong)
In 2015/16, the Tasman Sea off southeast Australia exhibited its longest and most intense MHW ever recorded (Oliver et al., 2017). The event lasted for 252 days, reached maximum intensity of 2.70°C above the long-term climatology (Table 2, Figure 3d), and was dominated by an anomalous convergence of heat linked to the southward-flowing East Australian Current (Oliver et al., 2017). Ecosystem impacts ranged from new disease outbreaks in farmed shellfish, mortality of wild abalone, and observations of various fish species that were outside their normal ranges. Analysis based on global climate models revealed that the occurrence of an MHW of this duration and intensity in this region was, respectively, ≥330 times and ≥6.8 times as likely due to the influence of anthropogenic climate change (Oliver et al., 2017).
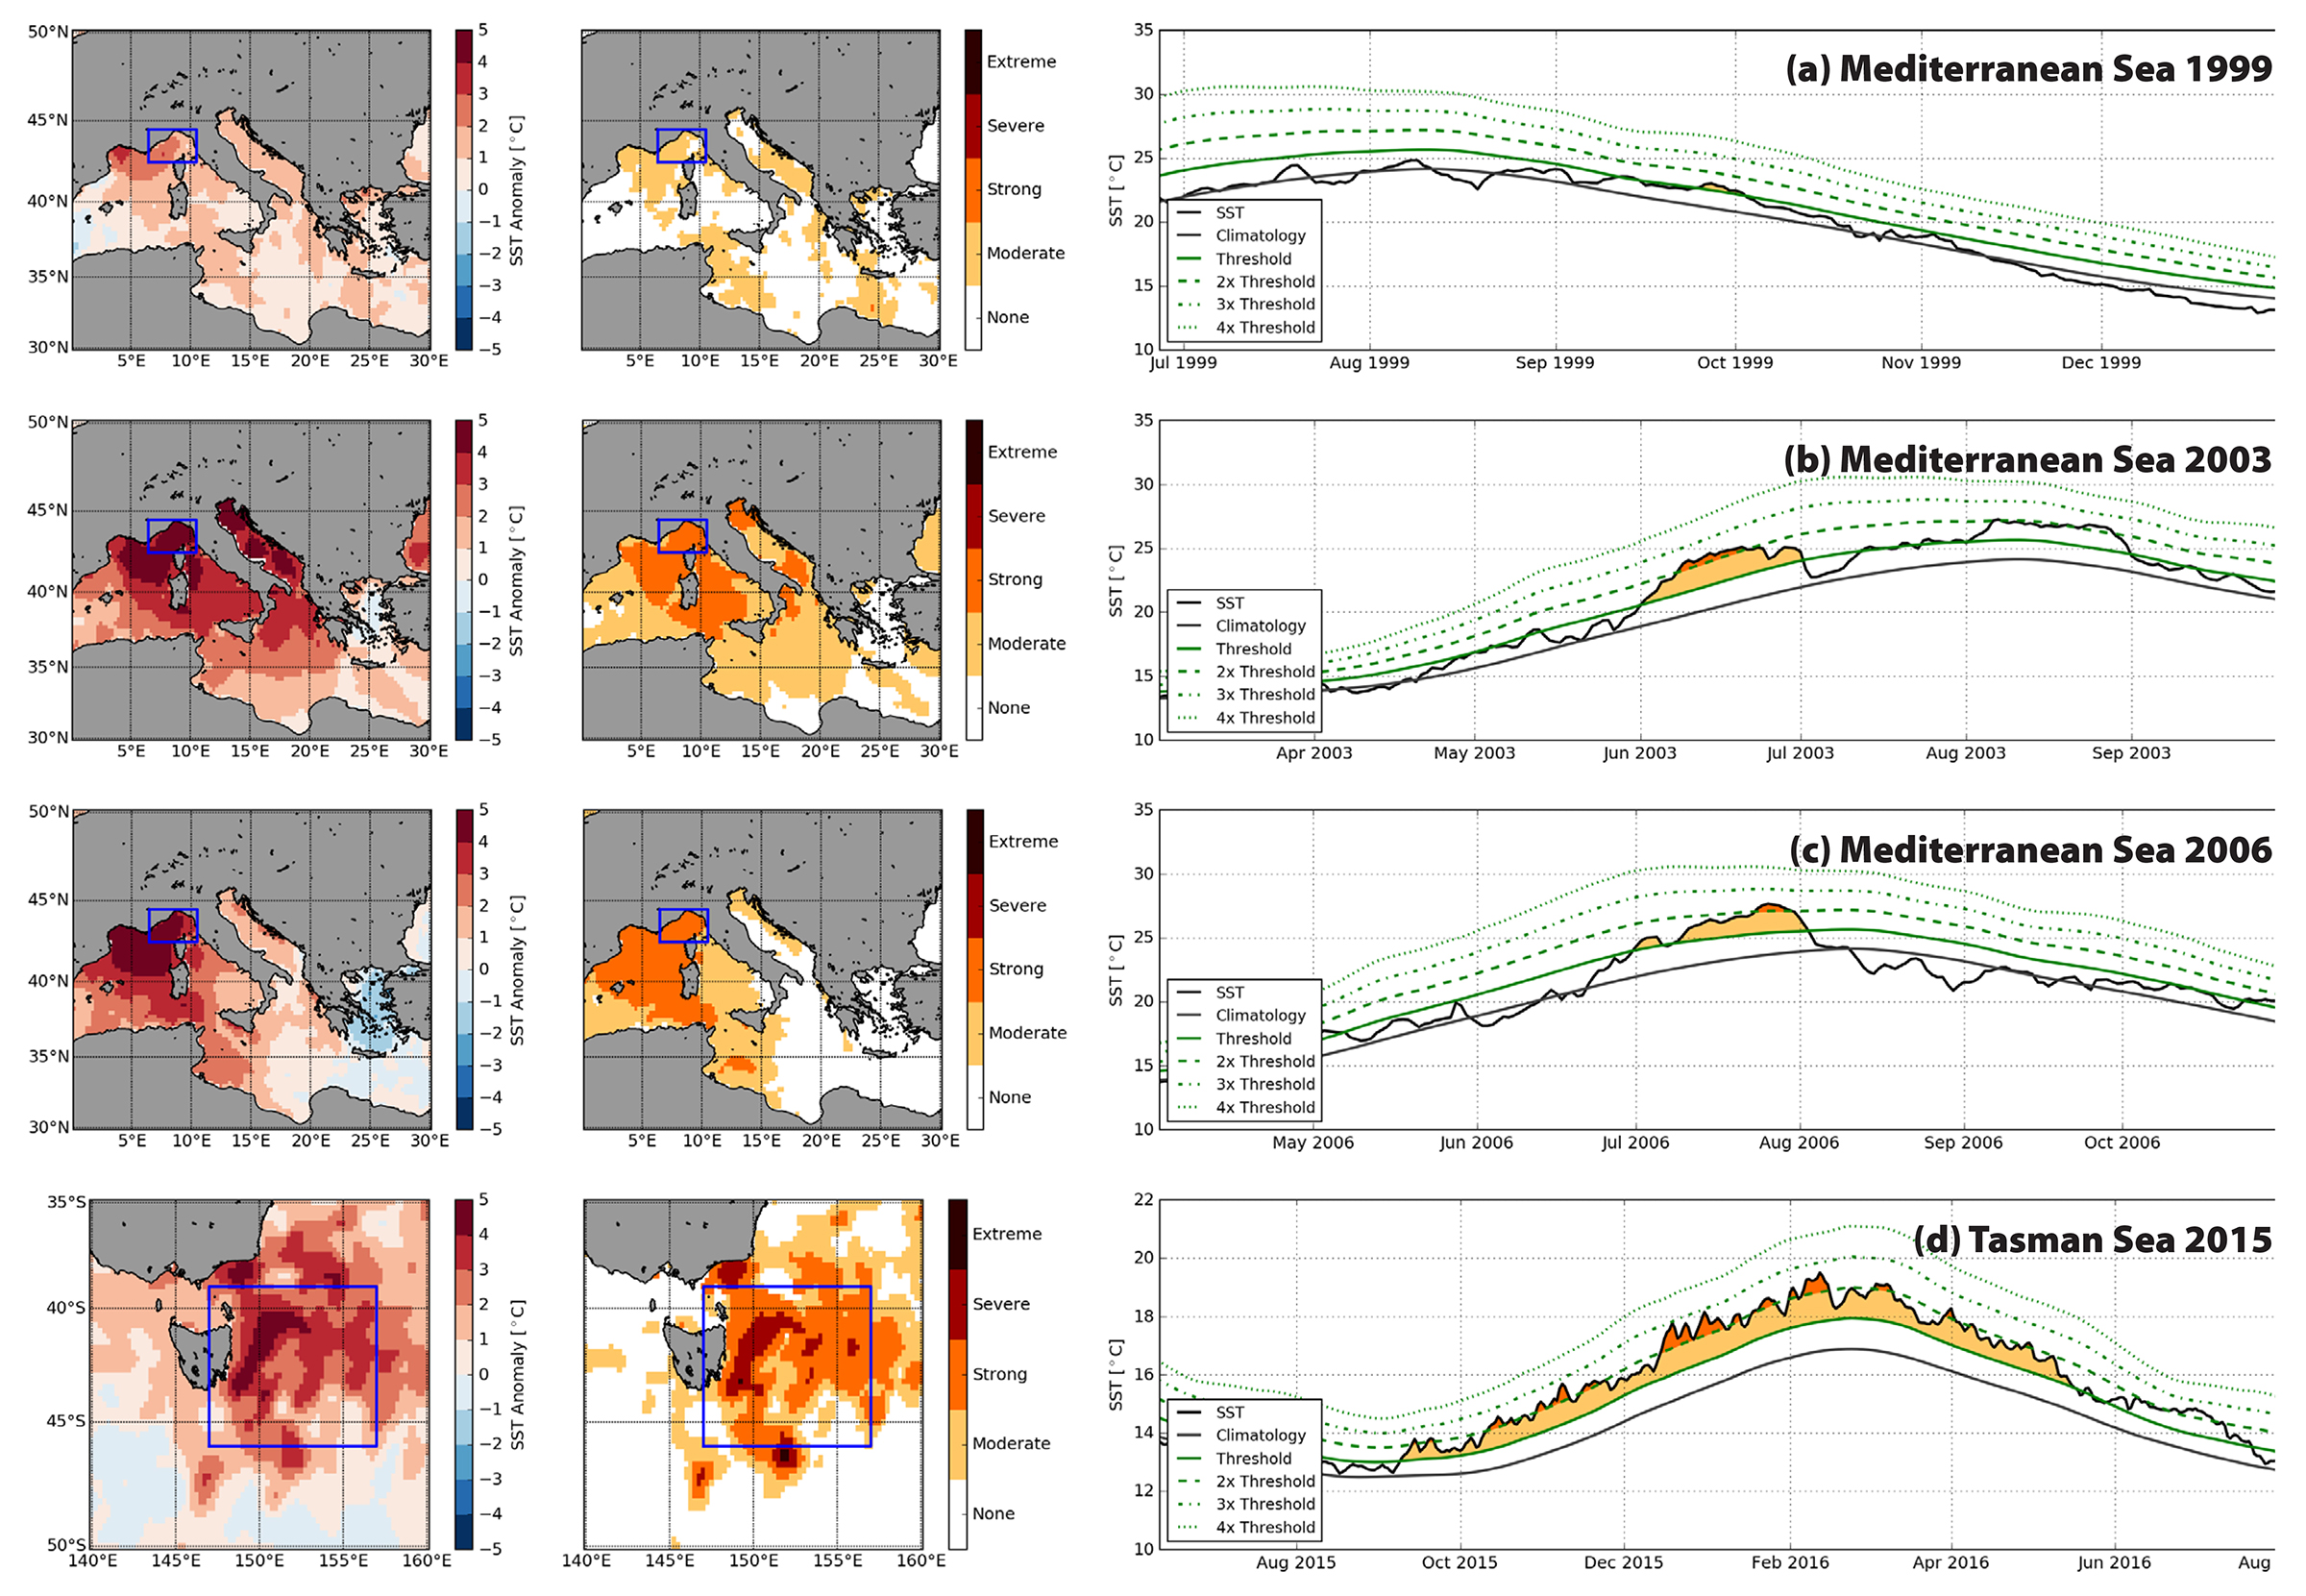
Figure 3a–d. Representative MHW events showing the sea surface temperature anomaly at the peak of the event (left column) based on NOAA OISST V2, the categories of MHW (middle column), and the time series of each event, spatially averaged over the area shown in blue in columns 1 and 2, with the category for each day indicated by colors (right column). (a) Mediterranean Sea 1999. (b) Mediterranean Sea 2003. (c) Mediterranean Sea 2006. (d) Tasman Sea 2015. Figure continued below… > High res figure
|
Great Barrier Reef 2016 – Category II (Strong)
Coral bleaching was widely reported in the northern Great Barrier Reef (Hughes et al., 2017) as a result of the summer 2016 MHW, which according to our definition lasted for 55 days, was Category II for 45% of this period, and reached 2.15°C above the regional climatology (Table 2, Figure 3e). This thermal stress disrupted the symbiotic relationship between corals and their algal symbionts (Symbiodinium spp.), causing the corals to lose their color, which can lead to high levels of coral mortality. Extreme bleaching occurred on more than 40% of reefs. Only 8.9% of 1,156 surveyed reefs escaped with no bleaching (Hughes et al., 2017). Ongoing studies are likely to reveal secondary effects on coral reef fishes and other taxa.
Western Australia 1999 – Category III (Severe)
An MHW lasted for 132 days along the Australian west coast in 1999 (Figure 3f). It was briefly (2% of days) classified as severe (Category 3), and was moderate for 86% of its duration (Table 2). We were unable to locate any studies reporting biological impacts linked to this event, possibly due to absence of impacts or absence of research.
Northwest Atlantic 2012 –Category III (Severe)
The 2012 MHW event in the Northwest Atlantic impacted several fisheries species. This event lasted 132 days and was classified as severe for 2% of days and strong for 23%, with a maximum intensity of 4.30°C (Table 2, Figure 3g). During this winter-spring event, anomalously warm waters led to shifts in the phenology, distribution, and population structure of longfin squid and American lobsters (Mills et al., 2013) and affected catches and juvenile recruitment in the snow crab fishery (Zisserson and Cook, 2017). Changes in the duration and location of the lobster fishing season, and increased catch rates, had significant economic implications, as the market value plummeted and tensions between the US and Canadian fishing industries escalated (Mills et al., 2013).
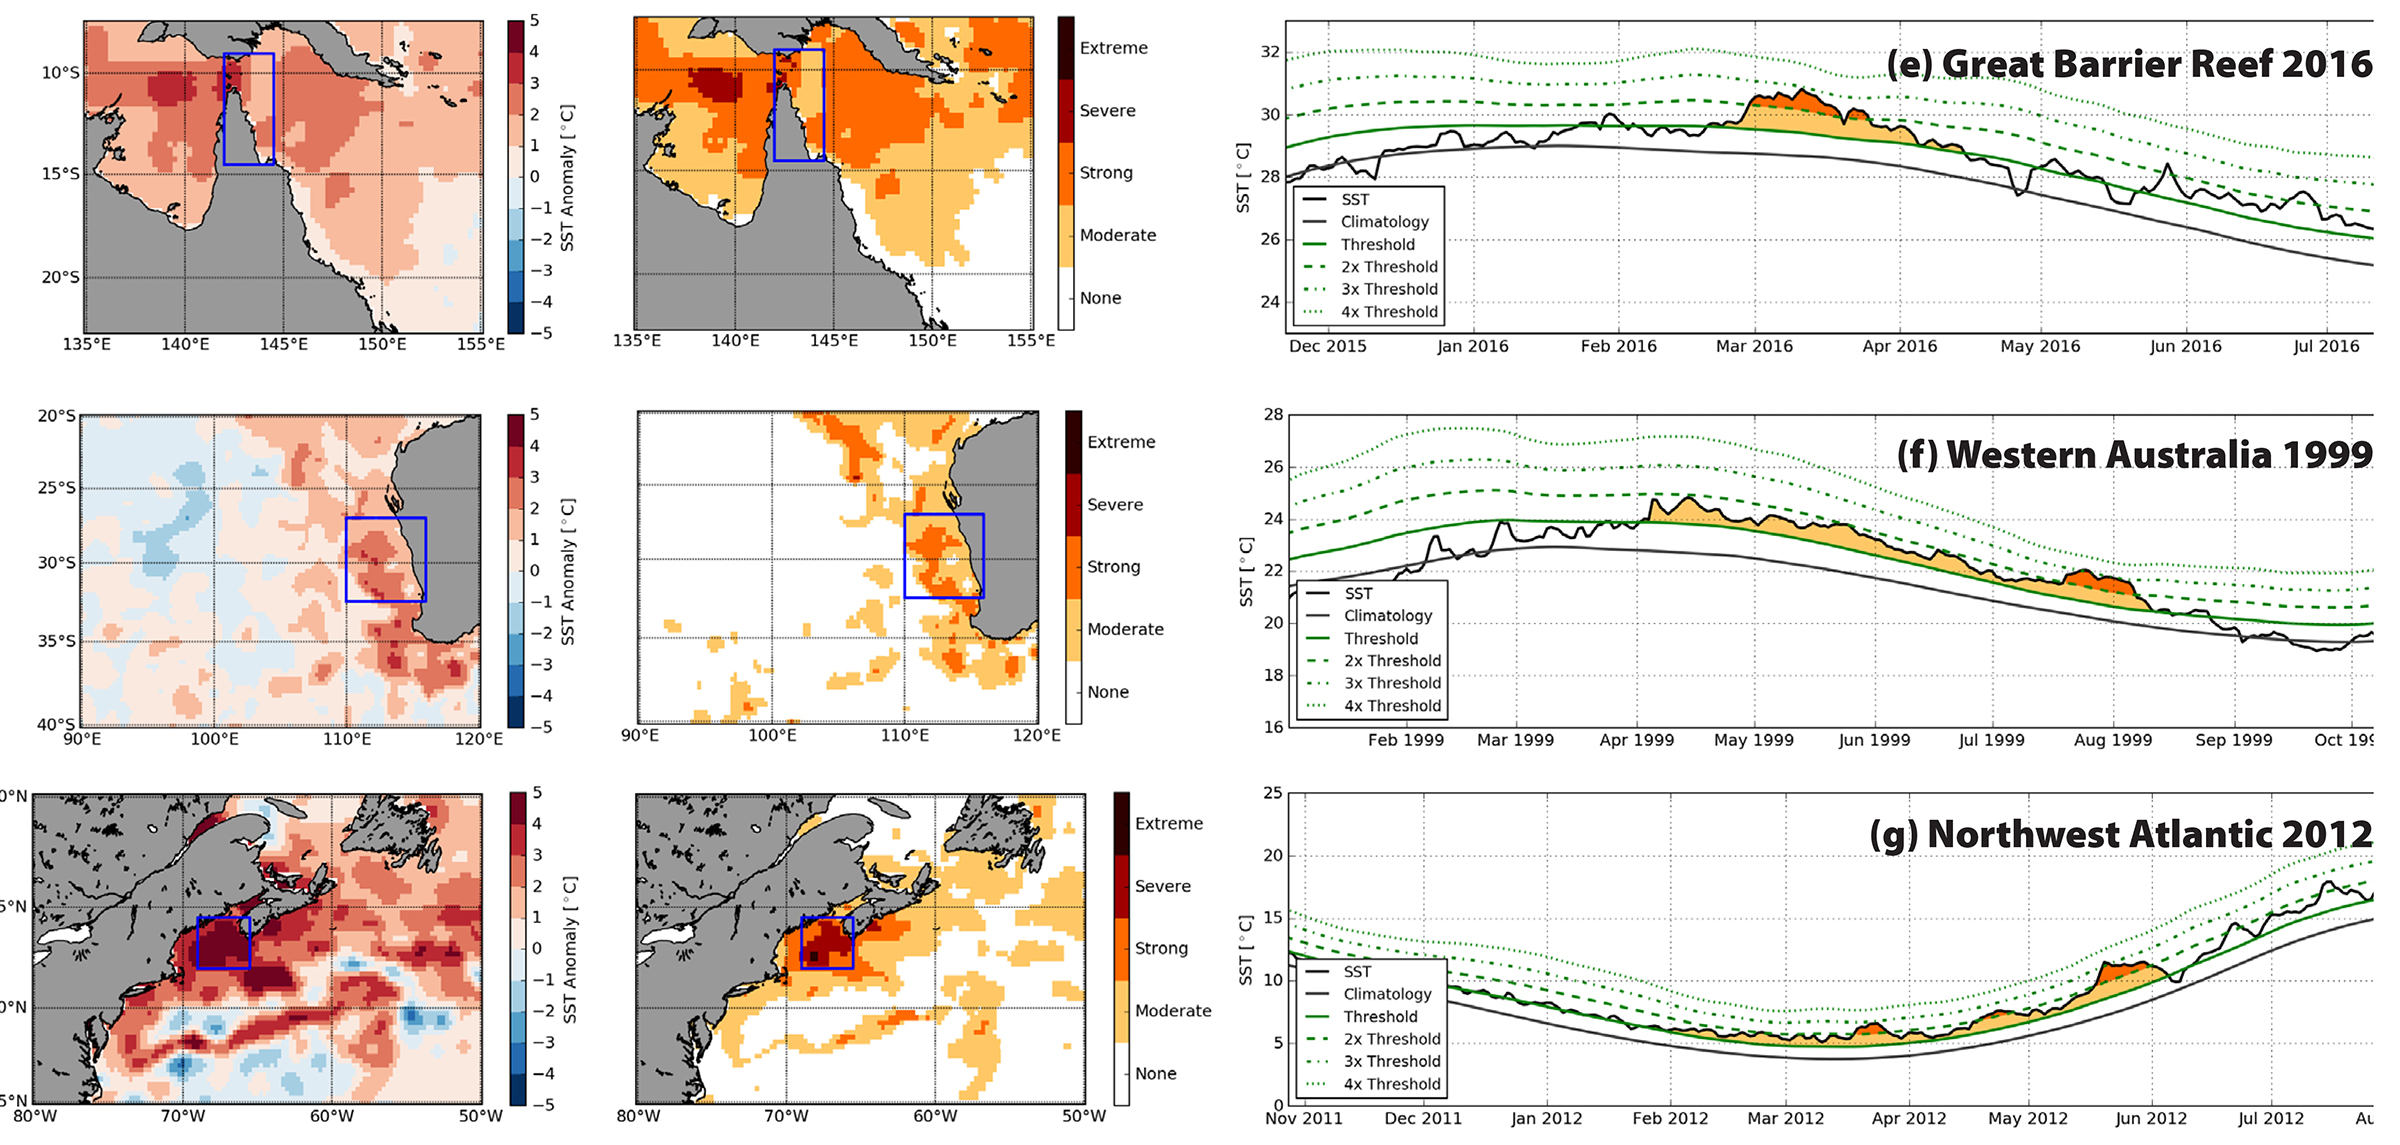
Figure 3e–g. Representative MHW events showing the sea surface temperature anomaly at the peak of the event (left column) based on NOAA OISST V2, the categories of MHW (middle column), and the time series of each event, spatially averaged over the area shown in blue in columns 1 and 2, with the category for each day indicated by colors (right column). (e) Great Barrier Reef 2016. (f) Western Australia 1999. (g) Northwest Atlantic 2012. Figure continued below… > High res figure
|
Northeast Pacific Blob 2015 – Category III (Severe)
This severe Pacific MHW lasted several years (Di Lorenzo and Mantua, 2016). It was classified as severe for 13% of the 711-day duration and reached a maximum intensity of 2.56°C (Table 2, Figure 3h). Although a very recent MHW event, emerging evidence suggests that the biological impacts of the Blob were widespread and far-reaching (Cavole et al., 2016; McCabe et al., 2016). Specifically, changes in oceanographic conditions led to altered patterns of phytoplankton production, changes in population dynamics and behavior of fish species, shifts in the geographical distributions of zooplankton, and mass mortalities of birds and mammals along an extensive stretch of Pacific coastline (Bond et al., 2015; Cavole et al., 2016; Jones et al., 2018).
Santa Barbara 2015 – Category III (Severe)
Off Santa Barbara, California, the summer 2015 event exhibited the largest intensity (5.10°C) of the examples given here, although it was still only classified as severe (13% of days) due to the large variability in this region (Table 2, Figure 3i). In the only published biological impact study associated with this MHW, Reed et al. (2016) found no strong effects on the giant kelp Macrocystis pyrifera or on kelp-associated species. The lack of catastrophic effects, as expected from the severe warming and kelp’s vulnerability to high temperature (Reed et al., 2016), may be due to high levels of background natural variability in the region associated primarily with ENSO events and kelp’s high adaptability to environmental fluctuations, and its complex interactions with upwelling and local nutrient conditions. This MHW also occurred in the middle of the broad spatial distribution of Macrocystis that exposes the species to higher temperatures elsewhere in its range. The absence of major biological impacts may be related to the species’ thermal tolerance and the occurrence of the MHW relative to this tolerance or distribution.
Western Australia 2011 – Category IV (Extreme)
The Western Australia 2011 MHW lasted 66 days, with 12% of the days classified as extreme, and 12%, 33%, and 42% as severe, strong, and moderate, respectively (Table 2, Figure 3j). The peak intensity was 4.89°C above regional summer averages. Impacts were particularly severe near the northern range limit of the dominant habitat-forming seaweeds Scytohalia dorycarpa (Smale and Wernberg, 2013) and Ecklonia radiata (Wernberg et al., 2013, 2016) as both became regionally extinct along >100 km of coastline. The biological implications were particularly dramatic for the latter extinction as extensive Ecklonia kelp forests were rapidly replaced by small turf-forming algae, with wide ranging impacts on associated invertebrate and fish communities (Wernberg et al., 2013, 2016). Severe negative impacts have also been recorded for other foundation species, including seagrasses (Fraser et al., 2014; Thomson et al., 2015) and corals (Abdo et al., 2012; Moore et al., 2012) as well as on commercially important invertebrates, such as blue crabs and bay scallops (Caputi et al., 2016).
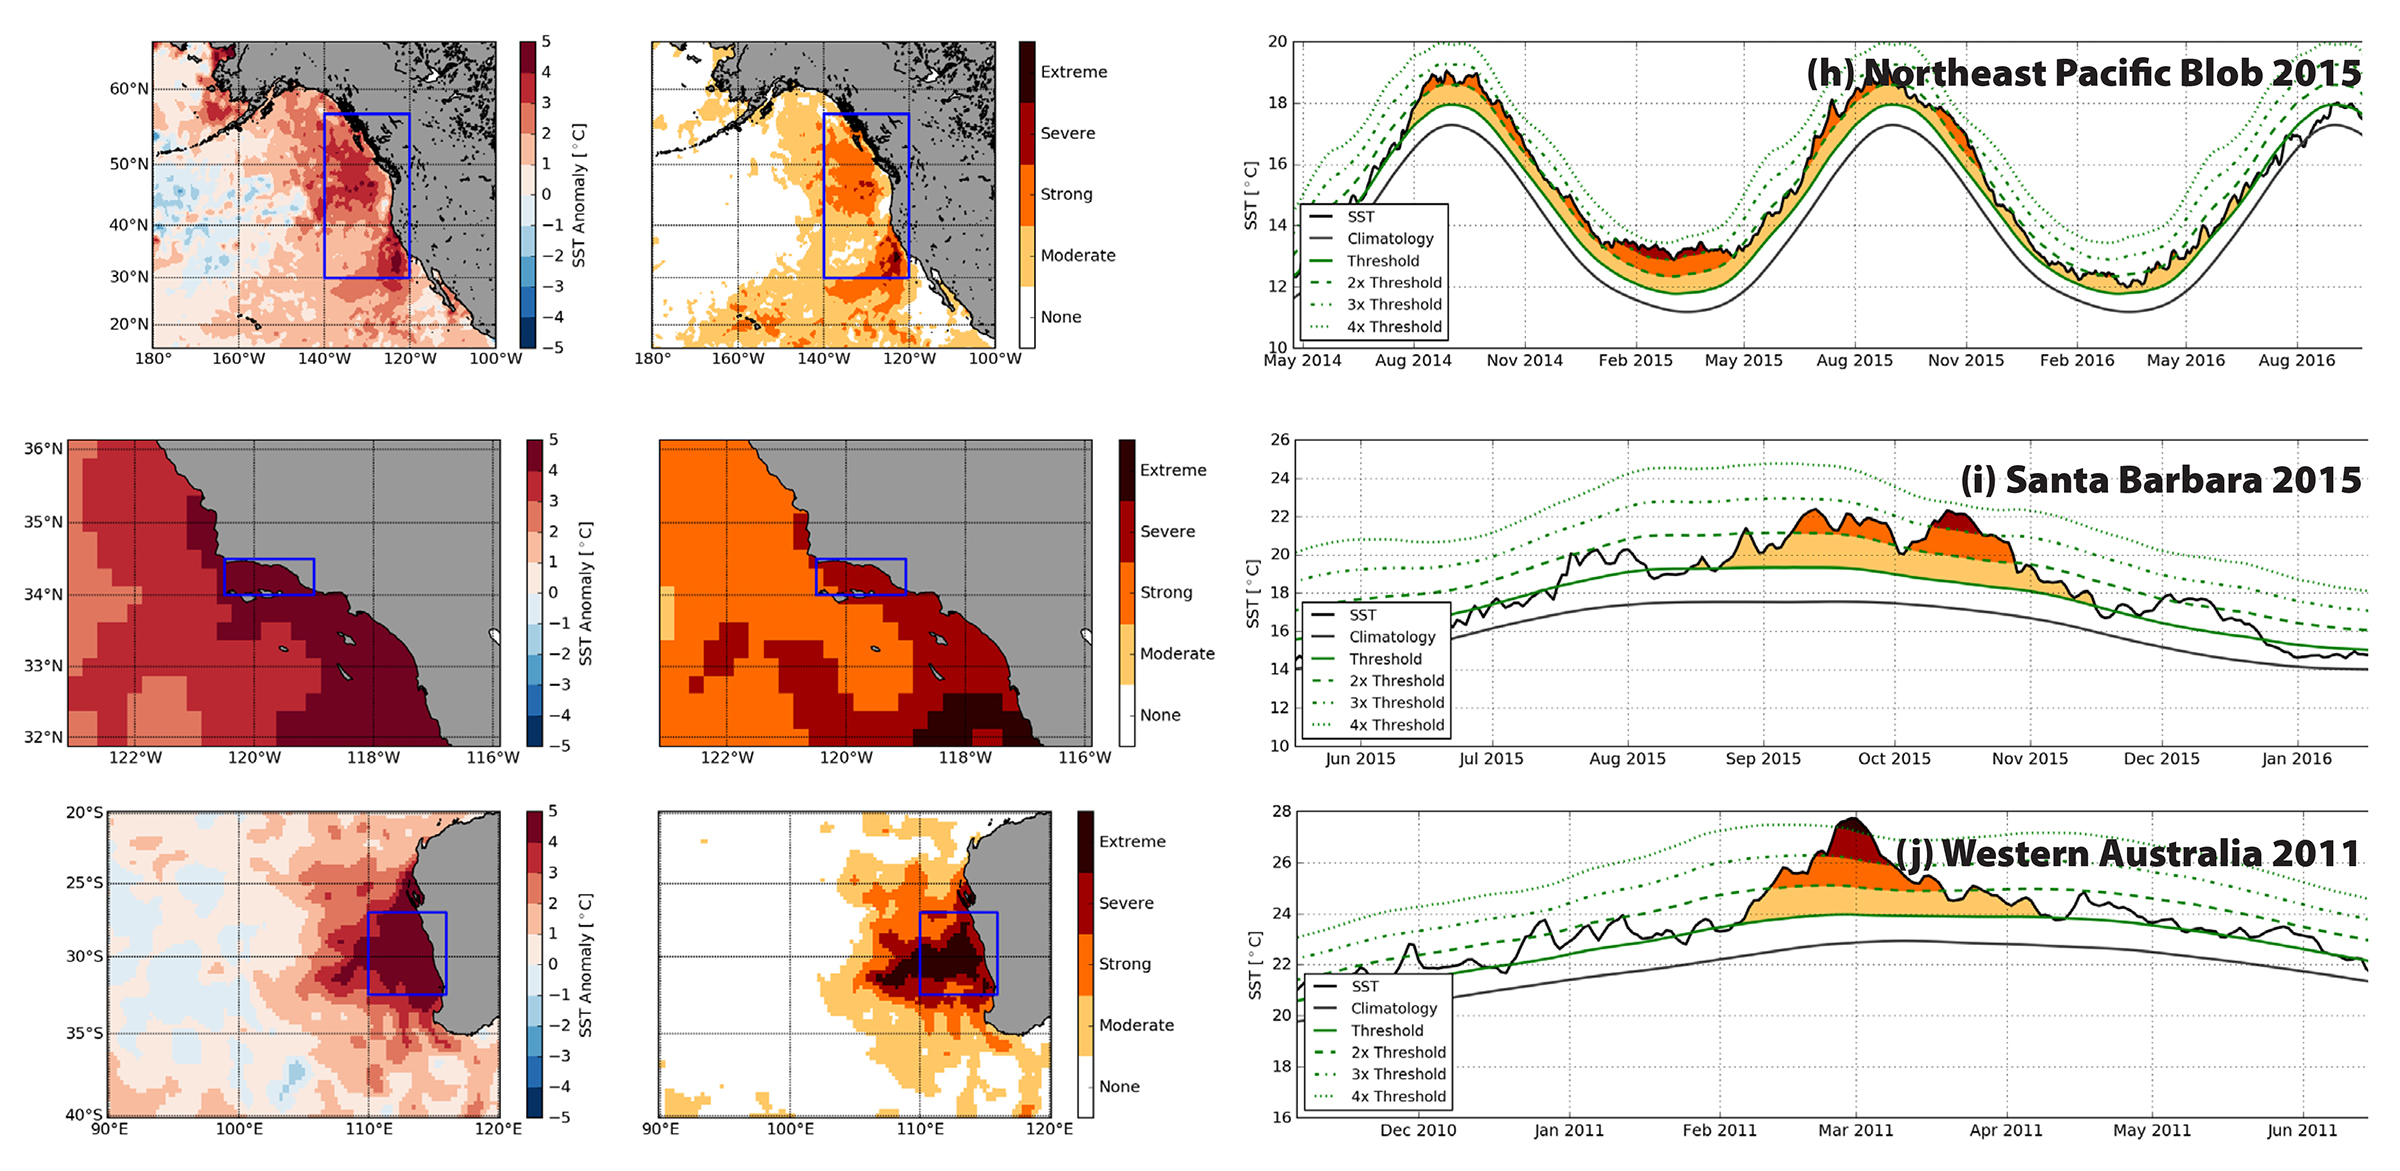
Figure 3h–j. Representative MHW events showing the sea surface temperature anomaly at the peak of the event (left column) based on NOAA OISST V2, the categories of MHW (middle column), and the time series of each event, spatially averaged over the area shown in blue in columns 1 and 2, with the category for each day indicated by colors (right column). (h) Northeast Pacific Blob 2015. (i) Santa Barbara 2015. (j) Western Australia 2011. > High res figure
|
These examples show that MHWs classified as severe (Category III) or extreme (Category IV) generally have more dramatic biological impacts compared to moderate or strong MHWs. For example, the extreme Western Australian 2011 MHW dramatically affected entire coastal temperate communities, as the thermal maxima of key habitat-forming species were exceeded with wide-ranging, cascading effects (Wernberg et al., 2016). In contrast, only limited biological impacts have been reported as a result of moderate and strong events. Biological impacts were still varied for events within the same MHW categories, indicating that it is essential to consider the thermal tolerances of impacted organisms as well as local hydrodynamic conditions. The different amounts of time in each MHW category during an event may also be relevant to future biological impact studies, as might be the overall duration of the event. Additionally, temperatures that are above average but not classified as MHWs may have biological impacts. Future studies are needed to better characterize these sensitivities and the different biological impacts of MHWs. Developing integrated measures of MHW impact that account for intensity, duration, and area would also complement the categorization proposed here. Such a severity index—derived from maximum intensity and duration—has been used for atmospheric heatwaves (Russo et al., 2014) and proposed for MHW biological impact studies (recent work of author Smale and colleagues).
Comparing all the MHWs that occurred in the period 1982–2016 in each example region shows that the frequencies of absolute sea surface temperature anomalies (Figure 4a) are scaled such that more equal proportions of events occur in each of the categories (Figure 4b). This scaling is similar to that proposed for atmospheric heatwaves (Nairn and Fawcett, 2015) and recognizes the higher variance in temperate waters compared to tropical waters. Thus, in this proposed MHW categorization, a maximum intensity of 5°C in the temperate ocean is approximately equivalent to a maximum intensity of 2°C in tropical waters—though both represent Category III (extreme) heatwaves. Some 80% of all MHWs across regions are Category I, with very few Category IV events. Comparisons between regions, based on categories rather than absolute values, may better reflect the sensitivity of biological systems in each region—an area for further work.
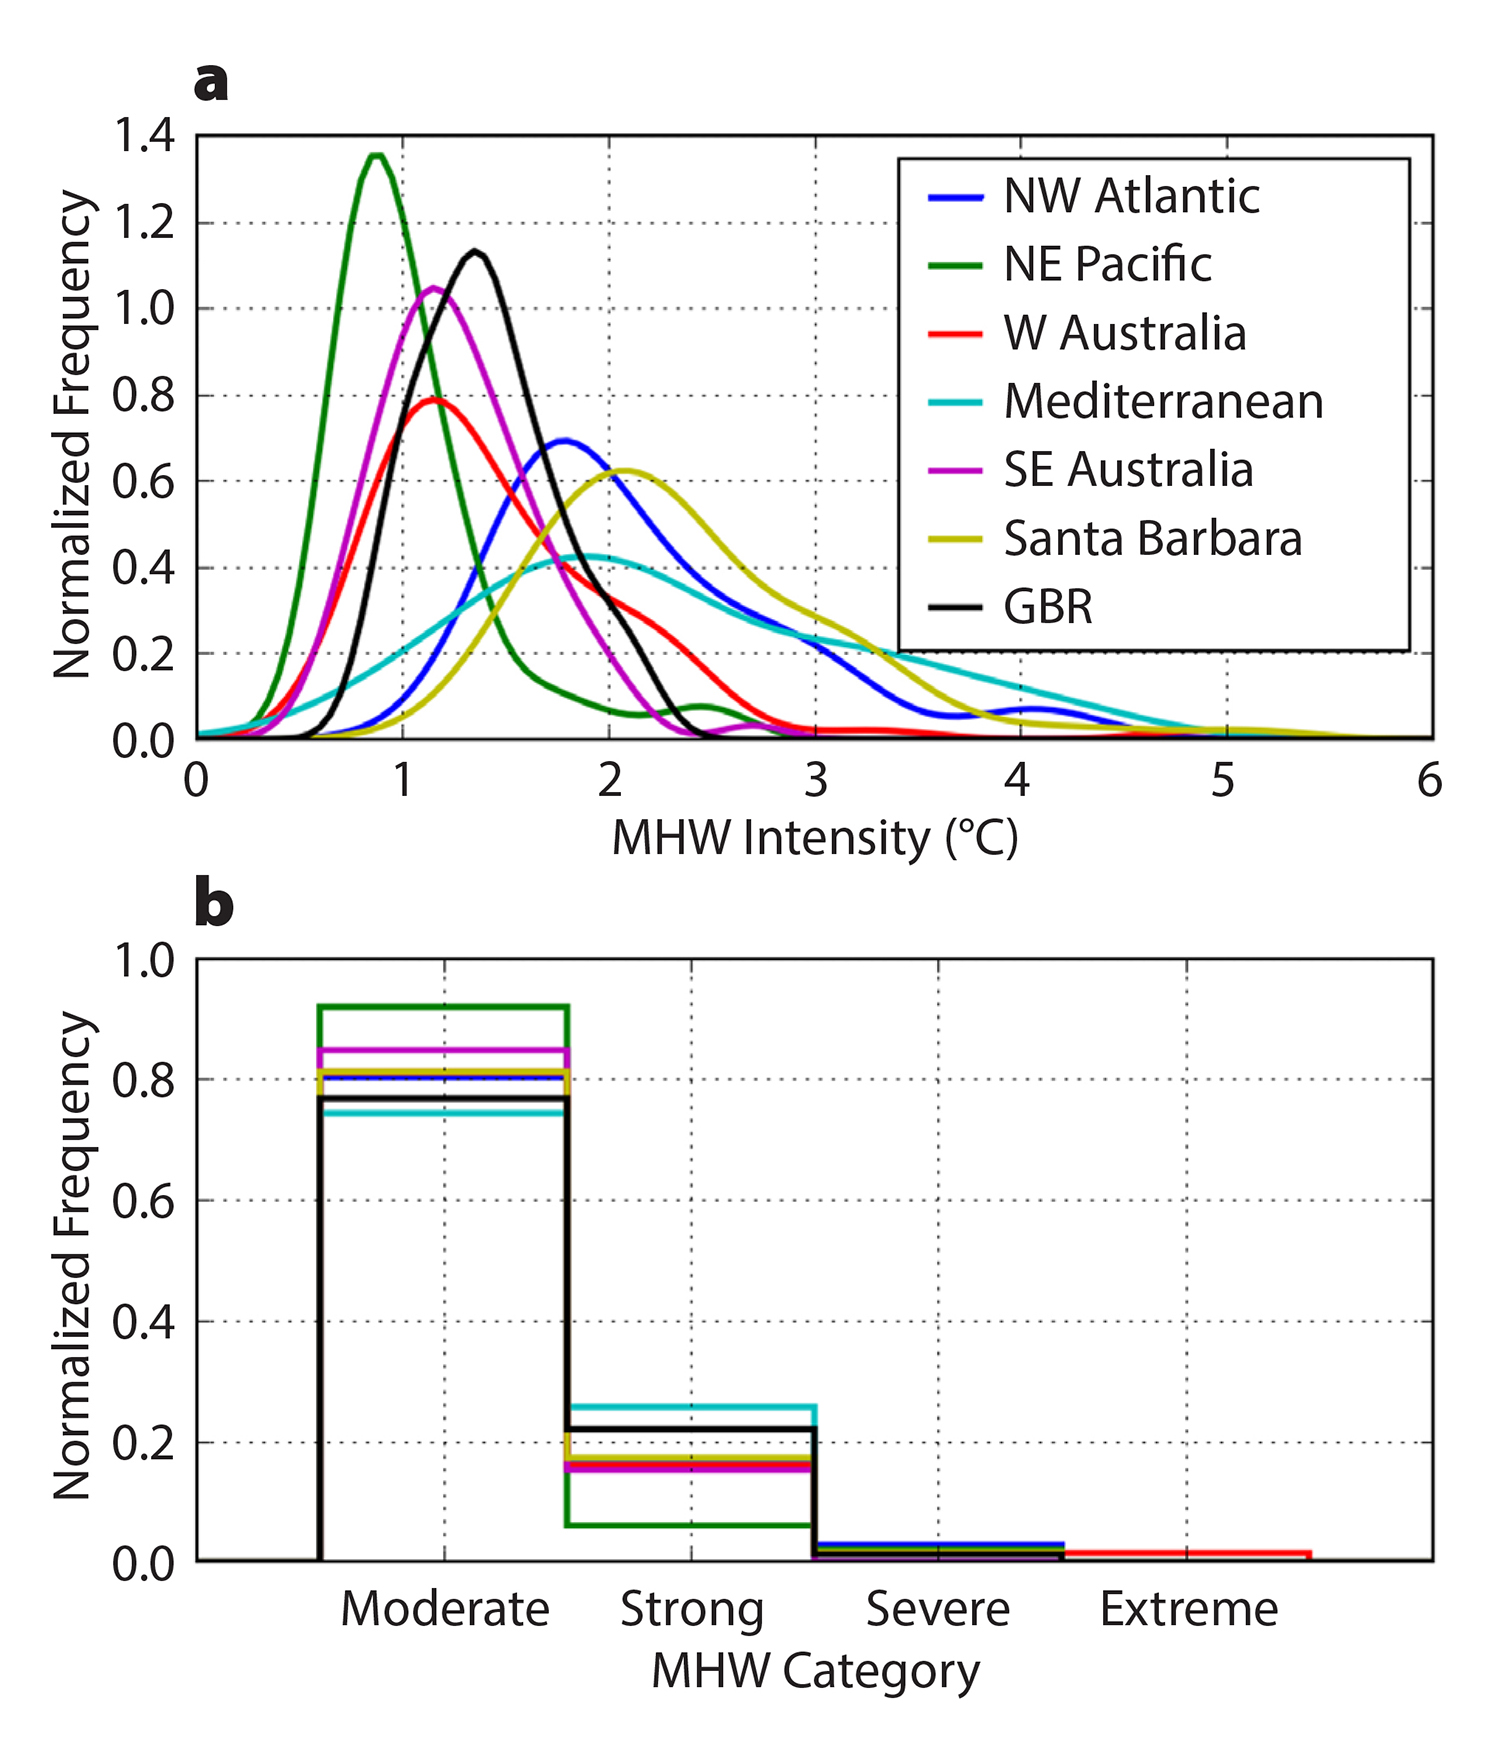
Figure 4. Frequency distribution of all marine heatwaves (MHWs) in regions listed in Table 2, based on analysis of the NOAA OISST V2 data set. (a) Probability distribution of MHW intensities for each of the regions considered over the time period 1982–2016. (b) Normalized distribution of all MHWs in each category in each region over the time period. > High res figure
|
Trends in Marine Heatwave Categories
With ongoing anthropogenic warming, there is the expectation that MHWs will become more intense over time. To examine this trend over recent decades, we calculated the maximum severity of MHWs occurring in a given year across the global ocean. Over the 35-year satellite SST record (Reynolds et al., 2007), there was a ~33% reduction in the area of ocean that does not experience an MHW at any time during the year (based on a linear regression; p <0.01; Figure 5a). While there is a long-term increase in the occurrence frequency of all MHW categories, the largest trend is toward more strong (Category II) MHWs—over the period there is a ~24% increase in the area where these events occur (p <0.01). This is consistent with analysis that showed general MHW frequency and duration increased by 34% and 17%, respectively, for the period 1925 to 2016, resulting in a 54% increase in annual marine heatwave days globally (Oliver et al., 2018). It is also clear that ENSO strongly modulates the incidence of high-severity MHWs. The area of ocean exhibiting strong, severe, or extreme MHWs clearly increases during periods of extreme El Niños (1982/83, 1997/98, and 2015/16; Figure 5a). Spatial maps of maximum annual MHW category indicate that higher-category MHWs are not confined to the tropical Pacific during El Niño years. Indeed, during 2016, a strong or greater intensity MHW affected about 70% of the ocean surface at some point, with only 5% of the ocean not affected by any class of MHW (Figure 5b). While our focus here has been on MHWs, our approach and definition has also been used to describe anomalous marine cold spells (Schlegel et al., 2017), and the proposed categories could also be used for such events.
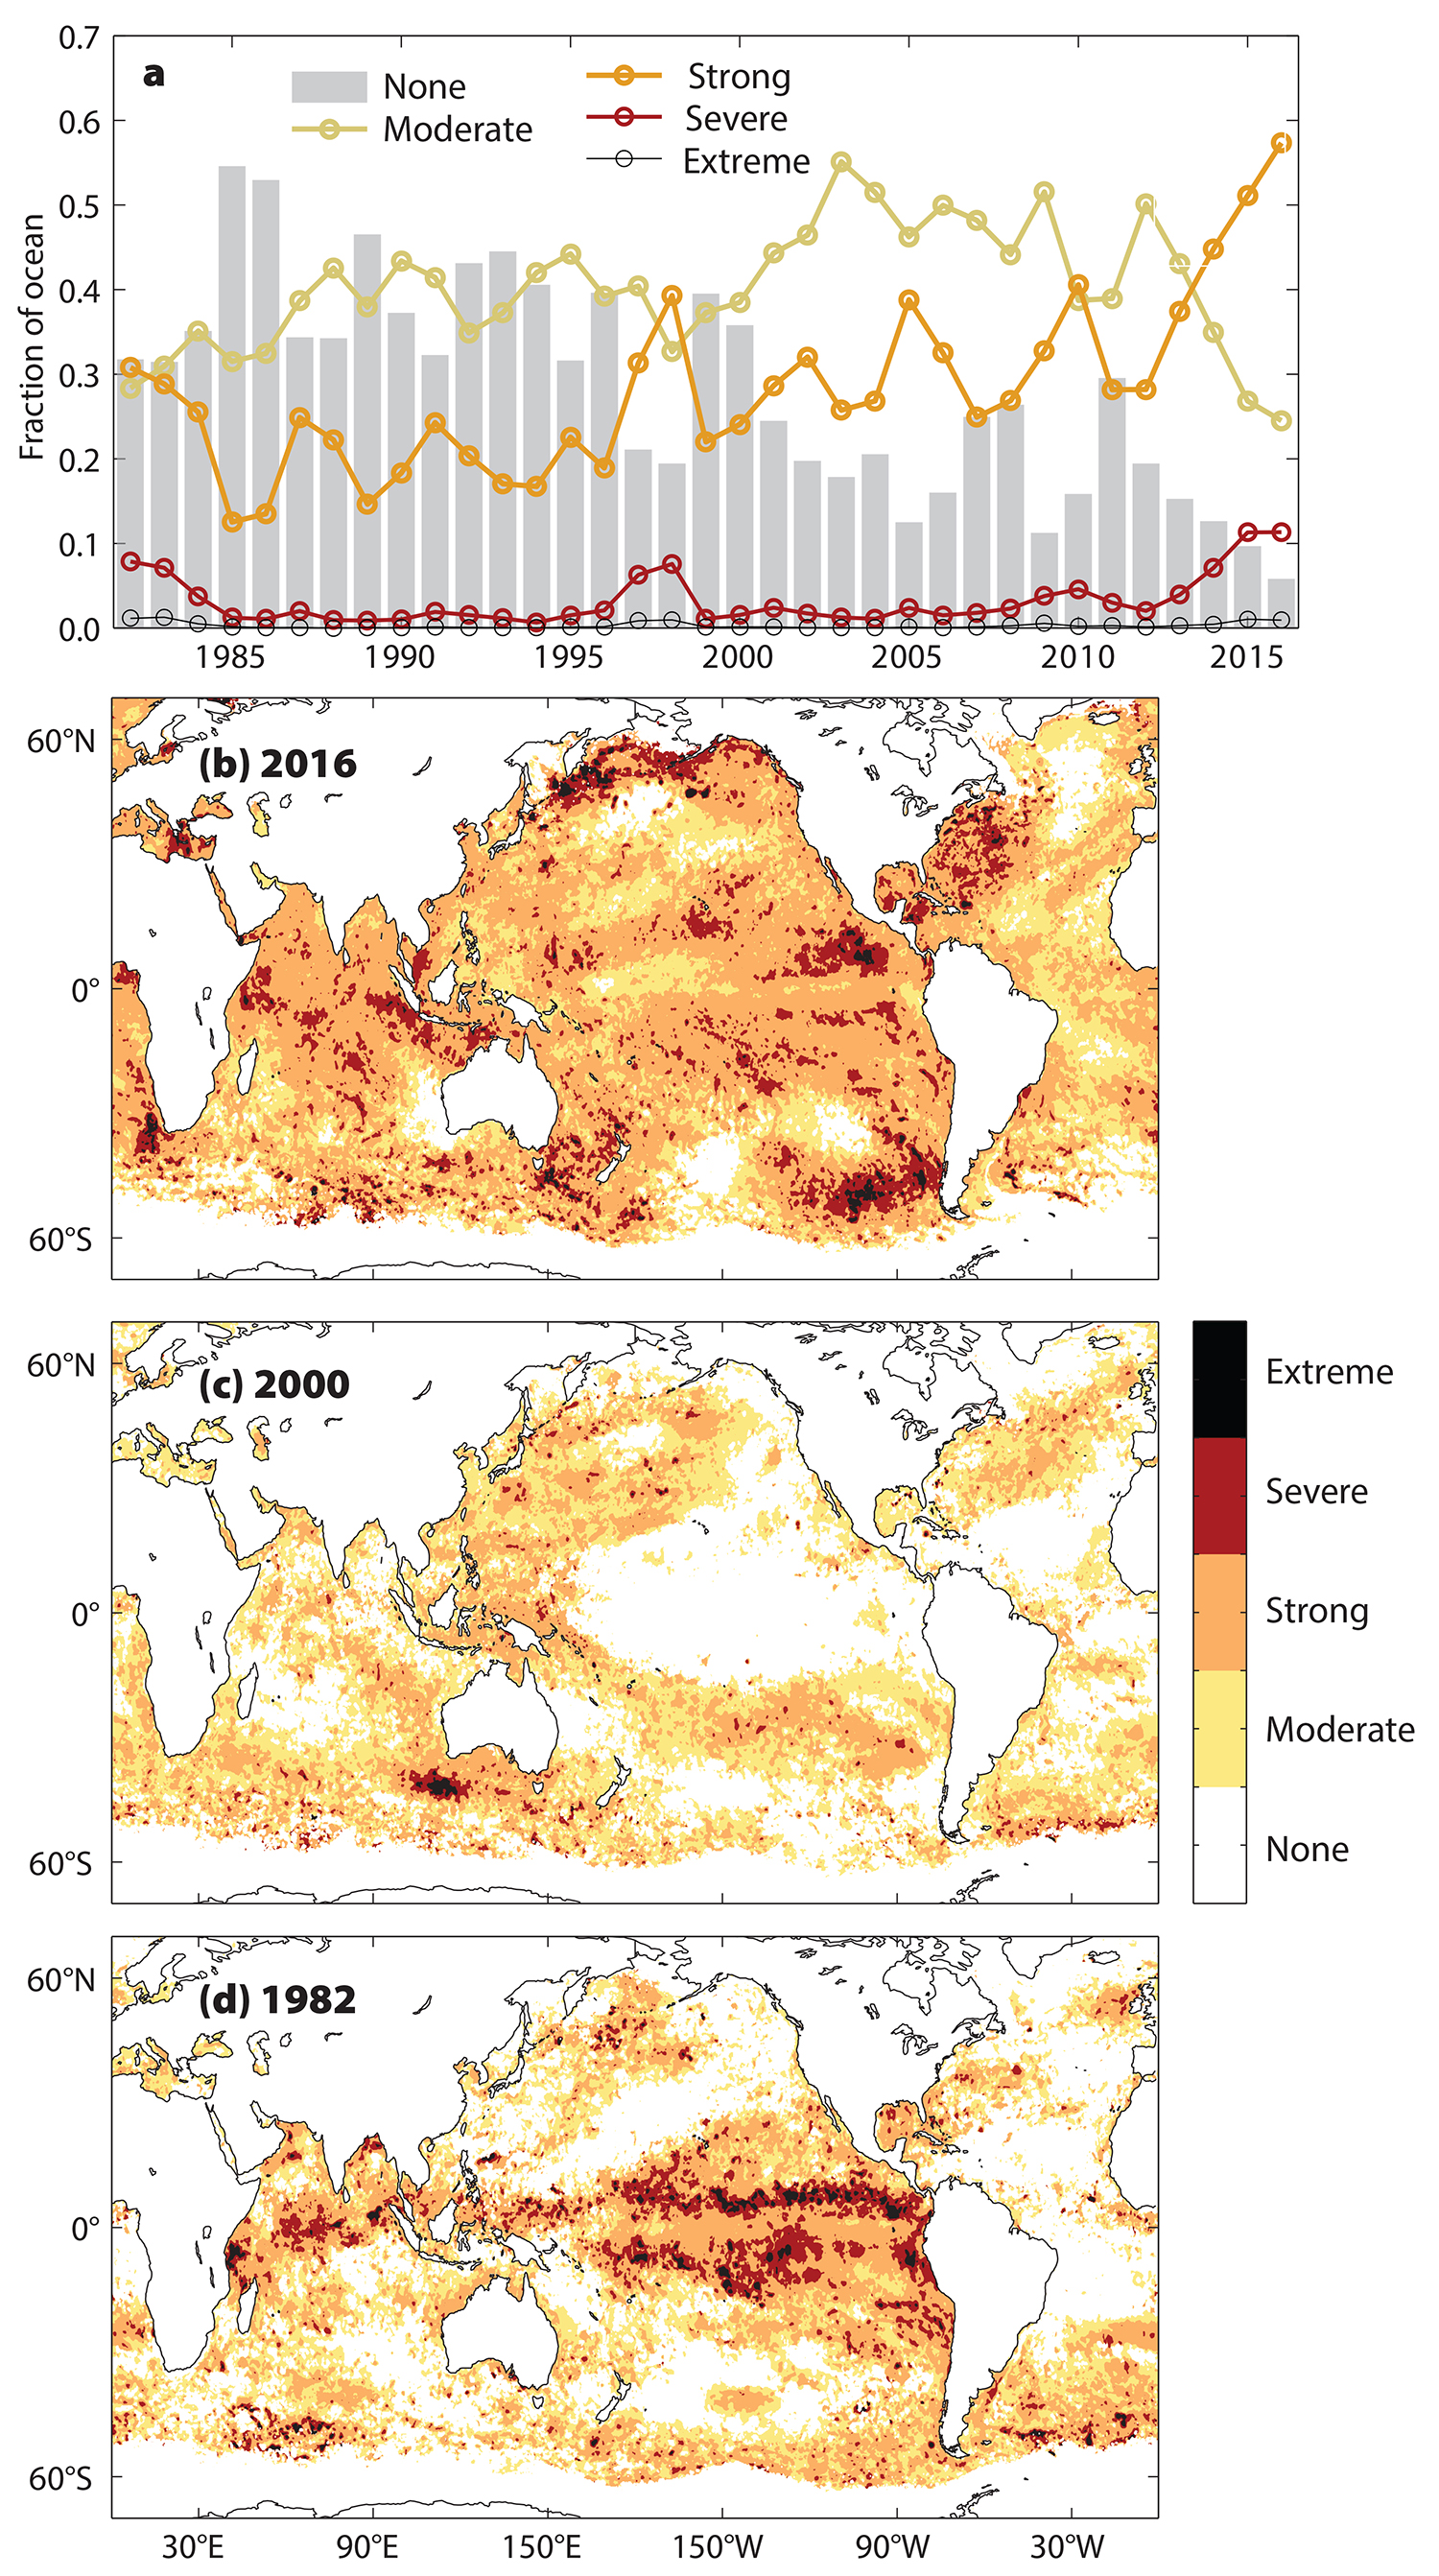
Figure 5. Maximum MHW category recorded per year based on the NOAA OISST V2 ¼° data set. (a) Fraction of ocean where there were no, moderate, strong, severe, or extreme MHWs. Maps locating maximum MHW category occurrences for example years (b) 2016, (c) 2000, and (d) 1982. > High res figure
|
Naming Marine Heatwaves
Comparison, communication, and familiarity with MHWs can be improved with categorization, as proposed above. Categorization can be further enhanced with a naming convention. Some informal names have been applied to recent MHWs such as the Blob (Bond et al., 2015), “Ningaloo Niño” (Pearce and Feng, 2013; Feng et al., 2013), and the “Tasman Sea MHW” (Oliver et al., 2017). This approach may work for a short time, until multiple events occur in the same region, at which time confusion will arise (e.g., multiple events have been described in the Mediterranean Sea), or when different names are used for the same event (Western Australia MHW, Ningaloo Niño, The 2011 MHW), or the name is also used to describe the general MHW phenomena in a region (e.g., Ningaloo Niño; Kataoka et al., 2014). While improvements to this ad hoc naming approach can be made, we do not propose a cyclone-equivalent system in which a pre-approved list of names is used to label each event. The generic names provided for hurricanes and cyclones (e.g., Cyclone Tracey, Hurricane Katrina) also lack any geographic or temporal information, which hampers communication. We considered using the dominant climate driver associated with the MHW (recent work of author Holbrook and colleagues), but these dominant modes can vary over time in the same region, are not region specific, and are too specialized to meet the communication need. While we have previously had difficulty in providing real-time assessment of MHW strength to media, fishers, and managers seeking to understand an event while it is occurring, testing this proposed classification scheme with media has received positive feedback.
Our general recommendation is for scientists working on MHWs to consider naming events based on co-occurrence with a geographic or oceanographic feature, accompanied by a year (e.g., Tasman Sea 2015; Northwest Atlantic 2012). This recommendation has several advantages, including promotion of ocean region understanding, it already has some precedence (e.g., Oliver et al., 2017), and it can still be general enough to cover the region impacted by the different MHW intensities. The year should be ascribed based on the year that maximum intensity is reached, so that an event spanning 2015/16 would be termed a 2015 event if Imax was reached in 2015. We suggest, however, that researchers working on MHWs consider naming events only once they reach Category II (strong) to avoid the confusion of having too many named events (Figure 5).
Conclusion
Naming and categorizing marine heatwaves is an important step toward improving comparative studies and enhancing awareness. The scheme proposed here to classify MHWs can be easily applied to new data in real time with a freely available R-code package (https://github.com/cran/RmarineHeatWaves, also available in Python) and will help to develop this new research area. This categorization will also facilitate public communication long into the future, as projections show that MHWs will occur year-round as the ocean warms. Thus, categorization will allow detection of an increase in Category IV events into the future. Because surface water temperatures are projected to increase further, additional categories V or VI can be easily accommodated by extending the proposed scheme. We recommend that future studies of MHWs utilize this proposed scheme, alone or in addition to other metrics, to apply a consistent naming convention.