The Role of Seasonal Ocean Forecasting
For the past 10 years, the seasonal forecast model originally developed at the (then) University of Washington Joint Institute for the Study of the Atmosphere and Ocean (JISAO) and known as J-SCOPE (JISAO’s Seasonal Coastal Ocean Prediction of the Ecosystem) has provided seasonal forecasts of coastal marine environments off Washington and Oregon.1 J-SCOPE is a regional model that aims to provide seasonal ocean forecasts to inform fisheries management in the Pacific Northwest. Its timescale of six to nine months into the future has been shown to be important for marine resource management decisions (Tommasi et al., 2017). J-SCOPE delivers management-relevant information to end users through a portal operated by the US Integrated Ocean Observing System (IOOS) regional association for Washington and Oregon, the Northwest Association of Networked Ocean Observing Systems (NANOOS; https://www.nanoos.org/products/j-scope). A specifically designed J-SCOPE portal features online data products such as temperature, chlorophyll, oxygen, aragonite saturation state (Ωar), pH, and other California Current Indicators identified by NOAA’s Integrated Ecosystem Assessment (IEA) as important for decision support; the product list includes wind and upwelling metrics as well as several species-specific habitat indices for both pelagic fish (sardine and hake) and benthic crabs (Dungeness crab). Since 2019, the Pacific Fishery Management Council (PFMC) has been receiving the January-initialized forecasts in early March to inform its activities. These forecasts, which include bottom oxygen and Ωar as well as hake habitat distribution, are presented to the PFMC by members of the California Current IEA and are included in their State of the Ecosystem report.
J-SCOPE is intended to provide actionable advance information on ocean conditions, such as oxygen concentrations, that managers may need to make effective decisions (Figure 1). Observations provide key input to calibrating and verifying models, such as J-SCOPE, as well as the 72-hour forecast model LiveOcean, which is also served by NANOOS. Access to real-time observations is also critical for “in the moment” decisions, such as when to pull tribal crab pots (E.J. Schumacker, Quinault Department of Fisheries, pers. comm., 2018). While the “weather-forecast” scale LiveOcean model can provide better spatial resolution and a few days’ advance notice of local ocean conditions, the seasonal timescale of J-SCOPE can inform managers about the outlook for fishery season conditions months in advance in order to facilitate planning and provide input to frame expectations regarding such severe conditions as hypoxia. Collectively, these observational and forecast tools have proven useful for supporting management decisions.
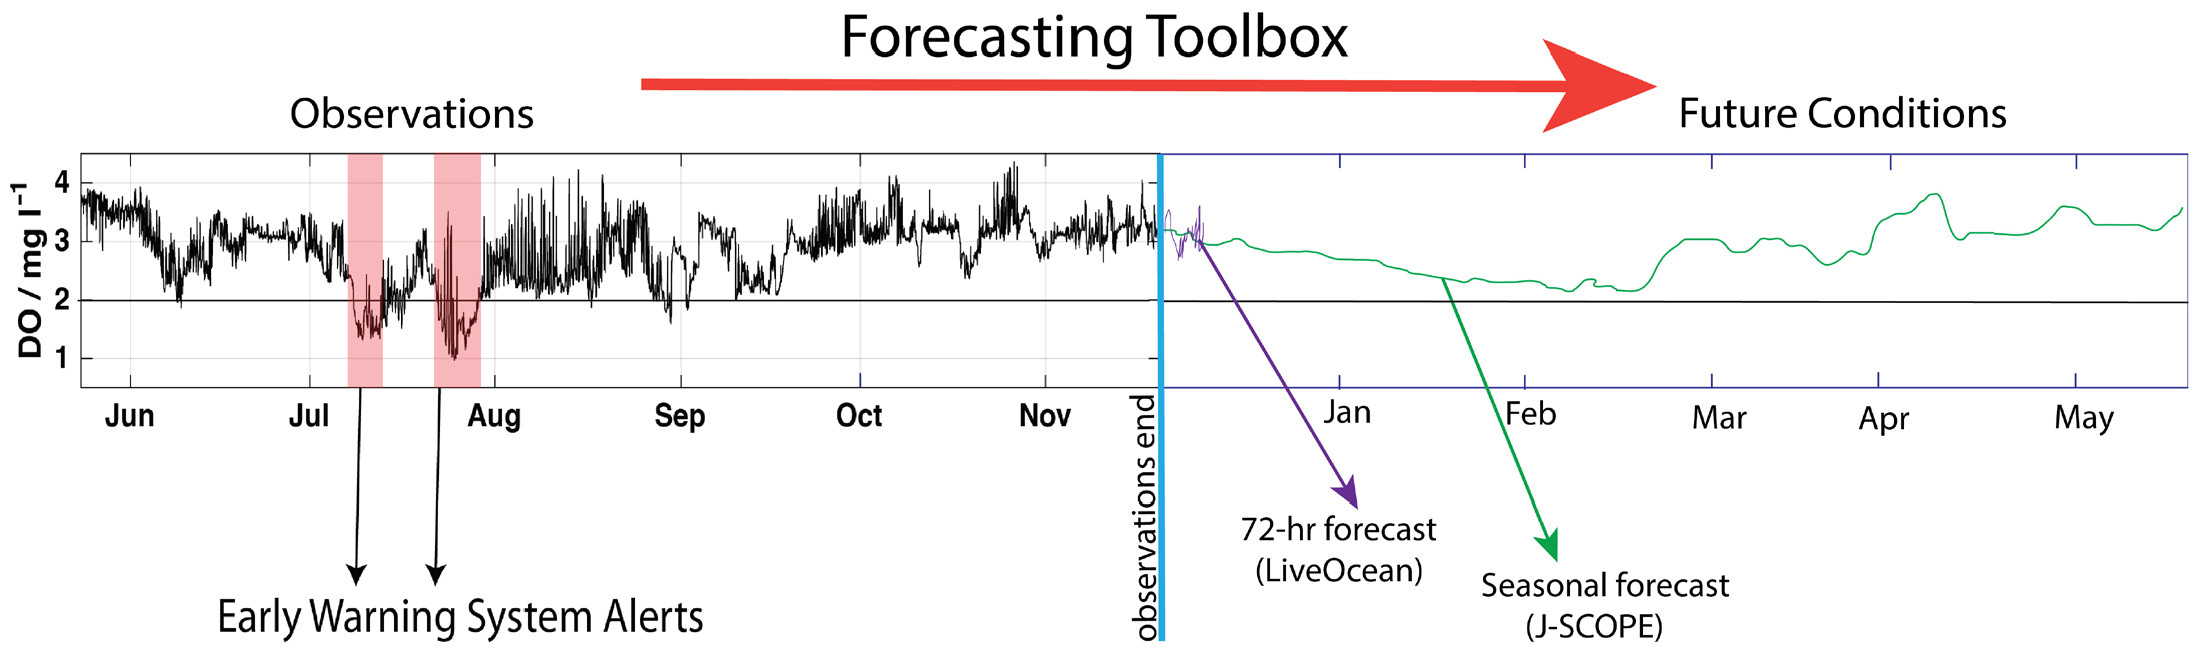
FIGURE 1. Forecasting toolbox cartoon depicting the concept of a suite of tools to support managers with oxygen observations and forecasts as the example. Oxygen observations are available in real time via email alerts sent to subscribed users when conditions become hypoxic. When the observations end, a series of forecasts become available through the same system that forecast conditions at those asset locations into the future at both 72-hour (LiveOcean model) and seasonal timescales (JISAO’s Seasonal Coastal Ocean Prediction of the Ecosystem [J-SCOPE] model). > High res figure
|
1 In 2020, JISAO was rebranded expanded, and renamed the Cooperative Institute for Climate, Ocean, and Ecosystem Studies (CICOES). It is now operated by a consortium among the University of Washington, the University of Alaska Fairbanks, and Oregon State University.
How Does J-SCOPE Work?
J-SCOPE features dynamical downscaling using a high-resolution version of the Regional Ocean Modeling System (ROMS), with initial and boundary conditions drawn from NOAA’s Climate Forecast System (CFS), a global, coupled, coarse-resolution climate model. CFS represents the atmospheric and oceanic forcing of the ROMS-based forecasts, with climatological values used for freshwater and tidal forcing. The ROMS simulations use a grid spacing of 1.5 km to resolve mesoscale oceanographic features in the coastal zone (Figure 2; Siedlecki et al., 2016, 2021). J-SCOPE forecasts are initialized in January, April, and September each year, thus spanning forecast periods of about four to eight months, and are tailored to the decision each forecast supports. Once the ocean condition forecasts are available, the species-specific forecast products can be generated. Species-specific J-SCOPE products are based on empirical habitat-based analyses that utilize the ocean conditions to better match the forecasts with decision points. The biological analyses have included habitat, abundance, and even stress indices for various species, with varying degrees of focus on decision points or managed species (Kaplan et al., 2016; Norton et al., 2020, 2023; Malick et al., 2020a).
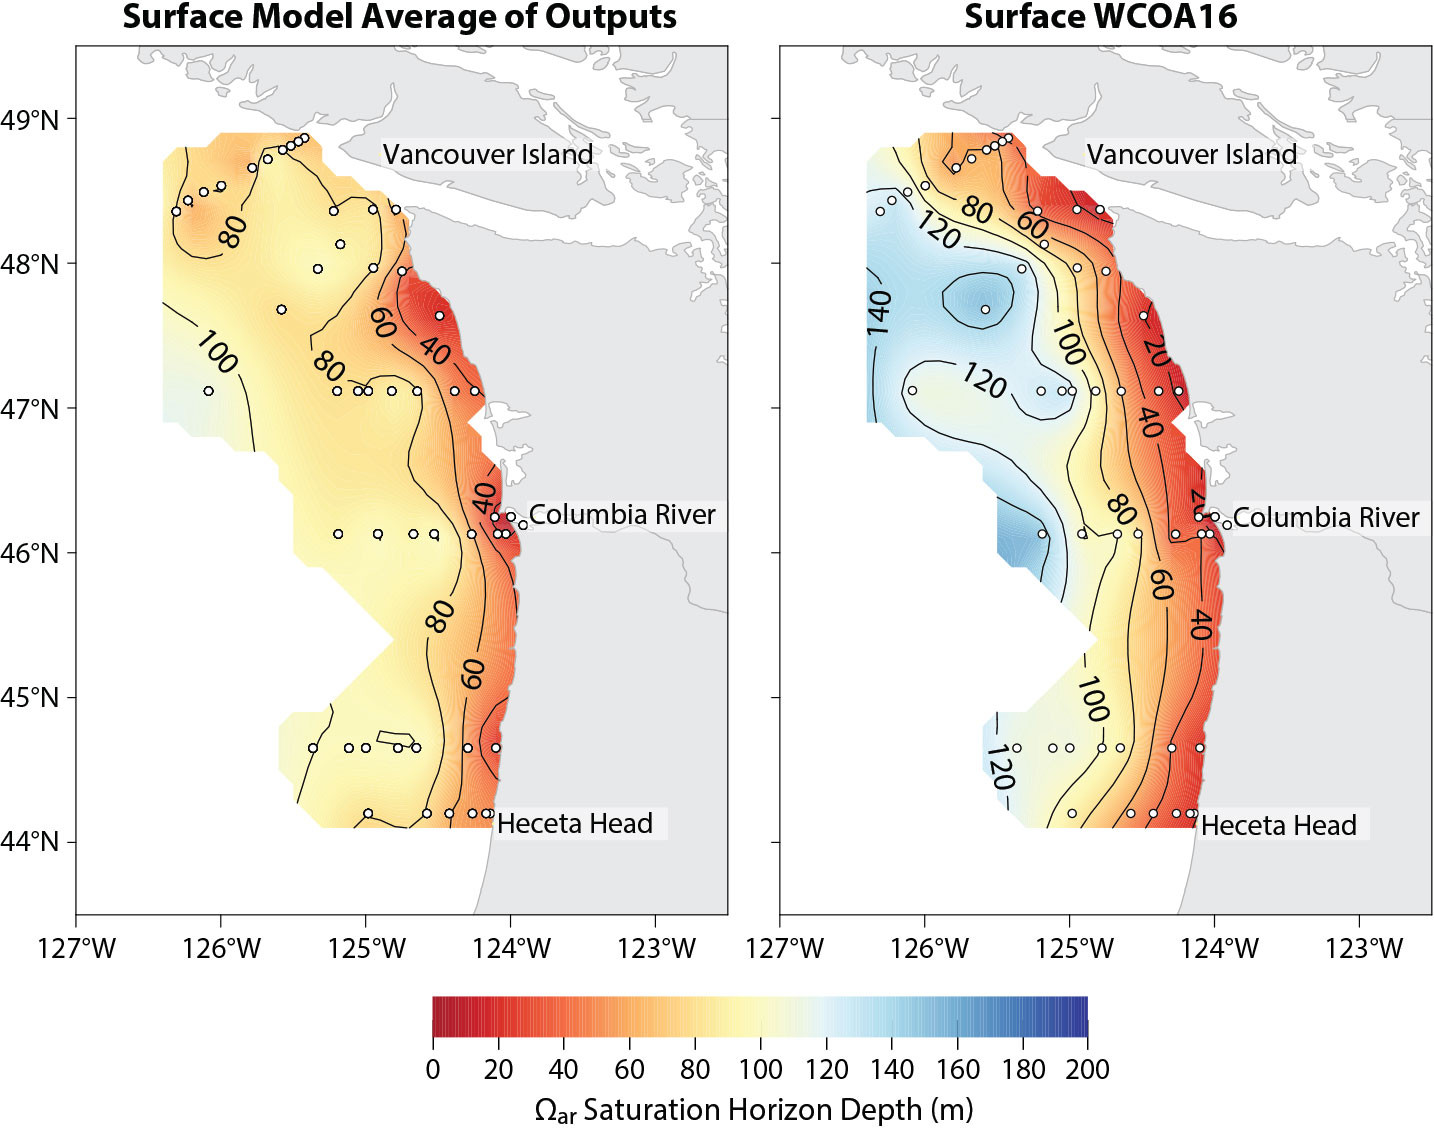
FIGURE 2. Pressure (which is approximately depth) of the aragonite saturation (Ωar) horizon from the January-initialized forecast from J-SCOPE in 2016 (left) and the West Coast Ocean Acidification 2016 cruise (right). Both panels were generated using the same individual station location information and plotting software to mirror the contouring interval in each. > High res figure
|
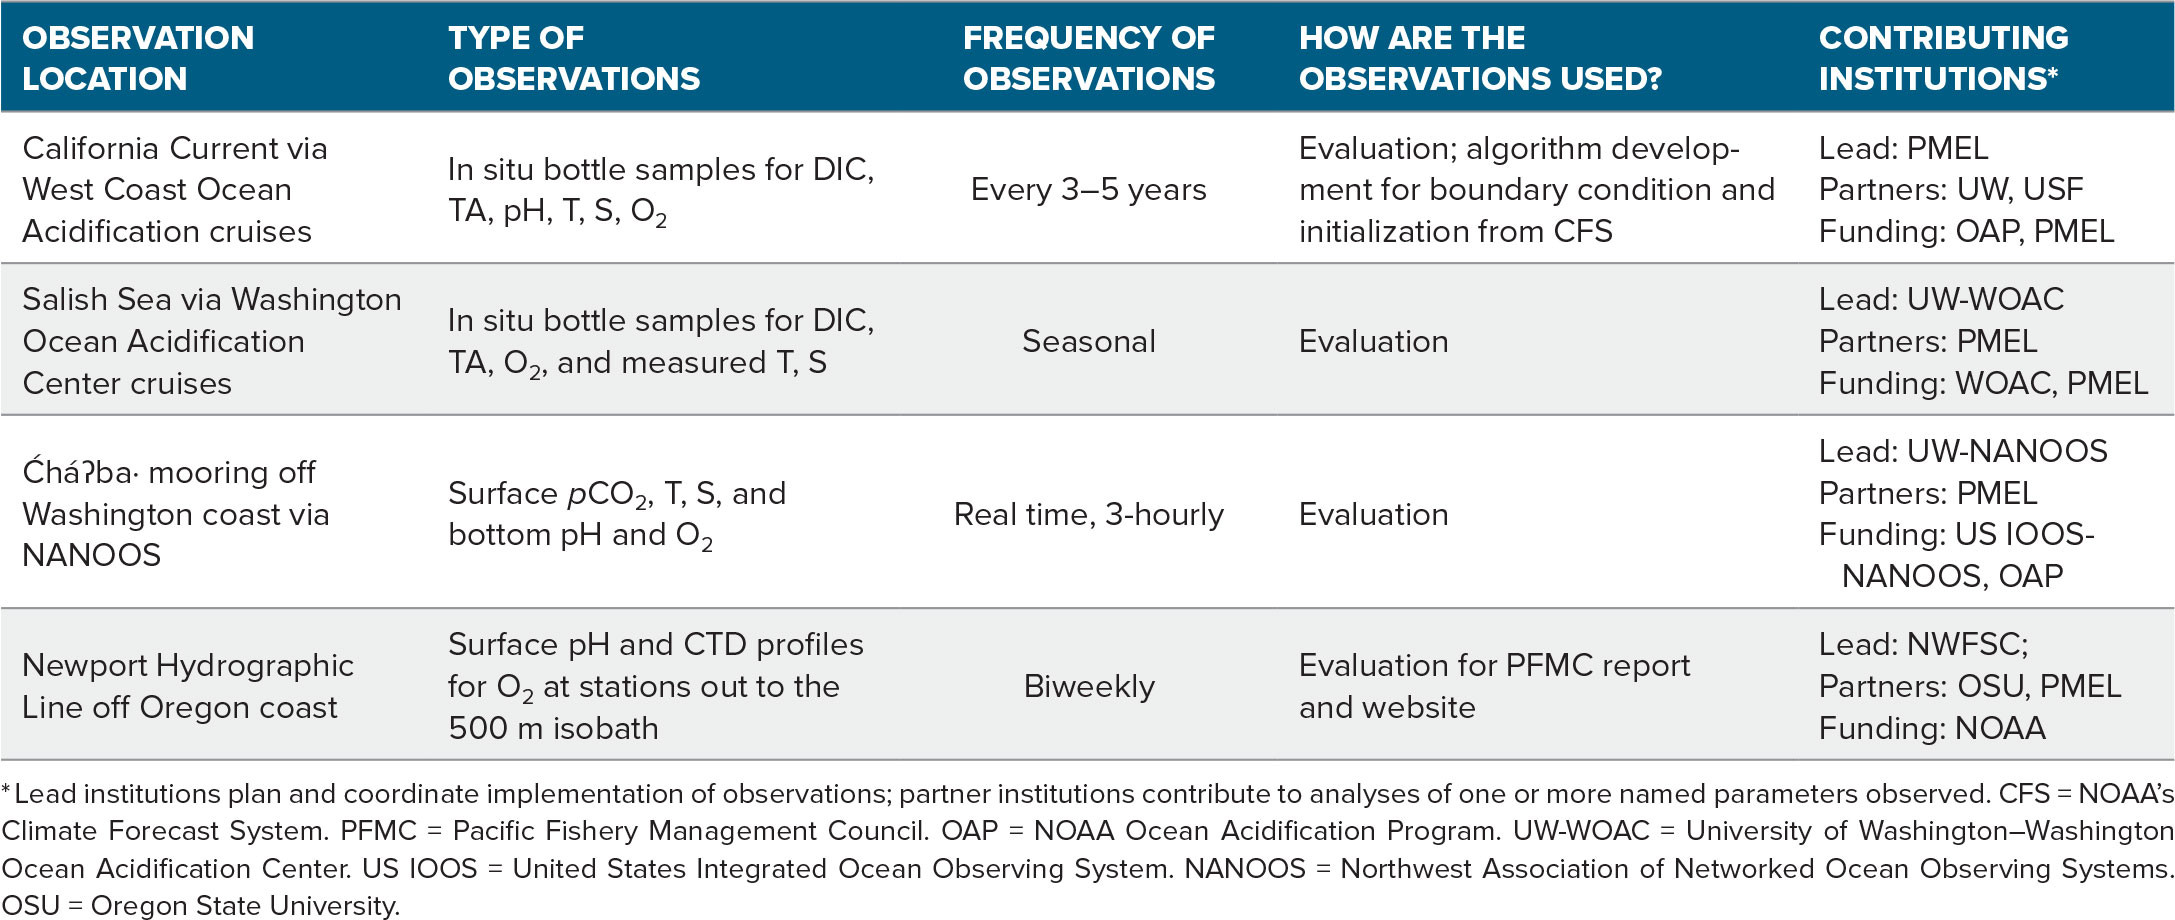
After generating seasonal forecasts and habitat models, the J-SCOPE team evaluates the model’s skill using three approaches. First, to understand bias in the forecasts—which is important for building trust with end users—forecast conditions are compared to observed ocean conditions collected by scientists at the NOAA Pacific Marine Environmental Laboratory (PMEL) and by other regional partners (Table 1). Second, we carry out model hindcasts with a version of the CFS featuring data assimilation; the ROMS model output based on the “observed” climate forcing is compared with observations to assess the quality and reliability of the dynamical downscaling using ROMS. Third, we compare the hindcast to the forecast conditions to identify strengths and weaknesses inherent in the forecast. Additionally, by averaging three model runs begun at different times during the initialization month, we estimate the uncertainty of the forecast, which is another critical piece of information for building trust with forecast end users. Understanding forecast skill for ocean conditions is a key first step toward understanding habitat model skill (e.g., Kaplan et al., 2016; Malick et al., 2020a; Norton et al., 2020, 2023).
TABLE 1. Ocean observations that are used to evaluate and inform J-SCOPE forecasts, including dissolved inorganic carbon (DIC), total alkalinity (TA), partial pressure of carbon dioxide (pCO2), pH, temperature (T), salinity (S), and oxygen concentrations (O2) collected by the NOAA Pacific Environmental Laboratory (PMEL), the University of Washington (UW), the University of South Florida (USF), and the NOAA Northwest Fisheries Science Center (NWFSC). > High res table
|
The forecasts and their skill assessments are posted on the NANOOS website (example shown in Figure 3) soon after they are generated, with a series of web pages organized by species supporting each individual forecast. In the case of the California Current Indicator page, the J-SCOPE team provides additional information produced elsewhere that includes indices for El Niño-Southern Oscillation (ENSO) and Pacific Decadal Oscillation (PDO).
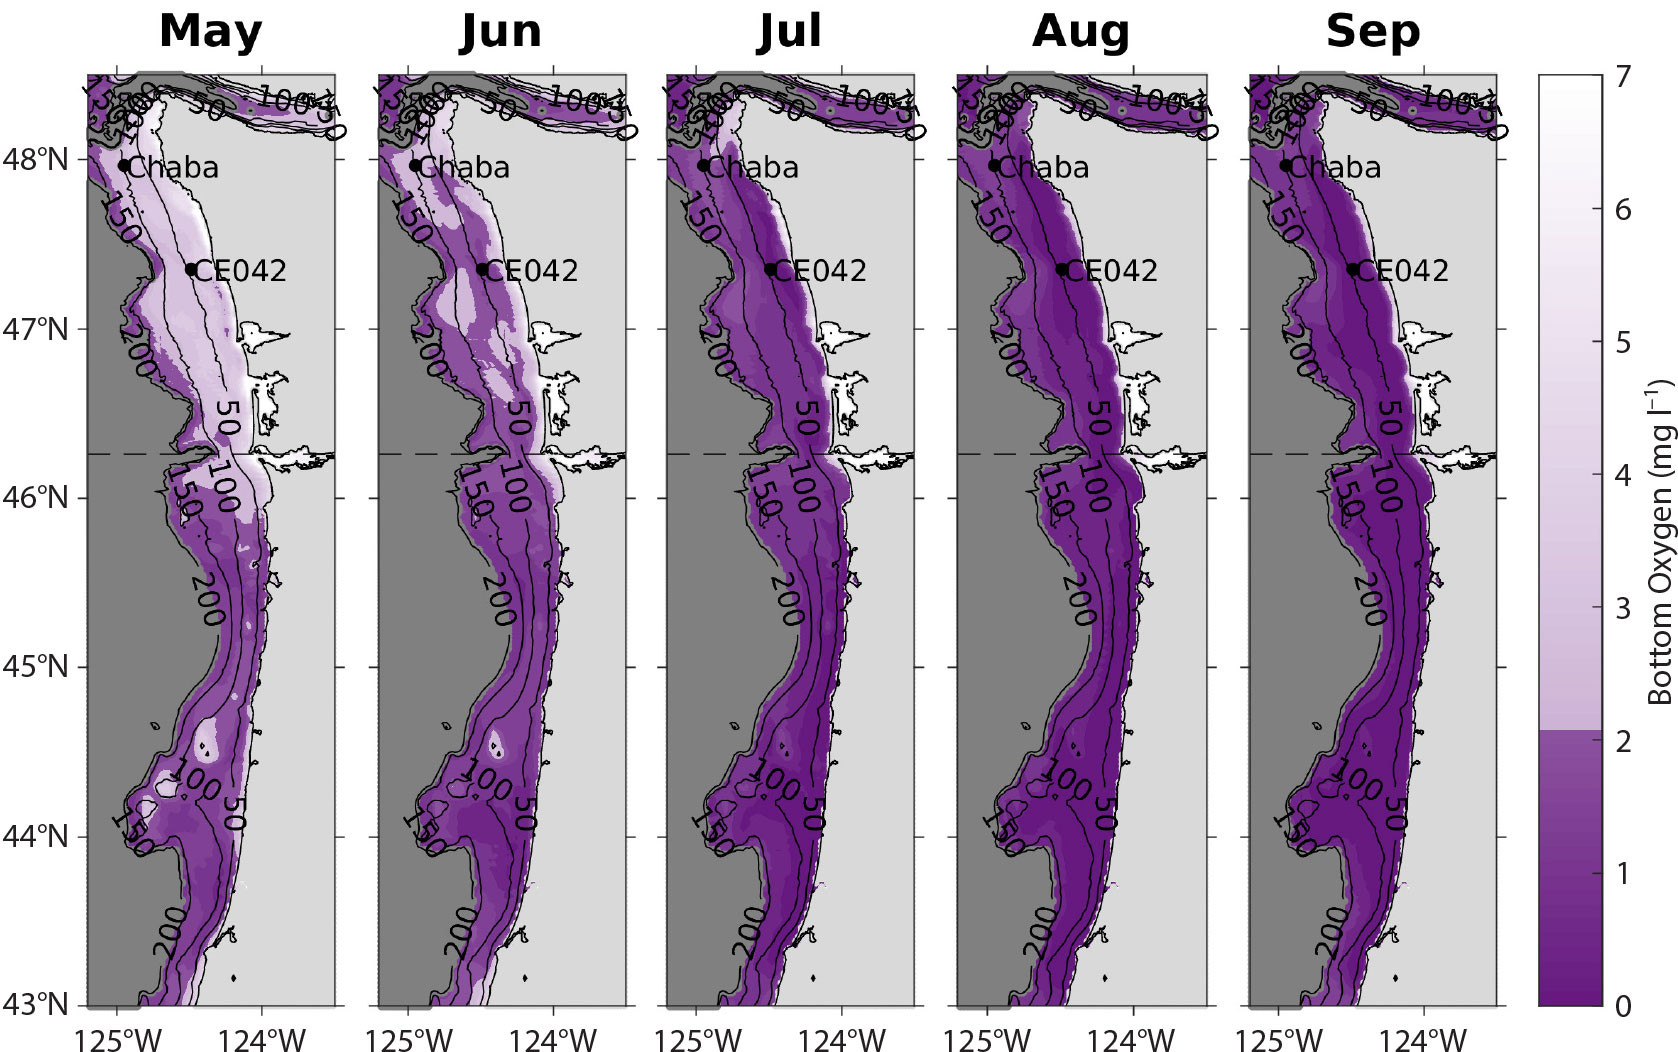
FIGURE 3. January-initialized forecast from 2023 for hypoxia in bottom waters within the J-SCOPE domain. The managers co-developed this product, designating the relevant assets, state boundaries, bathymetric contours, units, and the color scale to include. > High res figure
|
Here, we outline the story of how J-SCOPE began, the approach of tailored forecasting, and the new science discovered along the way. Keys to our success have been willingness to explore the model’s abilities in tight co-development and model evaluation among scientists and state and tribal managers, so that all were aware of strengths and limitations, with widely available access to information products via NANOOS.
History of J-SCOPE
The idea for J-SCOPE grew from discussions between NOAA Northwest Fisheries Science Center (NWFSC) staff and the climate dynamicists and ocean modelers at JISAO. Seeing that the global models had some success in providing ocean forecasts for ENSO, the group was inspired to try this with a downscaled localized model. J-SCOPE’s first forecast in 2013 was publicly available on the NANOOS website. Though early forecasts included predictions for variables expected to be of interest to managers, because these predictions were still being developed and evaluated, many of these products were not delivered directly to managers until 2019. The six years in between included many meetings with scientists and fisheries managers as well as presentations to management council steering committees in order to build products they needed as well to cultivate their trust in the tool. All the while, the forecasts continued to be made—and sometimes announced during talks at conferences—and were available on the web for all to see.
In the beginning, we had not yet published any information about the ocean forecast skill, and the community had not yet determined standards for ocean forecasting skill assessment. To this day, questions exist around how good is good enough to be used for management decisions, but standard metrics have been established, and continue to evolve, in order to quantify skill. In particular, ongoing assessment of model skill was hampered by the lack of real-time observations, especially involving subsurface variables. The process by which appropriate protocols were established involved attending workshops where many disciplines were represented, including those for the global modeling and weather communities, to learn what they had done; initiating individual conversations with end users and decision-makers; and generating peer-reviewed publications regarding the protocols. In the end, we determined that different visualizations of the same information were needed in order to serve different communities.
For the scientific community, J-SCOPE forecasts needed to be skillful not just for ocean conditions like temperature, oxygen, and aragonite saturation state (Siedlecki et al., 2016), but for species-specific habitat indices (Kaplan et al., 2015; Malick et al., 2020b; Norton et al., 2020, 2023). Consequently, proof would need to be in the form of peer-reviewed journal articles. The source of the predictive skill has yet to be fully documented, although previous studies indicated the potential importance of ENSO teleconnections to the North Pacific (Alexander et al., 1999; Jacox et al., 2019, 2020). Ray et al. (2020) show that properties of the North Pacific represent a primary source of predictability for bottom temperatures within the J-SCOPE domain in the vicinity of the coast. A follow-up study notes that the prior winter’s surface ocean conditions from the CFS are significantly related to bottom temperatures recorded the following summer (Ray et al., 2022), and that the relationships are stronger during ENSO-neutral years. Work is still in progress to determine how these mechanisms affect ocean biogeochemistry, which has also been shown to be skillfully forecast, in some cases with even more skill than the physical variables (Siedlecki et al., 2016). Understanding why the forecasts are skillful engenders confidence in their performance and builds trust with communities concerning the reliability, and attendant uncertainties, in the system.
In addition to providing skillful forecasts, experience with J-SCOPE has brought success and also lessons about how our efforts could be improved over the years. Here, we define success as a decision made using a J-SCOPE forecast of oceanic conditions for its intended purpose(s) (Malick et al., 2020b; Siedlecki et al., 2021). While the forecasts and simulated conditions perform well, the ultimate goal is to have end users rely on the forecasts to support decisions. Toward that end, the co-design experience between scientists and managers in a deliberative and communicative atmosphere, with annual online performance evaluations, has fostered trust in the skill and understanding of the limitations of the forecasts. For example, after years of co-development of forecast products involving state and tribal marine resource managers of the Dungeness crab fishery, the J-SCOPE oxygen forecasts led to the decision by the Quinault Indian Nation to close the fishery early in 2018 (Siedlecki et al., 2021). This action represented the first implementation of the overriding objective of J-SCOPE, namely, to provide predictions in support of the management of marine resources. This fishery closure occurred because we regularly communicated the research status and performance of our forecasts via both our website and direct delivery of the forecasts through meetings with managers with whom products were co-developed.
In what follows, we present more detailed case studies from J-SCOPE’s three primary successes, as defined above, and discuss where forecasting limitations have led to lessons learned, to illustrate both the difficulty of developing new capabilities and the power of doing so via co-design.
Case Studies: Balancing Scientific Forecast Skill with Management Needs
The first case study involved forecasting sardine habitat. This project linked forecasted oceanography to sardine spatial distributions and helped us refine the forecasting of ocean conditions as well as habitats. The motivation was that sardine are sometimes present in US waters and at other times are more likely to be in Canadian waters, so managers would benefit from knowing their habitat distributions in advance. A key lesson was dealing with forecast bias. J-SCOPE forecasts of ocean conditions have biases, documented in Siedlecki et al. (2016) and described on the website. In simple terms, this means that models never perfectly match observations (e.g., Figure 2), and we must quantify the extent of the mismatch. Biases in ocean variables can be partially accounted for when predicting species distributions (Kaplan et al., 2016) by training statistical habitat models on the biased forecast fields and considering ocean condition performance in variable selection as outlined in Kaplan et al. (2016) and Norton et al. (2020, 2023). However, unlike bias, lower predictive skill of ocean conditions can lead to lower skill for habitat models. J-SCOPE skill metrics suggested that the surface ocean is less predictable than deeper portions of the water column—hence, reliable habitat forecasts for surface-dwelling species such as sardine are more difficult to develop. In addition, we discovered that, although we could predict overall habitat suitability (sometimes called “fundamental niche”), the actual locations occupied by sardine (“realized niche”) are much harder to predict and likely depend on total population size of this highly variable and mobile species, and not just on ocean conditions. Though these challenges limit the applicability of sardine habitat forecasts to fishery management decisions, we transferred the lessons learned to other species—with a particular focus on species deeper in the water column, where seasonal forecasts have higher skill, and where populations are less variable.
The second case study concerned forecasting Dungeness crab metrics. Working with Dungeness crab fishery managers from an early stage to evaluate desired forecast products for their fishery led to development of several management-relevant products that continue to be used, including adult stage crab catch models and tailored maps of oxygen and hypoxia distribution. We found that J-SCOPE provided sufficient skill to forecast crab catch, but that the skill hinged on also having predictable (or known) fishing behavior (Norton et al., 2023). In the real world, this is a challenge because fisherman make active and dynamic behavioral decisions about where to fish, and unlike for finfish, there is no coastwide standardized survey that provides catch rates. An engaged management team was critical for identifying decision points and developing this product, which resulted in delivery of the catch per unit effort (CPUE) forecast information to the fishery managers. However, in our collective judgment, the uncertainty around the forecasts—due to uncertainties regarding future fishing behavior—meant that the forecasts were not ready for true predictive use in the management arena. Pursuing this would require integration of socioeconomic tools and capabilities into this research (a possible next step).
“The seasonal timescale of J-SCOPE can inform managers about the outlook for fishery season conditions months in advance in order to facilitate planning and provide input to frame expectations regarding such severe conditions as hypoxia.”
|
In working on forecast products for Dungeness crab, we also encountered a case of a “mismatch,” that is, a skillful forecast lacking a present application to management. Abundance of megalopae (the pelagic larval life stage before crabs settle to the bottom as juveniles) is correlated with Dungeness crab catch four years later (Shanks and Roegner, 2007; Shanks et al., 2010; Shanks, 2013). Because of this, PMEL and research partners have developed methods for linking the abundance and carapace integrity of megalopae through biological sampling efforts aboard West Coast Ocean Acidification (WCOA) cruises that are conducted every few years in the region (for additional detail, see Bednaršek et al., 2020; Norton et al., 2020; Saenger et al., 2023). Thus, a skillful forecast of megalopae abundance could provide the fishery with valuable information four years in advance, which would allow both fishermen and managers to anticipate the likelihood of poor years and take advantage of good ones.
As a first step toward development of this forecasting tool, we developed a skillful forecast of megalopae distribution (Norton et al., 2020). Several other metrics were considered for this life stage as well, including ocean acidification-related stress metrics (Bednaršek et al., 2017, 2020; Saenger et al., 2023). Despite managers’ interest in these models, they do not typically make decisions on this timescale (>4 years). Thus, no specific management decision ended up being informed, despite delivery of these forecasts to the state and tribal managers of the fishery. Without a specific decision to support, efforts to forecast abundance and distribution at this life stage have lost momentum. However, close collaboration with the Dungeness crab managers over this period helped spawn other ideas and approaches for development of management-relevant products, such as bottom hypoxia distributions and maps showing the percent of the water column that is hypoxic across the region. We assert that, while not all research will have immediate application, short-term value arises from these partnerships in the form of new ideas for products, with potential future interest in applying the four-year projection information.
The third case study involves forecasting Pacific hake distribution. Hake migrate along the west coast of the United States and Canada, so in order to get an accurate estimate of biomass, acoustic surveys are conducted annually over a large spatial area. To inform the timing and spatial extent needed for these surveys, hake forecasts were developed to predict the distribution of this species. The forecasts were built, in part, on prior empirical analyses of the role and importance of ocean conditions in explaining spatial variability in hake habitat and biomass (Malick et al., 2020a). These forecasts were found to offer skillful prediction of hake occurrence—a key variable that supports decisions about survey design as well as management of the hake fishery that spans US and Canadian coastal waters (Malick et al., 2020b). Ongoing work is focused on forecasting hake biomass distribution and also includes other variables like current speed and oxygen.
In a similar way, the WCOA cruises led by PMEL rely on J-SCOPE’s seasonal forecasts to plan each survey’s sample collection strategy (e.g., Feely et al., 2016, 2018). The major objective of these cruises is to survey oceanographic conditions, focusing on the extent and severity of ocean acidification and hypoxia in the California Current System (CCS), in tandem with biological sampling aimed at developing indicators of ecosystem ocean acidification impacts and assessing the status of known sensitive species. Once the ship time schedule is available, the timing and exact locations of stations to be sampled are fine-tuned to optimize the scientists’ ability to sample the targeted conditions and ecological communities. J-SCOPE seasonal forecasts provide information about the expected onset timing, extent, and severity of hypoxic and corrosive (Ωar<1) conditions that occur annually in hotspots within the northern CCS (Hales et al., 2006; Chan et al., 2008; Connolly et al., 2010; Siedlecki et al., 2015; Alin et al., 2023, in this issue). Figure 2 shows an example of a forecast in preparation and in advance of the 2016 WCOA cruise. The forecast agrees mostly with the observations made on the shelf, but shows biases in the offshore region. We suspect this is due to the simplistic nature of the simulated phytoplankton reservoir in the model as it only represents one diatom-like phytoplankton group. Diatoms dominate the shelf phytoplankton, but smaller groups of phytoplankton dominate communities over the slope. Consequently, the modeled phytoplankton consume carbon and return it to depth with a different efficiency than is observed in this region of the domain. The result is an aragonite saturation horizon that is too shallow offshore. Cruise observations are also presented. Model output on the potential severity of OA parameters was helpful in designing sampling strategies, while comparison of model results and spatial patterns from WCOA cruise observations suggests mechanistic changes that could further improve the model.
The Importance of Co-design with Managers and End Users
A critical lesson that we learned over the past decade is that the more involved the managers and end users are from the beginning, the more likely they are to use the forecast and associated products. While we experienced this firsthand, it has also been noted nationally and internationally (e.g., Hobday et al., 2011; Iwamoto et al., 2019). This is due in part to the transparency required in the back-and-forth conversations with the end users around the forecast products. For example, we often iterated on how best to show forecast outputs based on end-user conversations, as users may need model output in a particular form that is different from those employed in the ocean sciences. In Figure 3, one of these products from the January-initialized 2023 forecast is depicted with specific modifications per the requests of the managers, including: (1) raw values of bottom oxygen concentrations (in lieu of anomalies that scientific communities request), (2) oxygen values displayed in mg L–1 (rather than µmol kg–1 or ml L–1 used by other communities), (3) clear delineation of the hypoxic boundary (<2 mg L–1), and (4) clear identification of state boundaries and regional assets. Similarly, skill assessment was and should be tailored to the location and assets that the end-users rely upon. This co-development process engendered trust in the tool that is invaluable as we encourage practical use of J-SCOPE products.
Identifying engaged end-user groups requires significant time and relationship-building. Boundary-spanning organizations that have existing long-term relationships with various groups are vital to developing capabilities over funding cycles. For this reason, J-SCOPE partnered with the regional IOOS association, NANOOS, for its service in providing access to end users and for effective dissemination of information. NANOOS has a long history (since 2003) of associating with regional communities and connecting end-user communities with observational and model information and products. NANOOS also hosts the data streams of local assets that diverse end users utilize in real time to support their decisions. Without access to real-time observations, development of trust in new forecast tools is impossible, underscoring the importance of coordinating model development with observational efforts (Capotondi et al., 2019).
In addition to NANOOS, the NWFSC has been a key partner from the beginning. The first proposal for J-SCOPE forecasts included the list of indices and variables identified by the California Current IEA, following suggestions proposed in Levin et al. (2009); many of these variables remain part of our current forecast and can be found on the California Current Indicators tab of the website for each forecast. These needs were clearly identified prior to the onset of forecasting and provided a clear target and motivation for the forecasts. The needs of the IEA have served as the focus for the development of forecast products and skill metrics and have fostered connections to additional organizations interested in marine resource planning.
Finally, state and tribal Dungeness crab fishery managers have been essential to success at all steps of the process. They have prepared J-SCOPE proposals with us, co-designed forecast development experiments, met with us several times a year, coauthored publications, and co-designed several products now available on the web. The managers had clear ideas about decision points that could be informed on this timescale, as the crab fishery is highly seasonal. We continue to work together on one of the indices as our present funding for the collaboration winds down.
One of the main challenges facing the release of prognostic information on the web is the potential disruption to the industry itself, including economic consequences for the fishery and trust in the prognostic tools themselves (Mills et al., 2017). Guided by cautions cited in Hobday et al. (2019) to avoid disruption to the fishery industry, our overarching objective has been to support sustainable fisheries. We have thus focused J-SCOPE’s development on direct delivery of fishery-relevant forecast products to managers, as they have the primary responsibility for maintaining healthy stocks, and on interfacing with fishers and other affected community members.
Measuring the impact of the forecasts can be challenging, and there are lessons we have learned here as well. Over the years, J-SCOPE has produced over 12 peer-reviewed articles, which have been cited many times. In addition, continued inclusion of our forecasts in the State of the Ecosystem reports is an important measure of impact. Local communities and press have written about the forecasts from time to time. Because the information is publicly available on the web without registration, in accordance with FAIR data management principles, there is no way to fully determine who will end up using the information and for what purposes. Nevertheless, web portal visitation statistics show a pattern of seasonal visitation since 2016 when Google analytics became available for the J-SCOPE website; since then, the number of pageviews has totaled over 26,000 (Figure 4). The forecasts themselves receive the largest number of views of all the pages on the website, and individual users are not necessarily local to the region. The nearly 6,000 users of the website come from all over the world (Figure 4). Over 1,000 of those users have returned to the site more than once since 2016. While the highest pageviews occurred in 2020, the largest number of users occurred in 2021, perhaps sparked by a particularly low oxygen event on the outer coast that was highlighted by The Seattle Times.
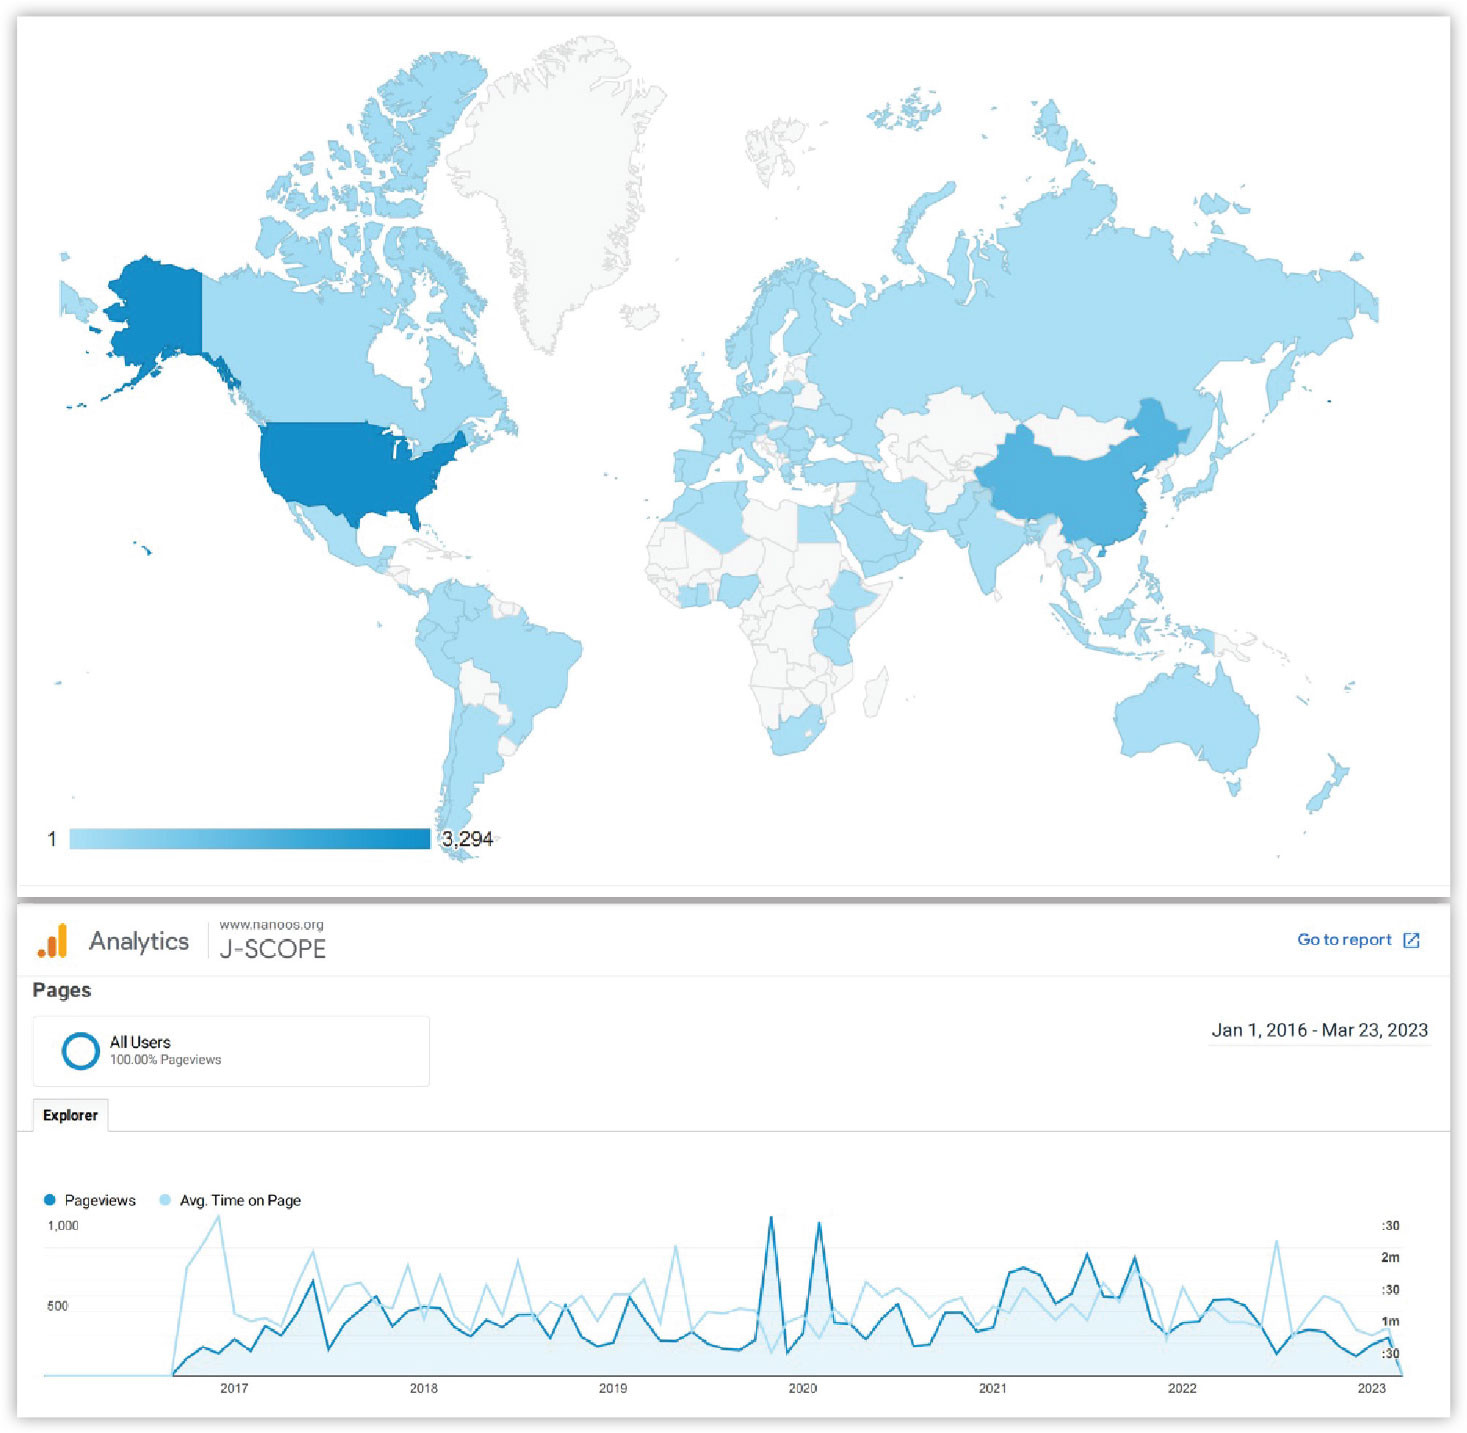
FIGURE 4. Google analytics statistics for the J-SCOPE website hosted on the NANOOS portal from January 1, 2016, to February 1, 2023. The map highlights all the countries from which users originated, and the intensity indicates the magnitude of users who reside there. The time-series plot shows both the number of page views over time for the J-SCOPE website and the average time users spent on the pages. > High res figure
|
Conclusions and Future Recommendations
After 10 years of forecasting, J-SCOPE has achieved successes and identified limitations. We have succeeded in delivering seasonal ocean forecasts to managers in ways that support their decision-making processes. However, this capability was developed over the years by trial and error, with success accomplished only because of iterative interactions with the managers themselves and the coexistence of real-time observations for forecast verification. To date, some of the moored observations that J-SCOPE relies on for forecast evaluation (Olympic Coast National Marine Sanctuary, OCNMS) have not been available in real time. That is expected to change soon as OCNMS mooring data become available in real time. These moorings are equipped for observations of subsurface temperature and oxygen that can be extended to ocean acidification variables through empirical relationships developed by PMEL using high-quality inorganic carbon observations collected on PMEL’s WCOA cruises throughout the region (see Alin et al., 2023, in this issue).
Perhaps the most important contribution we have made over the last 10 years is highlighting the potential global applicability of this kind of seasonal to interannual forecasting. As Hobday et al. (2016) pointed out, these forecasts can be gateways for engaging communities interested in integrating climate information into their decisions. Notably, the same managers involved in co-developing the products on this seasonal timescale are also involved in climate adaptation tool development through regional vulnerability assessments (see Berger et al., 2021; Alin et al., 2023, in this issue) and in new projects focused on localized climate information and longer timescales. Both projects are centered around decadal to centennial planning using local climate information. Conducting seasonal to interannual model forecasts, and in particular employing the insights gained through validation efforts, provides an effective way to improve our models and applied model products. Further experimentation with co-design of forecast and decision-support tools is critical in order to explore and innovate new products that inform flexible management responses, and it can be useful to coastal communities as they grapple with rapidly changing ocean and climate conditions.

Ćháʔba· mooring with NOAA Ship Ronald H. Brown in the background. Photo credit: Richard A. Feely, NOAA. > High res figure
|
Acknowledgments
Computations were done on the University of Washington Hyak supercomputer system, supported in part by the University of Washington eScience Institute. We thank Dana Greeley for aid with visualizations, and Troy Tanner for helping design the website and working with us to understand the Google Analytics information. We thank our other collaborators over the years for their contributions to developing this product, including Isaac Kaplan, Michael Malick, Mary Hunsicker, Sulagna Ray, Felipe Soares, Kelly Corbett, Daniel Ayres, Ervin Joe Schumacker, Michael Alexander, Gaelle Hervieux, Greg Williams, Nina Bednaršek, Jennifer Fisher, and Cheryl Morgan. The NOAA Ocean Acidification Program, Modeling Analysis Predictions and Projections (MAPP), and NWFSC provided funding, and some of this work was leveraged from the US IOOS award to NANOOS. SRA and RAF thank PMEL and the NOAA Ocean Acidification Program for funding their contributions. NOAA WCOA data are available from NCEI (https://www.ncei.noaa.gov/access/ocean-carbon-acidification-data-system/oceans/Coastal/WCOA.html). This is PMEL contribution number 5500.