Full Text
|
|
The NOAA Pacific Marine Environmental Laboratory (PMEL) carbon program has made sustained investments over the last two decades in equipment development, autonomous sampling, and virtual support that undergird the global carbon observing infrastructure. As a result, the program plays an integral role in supporting ocean carbon research with collaborating institutions worldwide (Sutton and Sabine, 2023, in this issue).
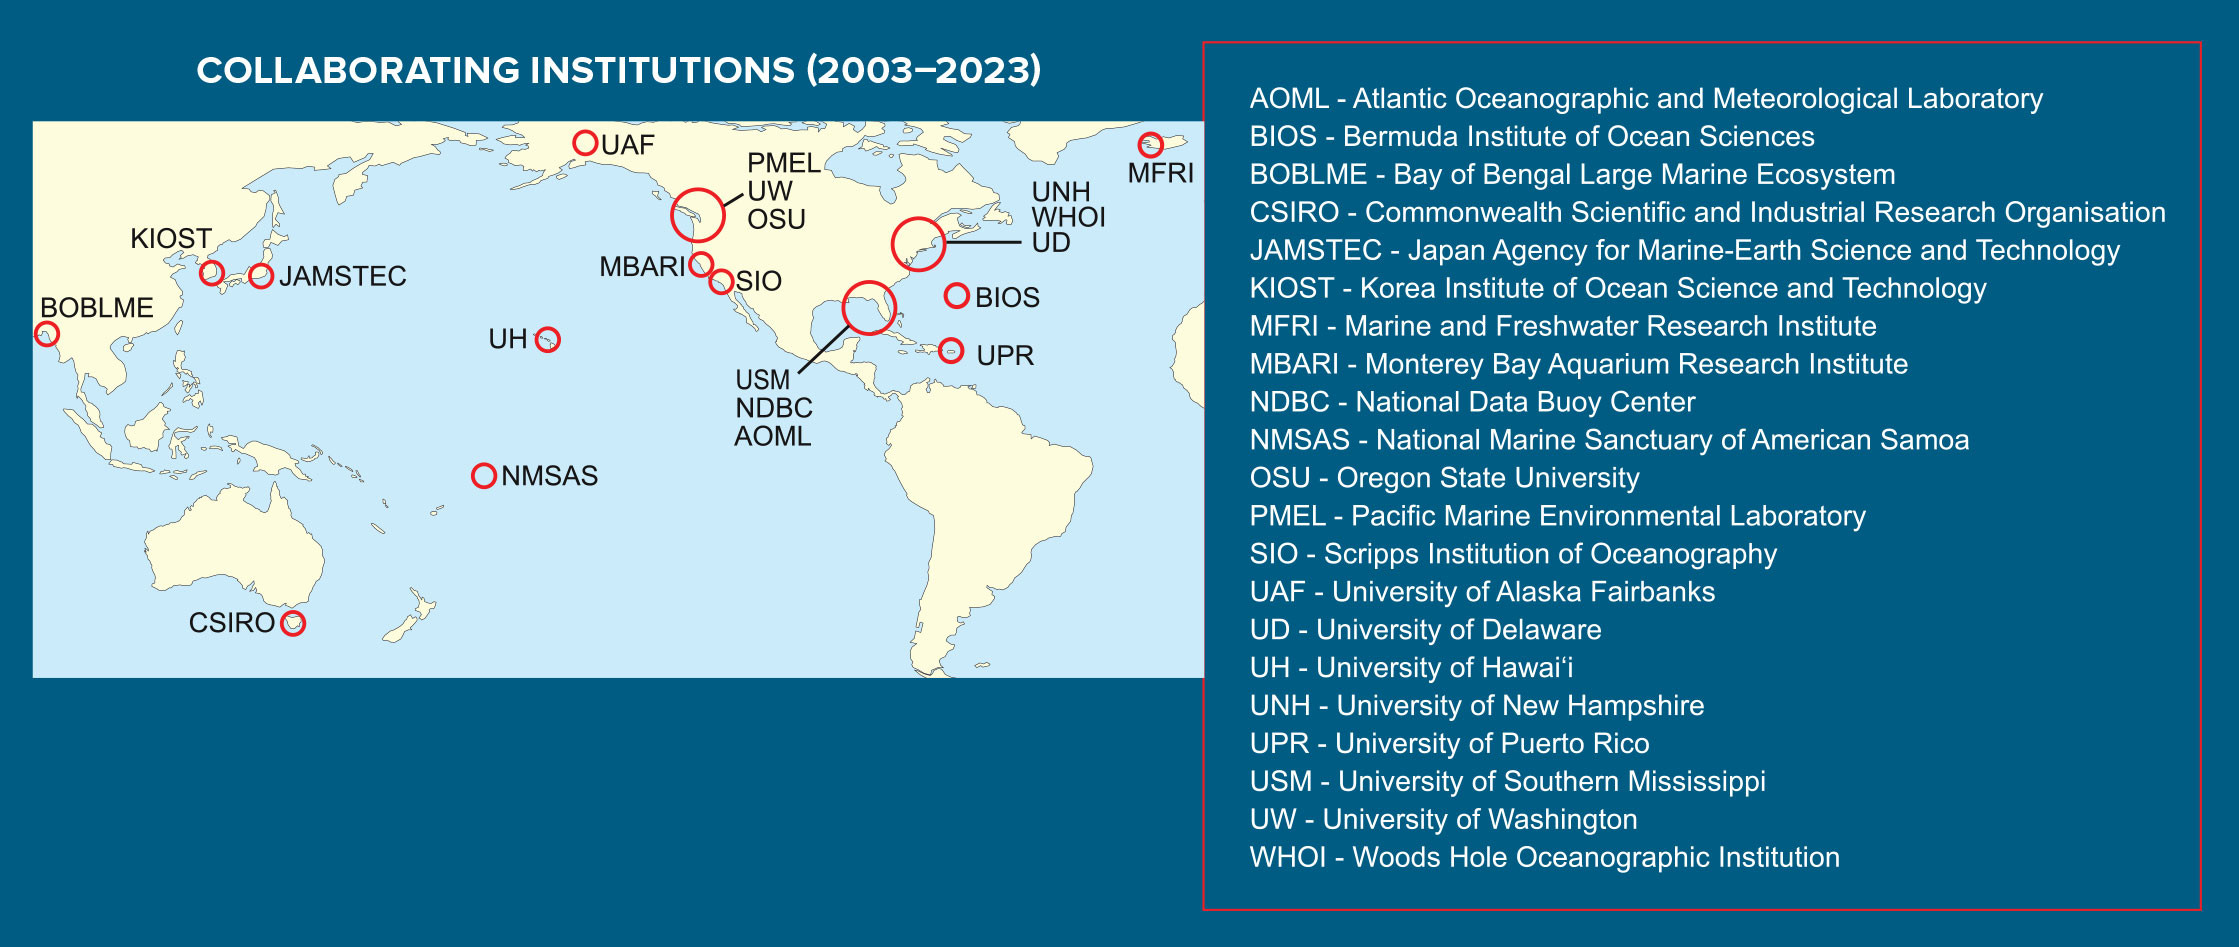
Here, we discuss the field support and data product strategies we developed to build a successful moored autonomous air-sea CO2 and ocean acidification program that relies on moored buoys maintained by other collaborators. The most critical component of our program is partnering with other agencies, universities, and oceanographic institutions. Sharing resources and results allows scientists to collaborate on global climate issues at an international level. We provide instrument refurbishments, real-time (remote) troubleshooting, data handling and dissemination, and centralized coordination. Our partners provide ship and personnel-based resources for deployment/recovery of moorings as well as in-person troubleshooting. No one institution can provide all the physical support necessary for a global array of buoys, but many hands make light work when the effort is dispersed among multiple partnerships. To date, we have partnered with over 100 individuals from more than 20 US and global institutions (Figure 1) in support of nearly 50 autonomous air-sea CO2 and ocean acidification sites since 2003.
|
|
Our program continually revises our standard operating procedures to incorporate new strategies learned from experience. Key successful strategies include investing time and providing in-person training when establishing a new site or partnership. Recognizing that many of our partners are already overburdened with managing their equipment, we engineered the Moored Autonomous pCO2 (MAPCO2) technology to be as close to plug-and-play as possible (Sutton et al., 2014). The MAPCO2 can be controlled remotely (turned on, sampling frequency changed, etc.), which allows PMEL to verify that our equipment is functioning properly before our collaborator’s deployment ship leaves a location and shifts much of the workload back to PMEL. Our large equipment pool allows us to send a full suite of spare sensors for open ocean deployments and provide mid-deployment replacements (where accessible) for failed sensors, helping to ensure near-continuous high-quality time series from our sites.
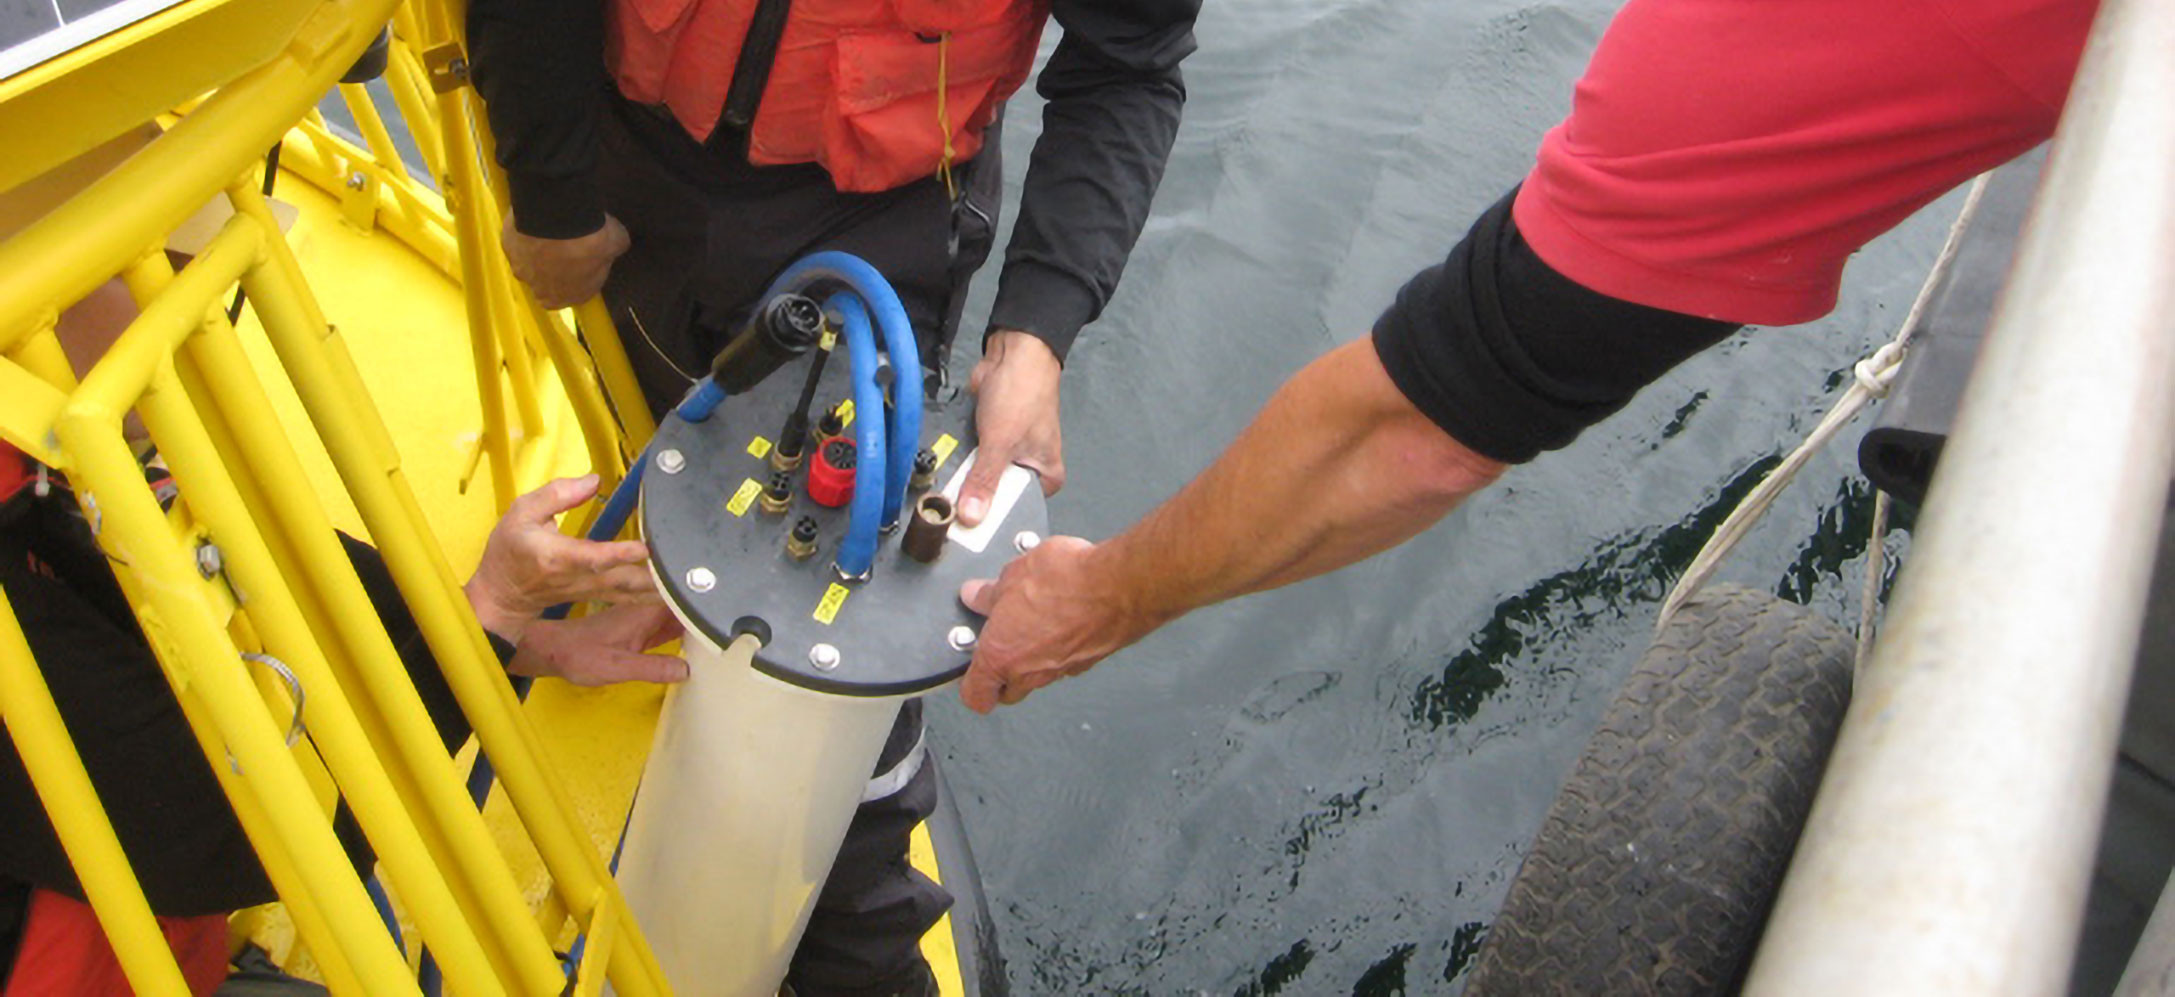
Support in the oceanographic world requires utilizing satellite, cell, and internet technology in order to be virtually available to our partners in the field anytime, day or night, even on holidays. We provide detailed manuals, quick-start guides, and gear shipments that are well organized and clearly labeled. We recognize that our partners often work on a moving platform (sometimes a violently moving buoy), and small parts get dropped into the ocean. Sending spare hardware not only saves headaches but can save a year-long deployment.
We provide a central hub for data quality control and data access. During a deployment, we monitor incoming data and communicate regularly with our partners if any issues arise. Partners can access our near-real-time data through our secure portal so they may make additional assessments.
Post-deployment data from recovered instruments undergo rigorous QA/QC analysis and validation prior to archiving (Sutton et al., 2014, 2016). PMEL has quality-controlled and released over 1.7 million air-sea xCO2 measurements collected since 2004. Additionally, we report co-located measurements of sea surface temperature, salinity, seawater pH, and biogeochemical parameters (dissolved oxygen, chlorophyll, and turbidity) at select sites. These publicly accessible data are used by multiple stakeholders and support aquaculture, research, education, marine resource management, and public outreach. Interested parties can access data through multiple pathways (described below), including the Surface Ocean Carbon Atlas (SOCAT) and the National Centers for Environmental Information (NCEI).
Access to all data products and near-real-time data visualizations, including interactive time-series plots of air and seawater CO2, pH, and climatological monthly mean plots of aragonite saturation state, are available for each mooring at our website (https://pmel.noaa.gov/co2/story/Buoys+and+Autonomous+Systems). The site also provides open access to standardized, high-quality surface ocean carbon time series data organized by buoy location in a human-readable format, as described in Sutton et al. (2019). We provide several other data products and services that include the following.
- Near-real-time data are shared with partners for visualization in other data portals as part of the US Integrated Ocean Observing System (IOOS), including Alaska, Pacific Northwest, and Mid-Atlantic regions (AOOS, PacIOOS, NANOOS, and MARACOOS).
- PMEL’s Ocean Carbon Data Portal (https://pmel.noaa.gov/co2/story/CO2+Data+Discovery) uses intuitive search filters by platform, time, location, and carbon parameters to provide one-click access to background information, archived data, and metadata at NCEI.
- Gridded and synthesis files in a variety of formats are available through SOCAT (Bakker et al., 2016). The combination of SOCAT data with data from other moored and ship-based observing platforms helps to provide a comprehensive understanding of surface ocean carbon at regional and global scales.
The collaborative ocean carbon observatory presented here provides a consistent framework from pre-deployment planning to quality-controlled data delivery and supports critical research for investigating the changing ocean carbon cycle. This unique model was novel when we first tried it, but it has been very successful, and its success makes it an ideal testbed for maintaining and integrating new biogeochemical sensors and platforms moving forward.