Full Text
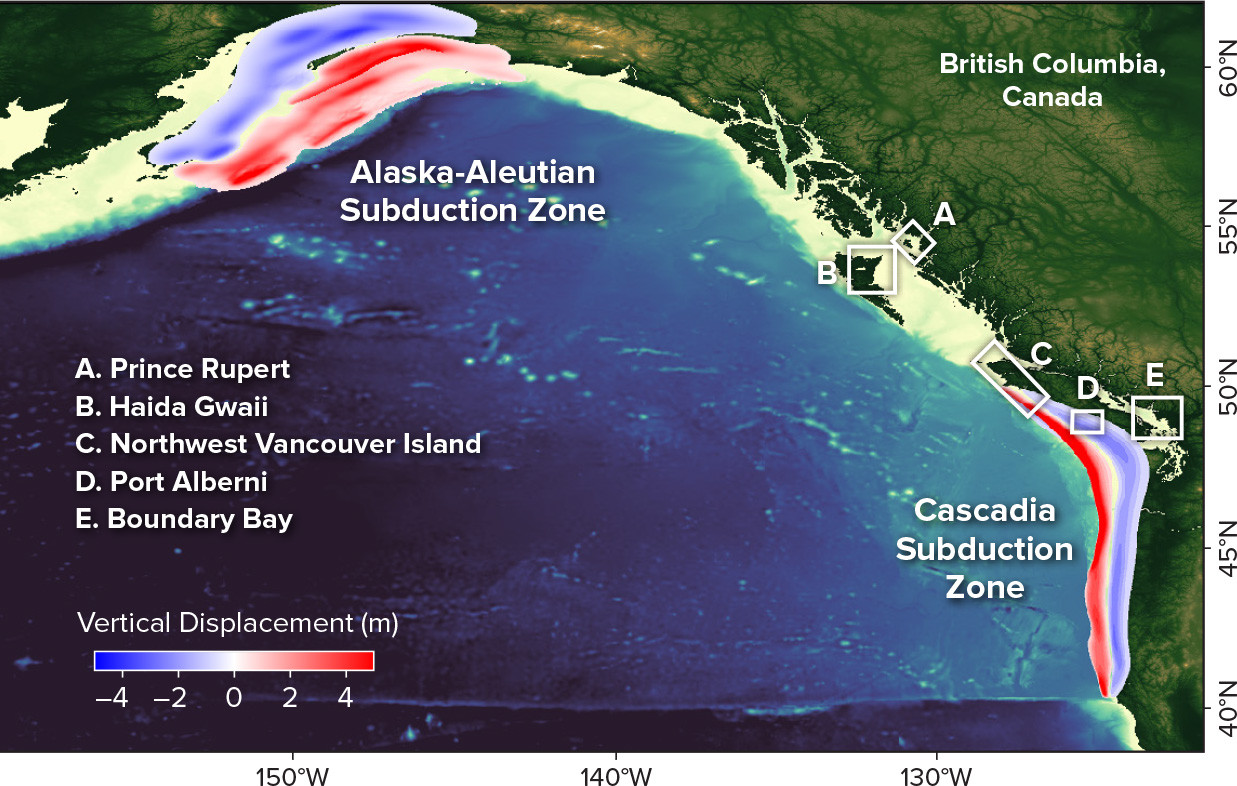
Recent major tsunamis have demonstrated their potential for widespread destruction and associated danger to human populations. Tsunamis generated from local and distant sources in the Pacific Ocean have impacted the western coast of Canada over time, and destructive tsunamis are expected to affect west coast communities in the future. Ocean Networks Canada (ONC) has undertaken several collaborative tsunami hazard assessment projects along the west coast of Canada (Figure 1) with the goals of (1) identifying and assessing tsunami hazards and risks using tsunami modeling, mapping, community engagement, and Indigenous knowledge; and (2) raising public awareness by producing a documentary film, offering educational programs to K–12 students, and developing tsunami signage and online story maps. This article focuses on tsunami hazard identification through modeling and drawing upon Indigenous knowledge.
|
|
Modeling Methodology
Modeling the generation and propagation of tsunami waves requires three essential elements: (1) ocean floor (bathymetry) and land (topography) elevation data, (2) seismic source data from local and distant earthquakes, and (3) a suitable numerical model.
Multiple bathymetric and topographic data sets were integrated to develop the high-resolution digital elevation models (DEMs) required for tsunami modeling, including lidar and single beam and multibeam bathymetric data. For the local tsunami source, the Cascadia subduction zone, Natural Resources Canada (NRCan) provided a recent rupture model corresponding to a magnitude 9 earthquake (Gao et al., 2018). This source resembles great megathrust earthquakes that occur roughly once every 300–500 years in this region, with the latest in 1700. While there is no written record of the impact of this earthquake along the eastern Pacific, it has been recorded in oral history as well as in the coastal and offshore stratigraphy from northern California to Vancouver Island. The distant tsunami source, the Alaska-Aleutian subduction zone, was the origin site for numerous significant earthquakes of magnitude 8 and more in the twentieth century. The largest of recent earthquakes, the 1964 Alaska earthquake, produced the largest instrumentally recorded tsunami waves to date on the British Columbia coast; this event provides a realistic proxy for similar large events that may be generated by the Alaska-Aleutian subduction zone. The numerical simulation of the 1964 tsunami in Figure 1 was based on recent earthquake information acquired from the University of Alaska Fairbanks (Suleimani and Freymueller, 2020).
We modeled the propagation and inundation of tsunamis induced by seismic events using FUNWAVE-TVD (Shi et al., 2012). The first step was to set up a series of nested grids to enable the model to resolve the complex physics as a tsunami propagates from the deep ocean into shoaling coastal regions. The nested grids increase resolution from the outer grid (2 arc-minutes) to the inner grid (~10 m). The wave elevations and horizontal water velocities are transferred from the coarser resolution to finer resolution grids at the model boundaries. Several parameters were also adjusted in the model based on the geographic location of each study area.
The next step was to establish tsunami model scenarios based on current-day sea level and projected future sea level rise (SLR). Recently, James et al. (2021) studied several averaged and enhanced SLR scenarios for the water bodies surrounding Canada, based on different pathways of greenhouse gas emissions through the twenty-first century. The worst-case scenario for 2100 predicts a maximum of up to 1.5 m of SLR for the Enhance Scenario at 2100 along British Columbia coasts. For our tsunami simulations, we lowered the underlying DEM by the local projected SLR value as a way to account for SLR.
Community and Indigenous Engagement
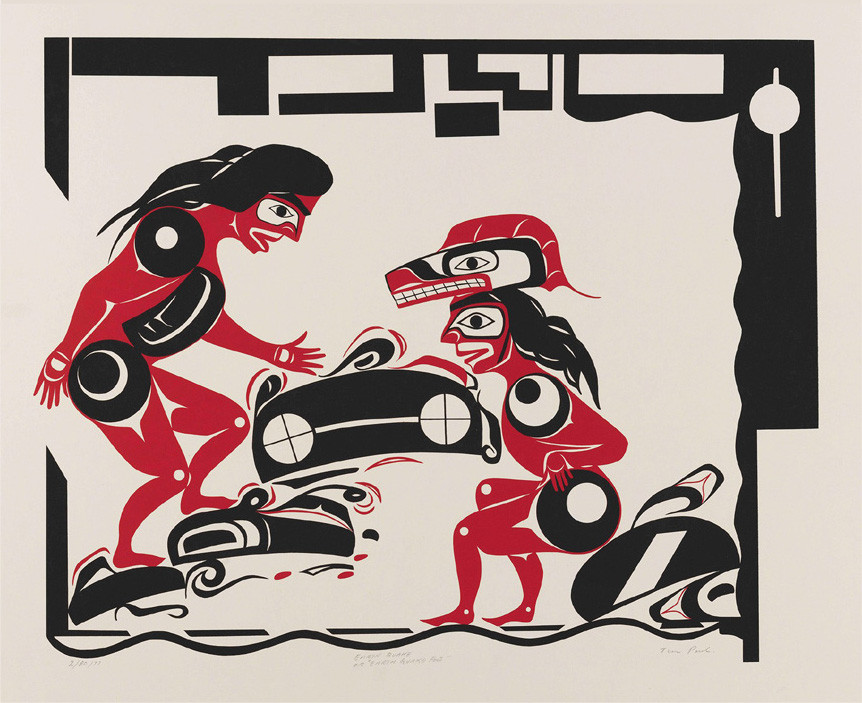
Indigenous communities living where tsunami risk is high have fostered disaster resilience for millennia. Highlighting the knowledge and experience of the Indigenous community is critical for understanding current and future risks and implementing mitigation plans. Using a framework of “two-eyed seeing,” where different ways of knowing are used simultaneously for the benefit of all, helps to improve the science by learning from community stories. For the Northwest Vancouver Island tsunami risk assessment study, through both research and interviews conducted with Elders and community members, multiple stories, teachings, and oral histories of past tsunamis, including but not limited to the 1700 and 1964 tsunamis, were collected and used to authenticate modeling results (Figure 2).
|
|
Results
The modeling results demonstrate that tsunami waves generated by both local and distant earthquakes would considerably impact British Columbia coastal communities. The impact of the locally generated tsunami is more significant in Boundary Bay, Port Alberni, and Northwest Vancouver Island, while a tsunami originating in Alaska would have greater impacts in Prince Rupert and Haida Gwaii. Tsunami arrival times to the outer coast of Northwest Vancouver Island and Boundary Bay were estimated at about 20 minutes and 3 hours, respectively, after an earthquake in the Cascadia subduction zone. The Alaska tsunami, however, reaches Haida Gwaii and Prince Rupert about 2.5 and 3.5 hours, respectively, after the earthquake occurs.
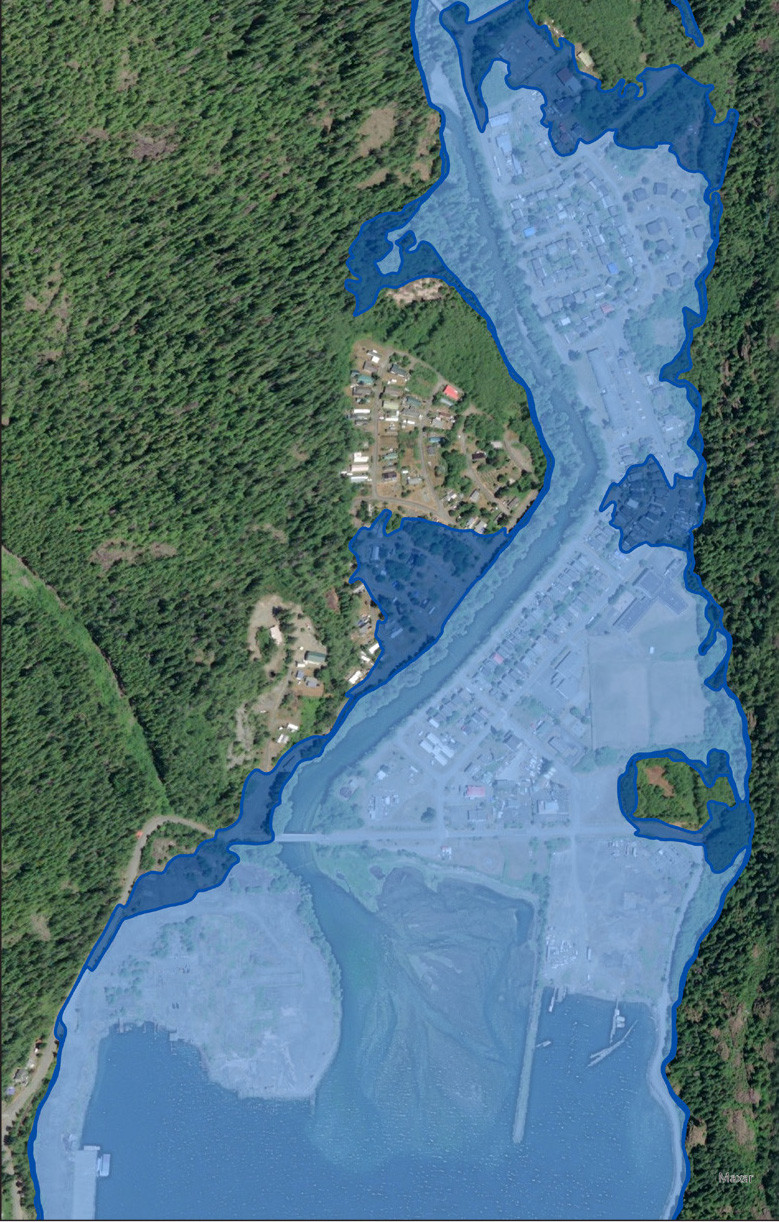
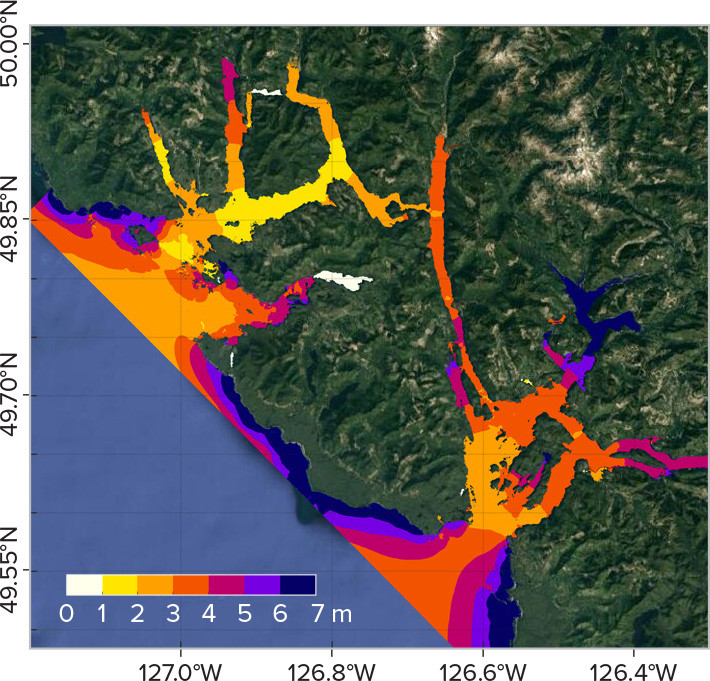
Results also suggest that SLR does not significantly influence the tsunami wave amplitude offshore. However, propagation of these waves over land will lead to a greater extent of flooding as a result of SLR. Several overwater hazard graphics (Figure 3) and inundation maps (Figure 4) were created to represent the tsunami hazard information in each study area, including the tsunami wave amplitudes, current velocities, tsunami arrival times, and extent of flooding.
|
|
|
|