Introduction
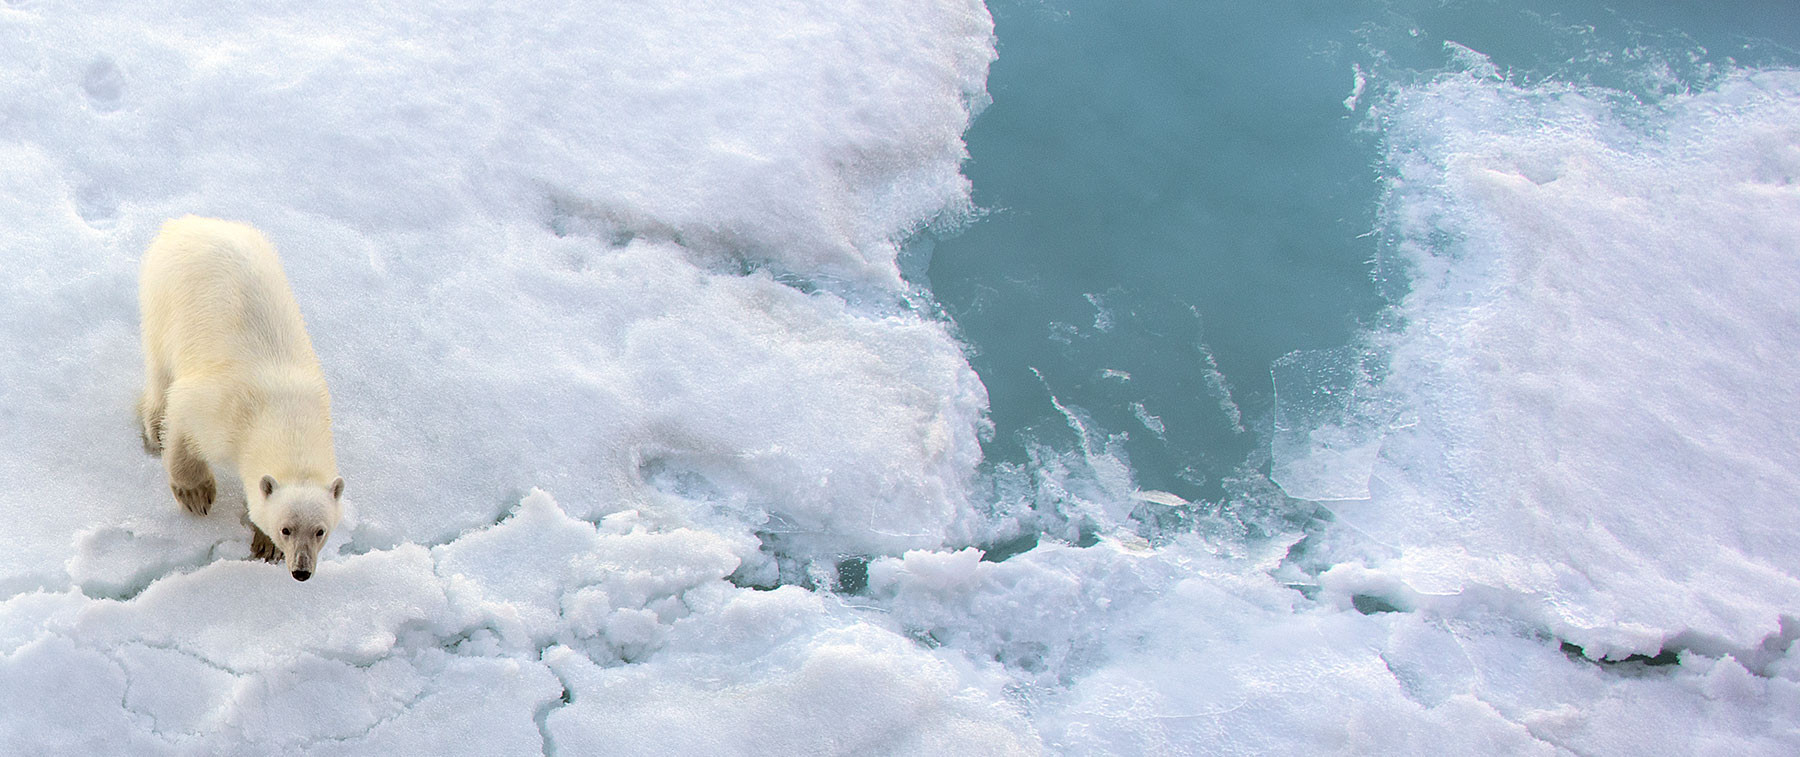
Manabe and Stouffer (1980) predicted that the impact of global warming would be greater in the Arctic than in the midlatitudes. More than 40 years later, observational data confirm their finding: in recent decades, the Arctic has warmed at two to four times the rate of the global mean at the surface, depending on the metrics and data sets used. Other changes observed in the Arctic include the rapid decline of sea-ice cover and thickness, thawing of permafrost, reduction of snow cover duration and extent in both Eurasia and North America, and mass losses from the Greenland ice sheet and Canadian Arctic glaciers (Kattsov et al., 2010; Jeffries et al., 2013; Overland et al., 2019). Sea ice is integral to the rich and diverse Arctic marine ecosystem, which supports large numbers of fishes, migratory birds, and marine mammals, as well as the people who live and work in high northern latitudes. Thus, the recent rapid loss of sea ice has biological consequences in high latitudes, and it also impacts the midlatitudes through sea level rise and jet stream modifications. Permanent shifts in high-latitude ecosystems, including the Arctic marine ecosystem, are attributed to the loss of sea ice, a warming ocean, and ocean acidification, all of which provide added complexity to the geophysics of high latitudes. Unprecedented extreme events include a heatwave in Siberia in 2020 that resulted in unusually high temperatures, such as a record-breaking 38°C in the town of Verhojansk on June 20, 2020 (Ciavarella et al., 2021; Overland and Wang, 2021), and Typhoon Merbok that dramatically shaped 2022 conditions in the Bering Sea region with hurricane-force winds, 15 m waves, and a storm surge that impacted coastal and river communities along more than 1,600 km of coastline (Druckenmiller et al., 2022).
Researchers at the NOAA Pacific Marine Environmental Laboratory (PMEL) have been leaders in predicting a seasonally ice-free future Arctic, the increased global connectivity that will result from a warmer Arctic, and the uncertainties in magnitude and timing of these events. This work supports NOAA’s Climate and Service missions. Here, we briefly review the wide range of Arctic research to which PMEL scientists have contributed.
Key Findings and Impacts
Pan-Arctic Changes from the Past to the Future
Changes in the Arctic, as in other regions, are a combination of natural (or internal) variability and external forcing due to human activity. For instance, results based on observational records of 59 land stations around the Arctic reveal that an early twentieth century warming event was due more to internal variability of the ocean-atmosphere system than to human-induced external forcing. This contrasts with a late twentieth century warming that was pan-Arctic and beyond the historical internal variability of the system (Overland et al., 2004). Wang et al. (2007) showed similar results through model assessment—the upward temperature trend during the last two decades of the twentieth century resulted from both internal variability and external forcing due to increased concentrations of greenhouse gases in the atmosphere (Figure 1a). When using observational data to constrain the models, only a few models met the requirement that the model-simulated surface air temperature over the Arctic land region must be within two-thirds of the observed value in historical runs. Figure 1b shows the ensembles of pre-industrial control simulations from this subgroup of models. It is clear that no comparable trend was found around the end of the century in the model control simulations when no external greenhouse forcings were added (Wang et al., 2007).
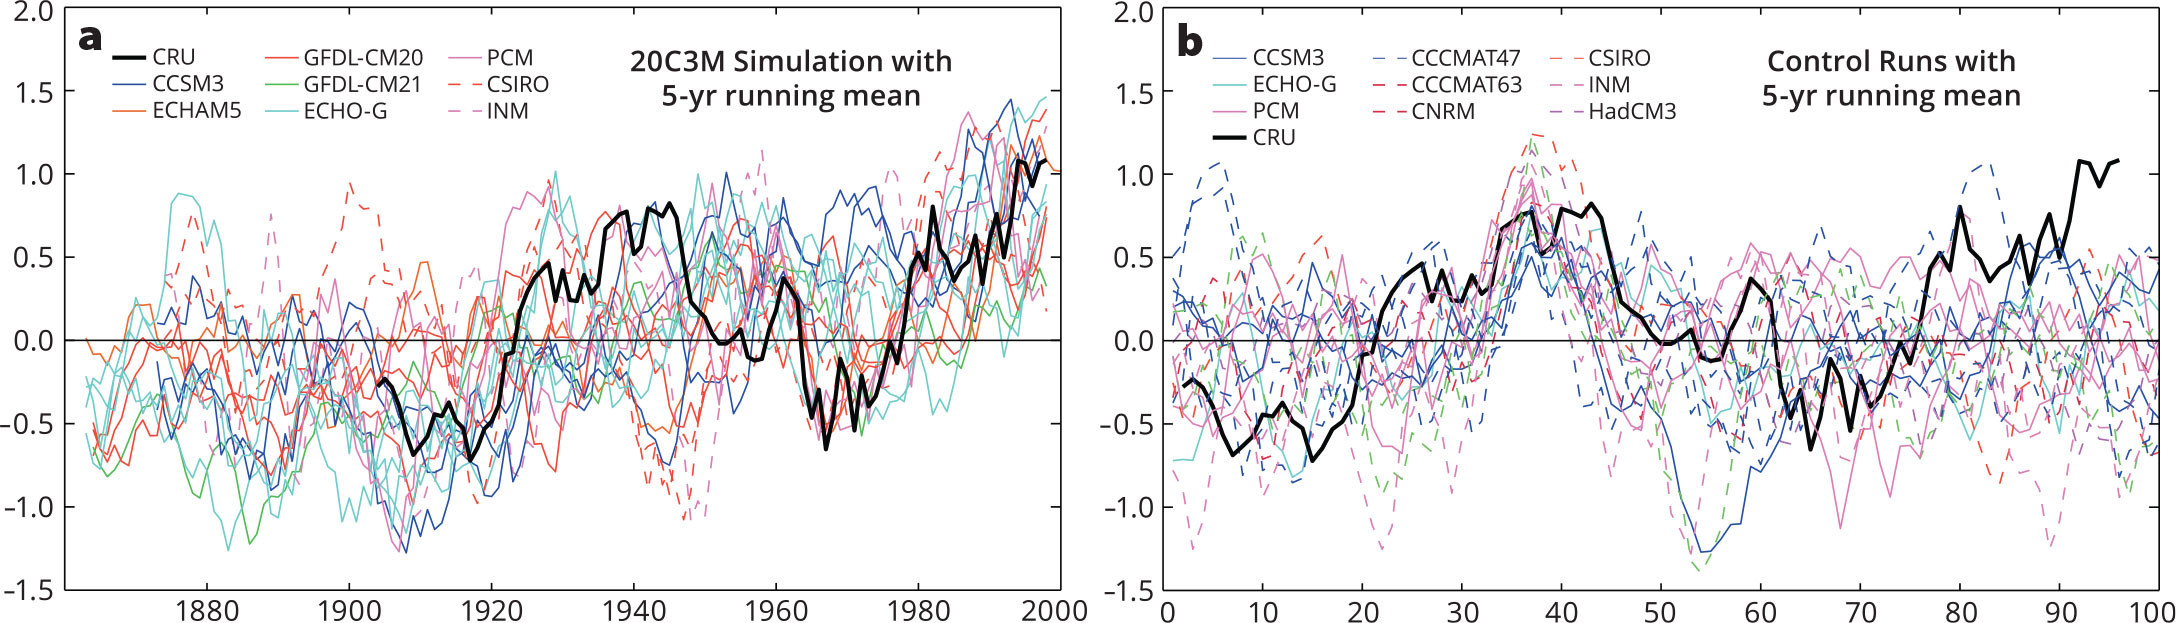
FIGURE 1. (a) Winter surface air temperature anomalies averaged over the Arctic land area based on model ensemble runs that passed the proposed two-thirds thresholds in their 20th Century Climate in Coupled Models (20C3M) simulations. (b) The truncated 100-year-long time series from control runs (with no external forcing applied) of the nine models. All the time series are smoothed with a five-year running mean (adapted from Wang et al., 2007). Thick black lines (CRU = Climatic Research Units) in (a) and (b) are based on observational data (https://crudata.uea.ac.uk/cru/data//temperature/#datdow). > High res figure
|
Increasing temperatures are accompanied by declining Arctic sea-ice cover, thickness, and duration. Through model evaluation and considering the current state of the Arctic, Wang and Overland (2009) produced the first published prediction of an ice-free summer in the Arctic, which they argued could happen by 2040. An ice-free Arctic was defined as sea-ice extent (the area of all grid boxes with sea-ice concentration at least 15%) ≤106 km2. This marked the first time that future projections were based on a subgroup of selected climate models after careful model evaluation using observational data as a constraint. The idea of individual model evaluation and selection was gradually accepted by the climate community. As summarized in the Fifth Assessment Report (AR5) published by the Intergovernmental Panel on Climate Change (IPCC), “Arctic sea ice provides an example where process-based constraints can be used to reduce the spread of model projections” (Overland et al., 2011; Collins et al., 2013). Interestingly, model projections of sea-ice decline at the regional scale appear to be slower than what occurs in the real world, as indicated by the minimum sea-ice extent in 2018 and 2019 in the Bering Sea (Thoman et al., 2020).
An ice-free summer Arctic continues to be projected for the middle of the twenty-first century in subsequent model comparison projects, including the Coupled Model Intercomparison Project phases 5 (CMIP5) and 6 (CMIP6; Figure 2c; Wang and Overland, 2012; AMAP, 2021). These projections are the basis for the Arctic Monitoring and Assessment Programme (AMAP) report used by international leaders of the Arctic Council (AMAP, 2017, 2021). It is also predicted that the Arctic will continue to warm at a pace that is faster than the global mean (Figure 2a,b). This enhanced rate of change is termed “Arctic amplification.” Warming is occurring year-round, with the largest warming at the Arctic atmosphere surface occurring in winter (AMAP, 2021).
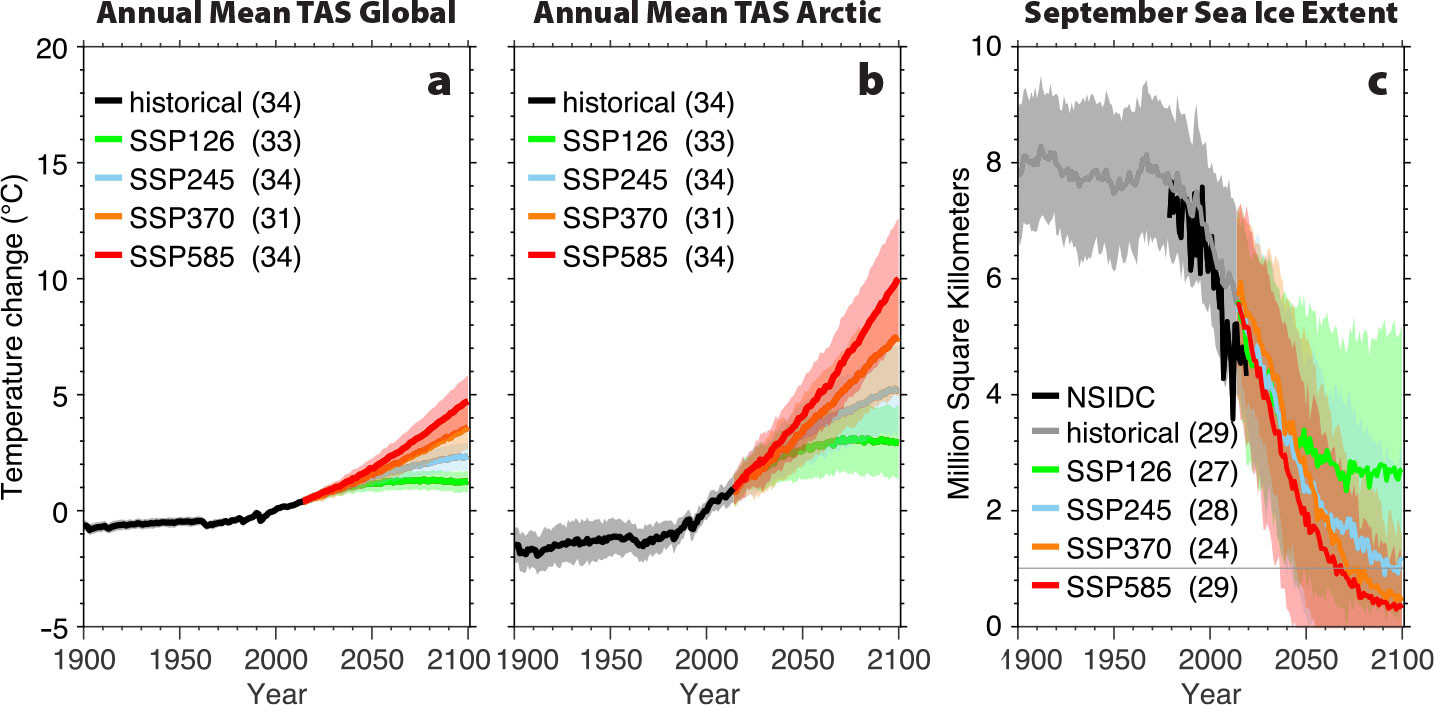
FIGURE 2. CMIP6 model simulated annual mean air temperature at surface (TAS) anomalies for (a) global mean, and (b) Arctic mean (60°–90°N). (c) September sea ice extent simulated by CMIP6 models. The shading indicates the model spread, and thick colored lines indicate the ensemble mean under each scenario. The horizontal gray line in (c) indicates the ice-free Arctic threshold (106 km2). The thick black lines in panels a and b trace the ensemble mean of models, and in panel c, that line is based on observational data from the National Snow and Ice Data Center. Four emission scenarios (SSP1-2.6, 2-4.5, 3-7.0, and 5-8.5) were analyzed. The numbers in parentheses indicate the number of models included in the ensemble mean. > High res figure
|
Sea Ice: Regional Changes and Impacts on Ecosystems
Starting in the early 1980s, PMEL scientists voiced major concerns about the impacts that climate change will have on the Bering Sea ecosystem (e.g., weather and fisheries). Early studies focused on sea ice, because it plays a dominant role in structuring Arctic marine ecosystems. At the time, conventional wisdom was that sea ice advanced by freezing at the ice edge. A major advance was the development of the conveyor belt hypothesis that states that ice freezes in the north and is wind-advected to the south, where it melts at the ice edge, thus cooling and freshening the ocean, and allowing the following ice to reach farther south (Overland and Pease, 1982).
Sea ice impacts the lives of people who live and work in the Arctic in many ways. For instance, vessel icing (the accumulation of frozen sea spray in the subfreezing air temperatures) was and is a major hazard for ships traveling in the Arctic seas. A categorical algorithm developed in the 1980s by PMEL researchers, the NOAA vessel-icing index, depends on three variables: wind speed, air temperature, and sea temperature. This algorithm is still considered relevant and is used today by the National Weather Service (Overland et al., 1986; Mintu and Molyneux, 2022).
Over recent decades, the fastest sea-ice reduction has occurred in the Pacific sector of the Arctic, in the East Siberia, Chukchi, Beaufort, and Bering Seas (Wang and Overland, 2015). Based on daily sea-ice concentration data from satellite retrievals and selected CMIP5 model simulations, Wang et al. (2018) showed that the duration of sea-ice cover has been shrinking since the 1990s, with the strongest trend during 1990–2014. The CMIP5 models further projected a reduction of 20–60 days in annual sea-ice duration in the Pacific Arctic by the mid-twenty-first century (Figure 3a), with a relatively large north-south gradient. The projected prolonged duration of the open-water period is due more to the later freeze-up (Figure 3c) than to early break-up dates (Figure 3b). This rapid change opens a door for longer duration and more frequent shipping activities through the central and Alaskan Arctic.
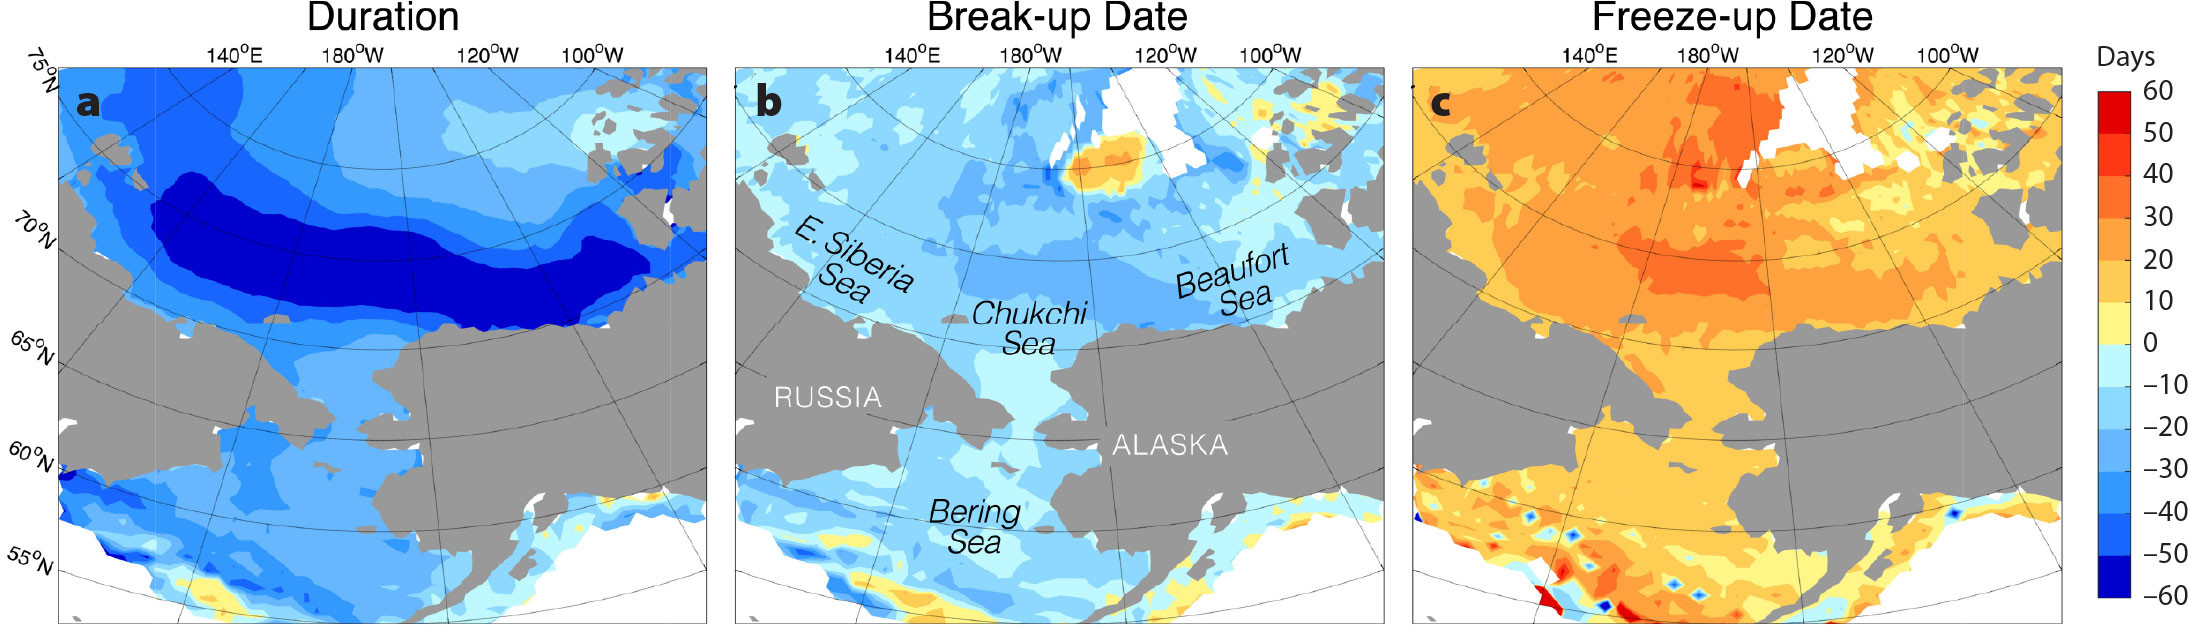
FIGURE 3. Projected changes are plotted for 2030–2044 relative to 1990–2014 in (a) sea-ice duration, (b) break-up date, and (c) freeze-up dates, based on CMIP5 models. Adapted from Wang et al. (2018). > High res figure
|
Arctic Data Rescue, Field Campaign, and Synthesis Efforts
The Arctic is a data sparse region because of its remoteness and harsh, ice-covered environment. However, data gaps can be filled in by digitizing and transcribing information from nineteenth century logbooks to provide a baseline for current Arctic trends. Citizen volunteers and student interns have digitized the logbooks from hundreds of whaling ships, the US Navy, and Revenue cutters (the precursor of the US Coast Guard), extending Arctic ice and meteorological records back to the 1870s. Recovery of weather logs from early exploration of the Canadian Arctic showed that many expedition mishaps resulted from the inability to recognize the large interannual weather and ice variability within the Arctic, on top of the longer-term climate variations such as the cold temperatures from the Little Ice Age of ~1300–1850 CE (Wood and Overland, 2003). Drawings discovered in logbooks illustrate both favorable (Figure 4a) and unfavorable (Figure 4b) ice conditions that explorers encountered in the vicinity of Beechey Island during their expeditions. Analysis of the Arctic-wide data set from the first International Polar Year (IPY) in 1882–1883, whose goal was to expand our knowledge of polar regions and their role in the Earth system (Wood and Overland, 2006), reveals historical large-scale climate patterns similar to today’s, such as the Arctic Oscillation, which represents alternating high-low temperatures between Greenland and northern Europe.
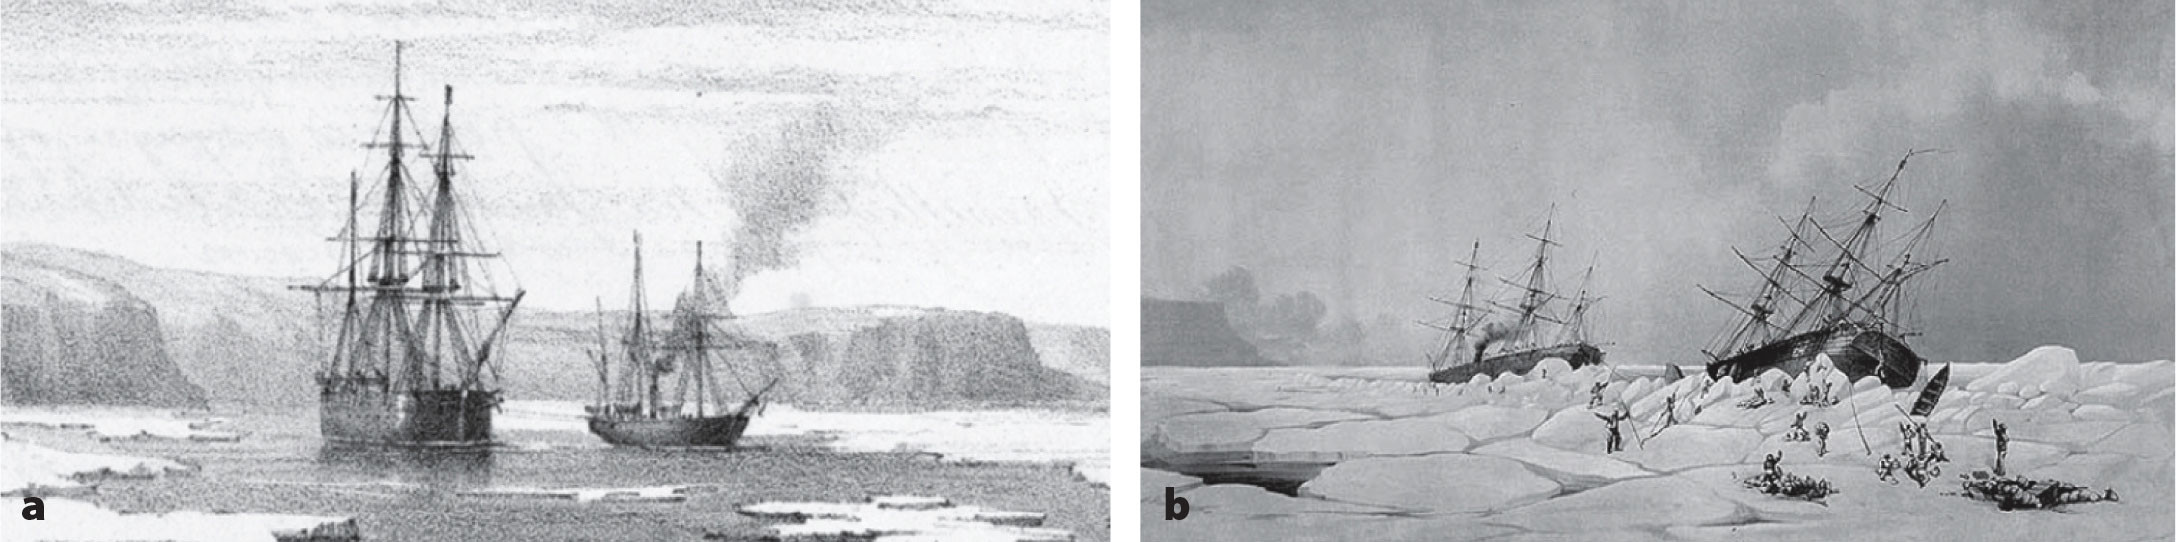
FIGURE 4. The range of ice conditions in the vicinity of Beechey Island is illustrated by images of (a) HMS Resolute and the steam-tender Pioneer on September 5, 1850, and (b) HMS Breadalbane and the steam-tender Phoenix beset in pack ice on August 21, 1853. (a) From Facsimile of the Illustrated Arctic News [microform], from HMS Resolute, London, Ackermann, 1852, and (b) National Archives of Canada, Lithography by E.A. Inglefield, ca. 1855, National Archives of Canada, Accession Number 1989-399-4. > High res figure
|
Early PMEL field research in the central Arctic focused on local physics, including boundary layer structure (Overland, 1985; Overland and Davidson, 1992), turbulent momentum fluxes (Walter and Overland, 1991), and heat fluxes (Overland et al., 2000). Because sea ice is a heterogeneous surface, obtaining regional flux averages was essential. The fluxes were calculated based on NOAA aircraft-derived turbulence measurements and satellite image analyses. These early investigations led to the idea of modeling sea ice as a granular plastic material (McNutt and Overland, 2003).
Through data collected by field campaigns and moorings, gap winds (down-gradient winds forced through gaps in the mountain ranges) in Shelikof Strait and coastal wind jets along the open coast can be quantified based on theory developed at PMEL. The gap winds almost double the speed of offshore winds as they travel in a direction approximately parallel to the axis of the topography (Lackmann and Overland, 1989; Bond and Stabeno, 1998).
Into the twenty-first century, the field campaigns involved flying a NOAA WP-3D Orion in 2013 and 2014, and a NOAA Twin Otter (NOAA-56) beginning in 2016. These flights, equipped with new meteorological instruments and air-deployable autonomous ocean observing systems, carried out combined scientific research and engineering development operations in the field (Wood et al., 2018), which complemented the long-term mooring observations and oceanographic cruises in the Chukchi Sea (Stabeno et al., 2023, in this issue). Present-day data in the Arctic are obtained from shipboard measurements, moorings, and Lagrangian devices (e.g., drifters and floats); land and ice surface stations; airborne instruments; and satellites. Together, they provided a comprehensive picture of the Arctic environment, an insight into the mechanisms of atmosphere-ocean-sea ice interactions, and deeper understandings of the region’s role in the global climate system.
A synthesis report, the Arctic Report Card (ARC), initiated and co-led by PMEL researchers, was first published in 2006 (Richter-Menge et al., 2006). Since then, the ARC has been published annually, and more than 100 scientists around the world have contributed to this effort. The ARC is a timely, peer-reviewed source for clear, reliable, and concise environmental information on the current state of the Arctic relative to historical records (https://www.arctic.noaa.gov/Report-Card). It is intended for a wide audience of scientists, teachers, students, decision-makers, policymakers, and the public. It is considered Influential Scientific Information by NOAA.
The Sea Ice Outlook (SIO) was initiated in 2008 after a national Arctic workshop recommended that multiple contributors should forecast summer sea-ice minimums as a scientific exercise similar to that done for El Niño-Southern Oscillation. Since then, SIO has coordinated a science community-based summer sea-ice extent forecast exercise and publishes the outlook monthly from June to September each year (https://www.arcus.org/sipn/sea-ice-outlook). SIO has been adopted as its key product by the Sea Ice Prediction Network project (SiPN and SiPN2) funded jointly by NOAA, Office of Naval Research, and National Science Foundation. As one of the initiators and key drivers of SIO, PMEL scientists have led and contributed to the SIO report since its inception. Contributions to SIO have increased to include more than 30 groups, including operational forecast groups from modeling centers, individual research groups, and citizen scientists from around the world.
Arctic Extremes and Midlatitude Weather Connections
A major indicator of Arctic change is the occurrence of extreme events (Overland, 2022). Two recent examples are the Siberian heatwave, which brought major wildfires in 2020 (Overland and Wang, 2021), and the collapse of the Arctic atmospheric front north of Alaska, which allowed the northward movement of storm tracks, delay of sea-ice formation, and a resulting ecosystem reorganization (Ballinger and Overland, 2022). Research findings point to the importance of the movement of the lower stratospheric and tropospheric polar vortex away from its historical center over the pole (Overland and Wang, 2019). These findings promote the immediacy of Arctic physical, ecological, and societal impacts as indicators of global change (Overland et al., 2019).
PMEL scientists have long investigated atmospheric patterns in the Arctic and North Pacific as a background for determining the validity of persistent changes and physical and biological regime shifts (Overland and Wang, 2005). We now consider that most climatic time series, such as sea surface temperatures and atmospheric pressure fields, are primarily chaotic, that is, they have a long memory, so there may be some persistence, but they do not exhibit cyclical behavior (Percival et al., 2001; Eriksson et al., 2007). Physical extremes can initiate biological shifts, such as the large variations observed in walleye pollock (Gadus chalcogrammus) stocks in the Bering Sea and the beginning of an ecosystem reorganization in the northern Bering Sea after minimal sea ice in 2018.
Changes in the Arctic are not limited to the Arctic but can affect weather in midlatitudes. One example of this is the Warm Arctic/Cold Continents paradox that is occurring along with global warming (Overland and Wang, 2010). Both modeling and data analysis show that loss of sea ice in the Arctic has often been associated with cold winters over Europe, Asia, and central North America (Deser et al., 2004; Luo et al., 2016). However, any such connection is still being debated, as it does not occur every year. Our conclusions are that midlatitude events are regional and intermittent, and tend to obfuscate Arctic influences (Overland et al., 2021). However, there are solid case studies (Figure 5) of particular events supporting the concept that the position and the strength of the polar jet impacts the cold air outbreaks in winter in North America. Such Arctic-midlatitude connections are often initiated through amplification of meanders in the lower stratospheric polar vortex (Cohen et al., 2020).
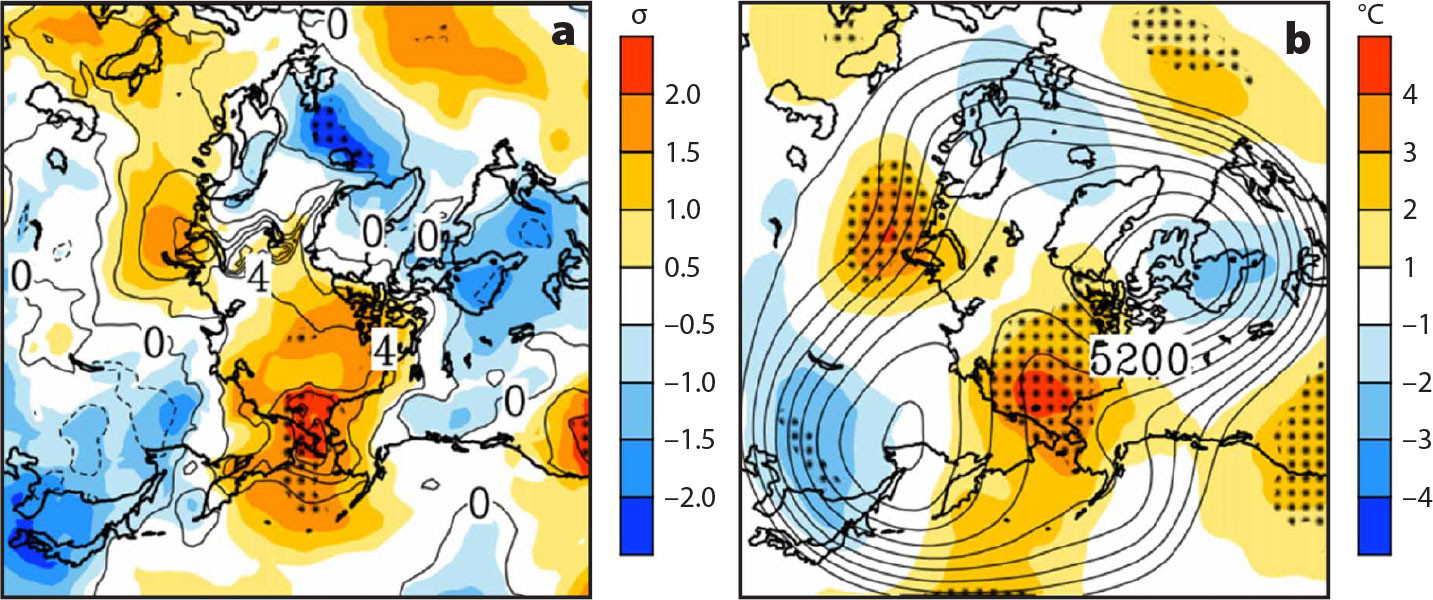
FIGURE 5. Anomalous polar jet meander and cold conditions in Asia and America in winter 2017–2018. (a) Three-month mean air temperature (contour) and standardized temperature anomaly (shaded) at 2 m between November 15, 2017, and February 15, 2018. The contour interval is 1°C. Hatched areas recorded the highest or lowest temperature of the three-month means since 1981. Note warm Alaska and cold eastern United States. (b) As in (a) but for geopotential height (contour) and temperature anomaly (shaded) at 500 hPa showing a ridge over Alaska and a trough over the eastern United States. The unit of height is meters, and the contour interval is 50 m. > High res figure
|
Summary and Challenges Moving Forward
PMEL Arctic researchers have made major contributions to international Arctic research and assessment since the 1980s, with a focus on Alaskan waters. They contributed to NOAA Weather Service and Fisheries products, such as Ecosystem Status Reports and Ecosystem Socioeconomic Profiles, by providing regional indicators that include teleconnection indices, surface air and ocean temperatures, sea-ice analyses and projections, coastal winds, and discussions of ecosystem shifts (see Figure 5 in Mordy et al., 2023, in this issue). Internationally, PMEL researchers have consistently been leaders in evaluating Arctic atmospheric and sea-ice projections based on coupled climate models that form the basis of IPCC and AMAP reports. Arctic/midlatitude weather connections continue to be a topic of major importance to millions of people. We are one of the major voices in promoting the urgency of monitoring Arctic climate change and backing it with peer review publications, presentations, and the annual Arctic Report Card.
Acknowledgments
We wish to acknowledge the many contributions from members of the former Marine Services Division and the Coastal and Arctic Research Division of PMEL, many of whom are listed in the references. We sincerely thank Phyllis Stabeno for her meticulous editing and suggestions during the revision of the manuscript. We appreciate NOAA Global Ocean Monitoring and Observing (GOMO) Arctic Research Program (ARP) (FundRef number: 100018302), Climate Program Office, Office of Naval Research, and National Science Foundation funding support over the years. This research is supported by NOAA Research and partially funded by the Joint Institute for the Study of the Atmosphere and Ocean (JISAO) under NOAA Cooperative Agreement NA15OAR4320063 and by the Cooperative Institute for Climate, Ocean, and Ecosystem Studies (CICOES) under NOAA Cooperative Agreement NA20OAR4320271. This is contribution 2023-1310 to CICOES, and 5490 to PMEL.