
Full Text
Two case studies demonstrate that the application of satellite remote sensing and GIS techniques can inform the development and improvement of fishing policies and fishery management in Kenya and Tanzania. Artisanal coastal fishing communities in both countries still rely on traditional methods to identify fishing grounds. The rudimentary techniques they use are based on conservative hunting methods that rely on recurrent experiences and evidence gathering among fisherfolk. However, multiple environmental factors determine the spatial structure and distribution of pelagic fisheries (Planque et al., 2011), and marine organisms are highly vulnerable to the rapid variations in oceanographic conditions that are being accelerated by global changes. These changes contribute to the broad diversity in species distribution and assemblages in space and time, further complicating fishers’ quests for productive grounds. Biophysical indicators of the sea surface environment such as temperature and chlorophyll concentration may serve as important determinants of the presence of marine life. Physical processes in the upper ocean such as currents, waves, and tides stimulate biological processes that ultimately determine the distribution of pelagic fish (Solanki et al., 2005).
A thorough understanding of key environmental parameters and their influence on pelagic fish distribution can inform exploration for prospective fishing zones. Chlorophyll-a (Chl-a) concentration is a measure of the algae present in seawater and can be used as an indicator of fish production. The microscopic algae form the top of the marine food web and are consumed by zooplankton and small fish, which are then consumed by larger fish. Similarly, sea surface temperature (SST) is a significant physical factor that strongly influences the physiology and growth of ocean life, including phytoplankton and all other organisms at higher trophic levels (Tang et al., 2003), and can be used to help identify fishing grounds.
Collecting measurements of oceanographic parameters from boats over large areas is time consuming and expensive and can be impractical for identifying commercially viable fishing areas due to the dynamic nature of the ocean. Consequently, there is a need for more effective methods that can capture changes instantaneously over broad regions. Satellite sensors can be used to gather information on global ocean SST and Chl-a concentration at relatively high resolutions over broad regions and long time periods. Geographic Information System (GIS) techniques can then be used to integrate satellite images with spatial databases (e.g., Microsoft SQL Server, Oracle, PostgreSQL) and statistical techniques to inform fisheries management.
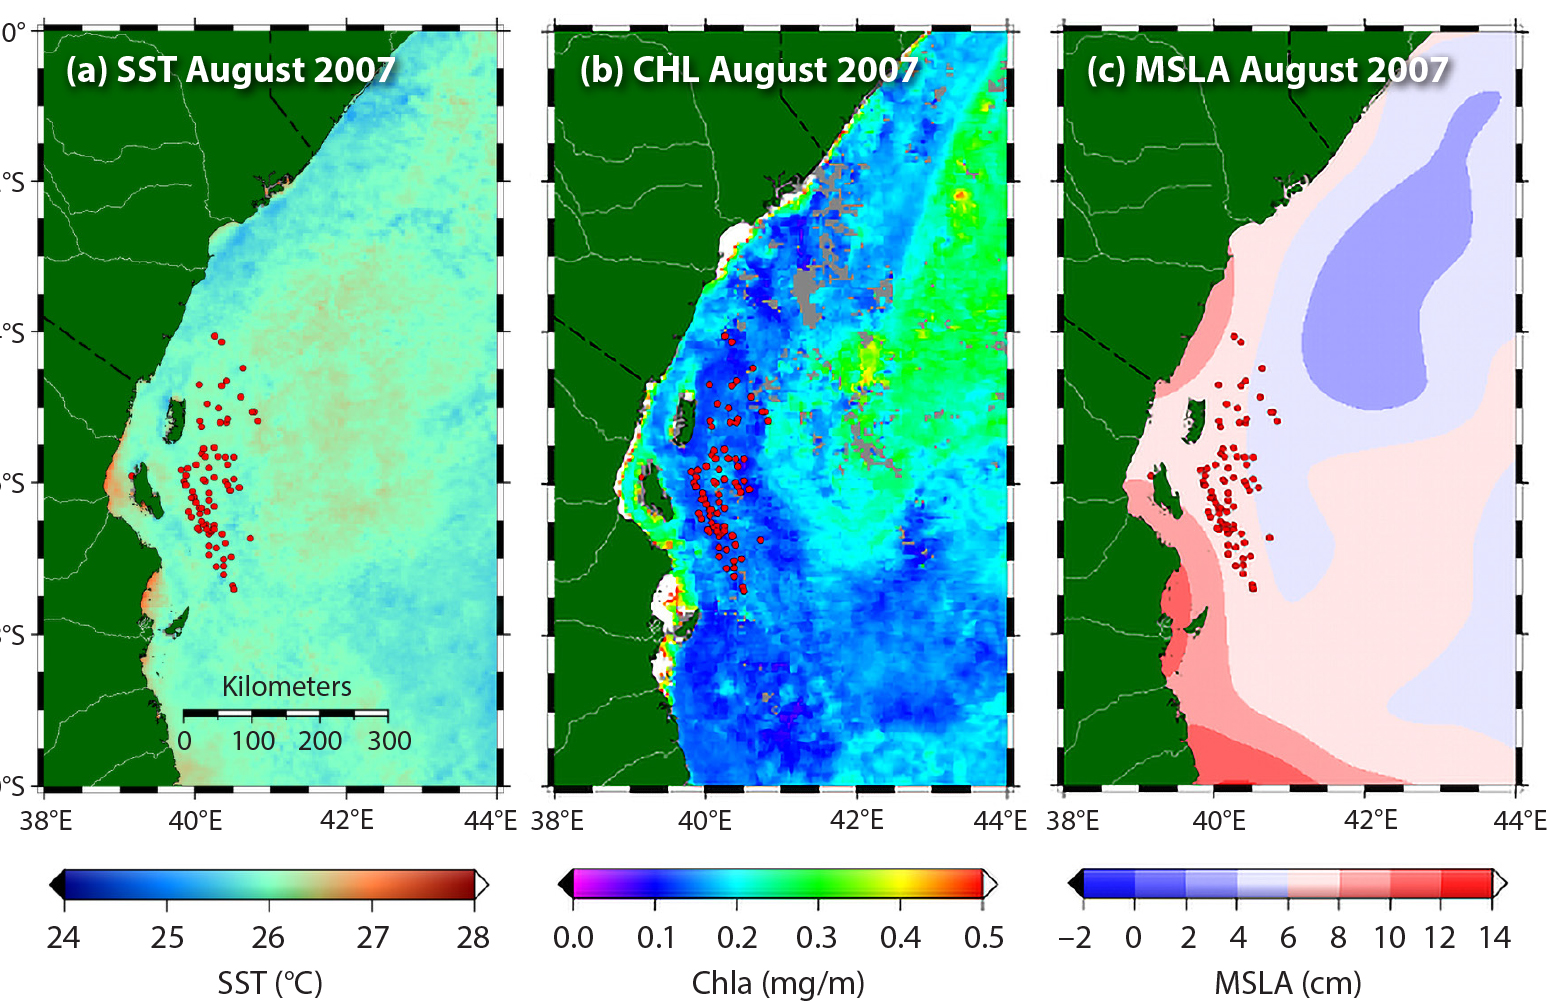
A pilot case study in Kenya involved the discovery of potential yellowfin tuna fishing grounds using satellite data on oceanographic parameters selected based on their relevance as descriptors of tuna habitat. SST, sea surface Chl-a, and mean sea level anomalies obtained from the Advanced Very High Resolution Radiometer (AVHRR), the Sea-viewing Wide Field-of-view Sensor (SeaWiFS), and the Archiving, Validation and Interpretation of Satellite Oceanographic (AVISO) data sets, respectively, were compiled monthly into a database at Kenya Marine and Fisheries Research Institute’s African Monitoring of the Environment for Sustainable Development (e-station).
At the same time, data on yellow fin tuna catches were obtained from artisanal fishers and recreational fishing vessels operating along the Kenyan coast at selected landing sites in Kilifi, Wesa, and Watamu. The captain of each fishing boat was issued a GPS unit and crew members were trained on its use and general maintenance. The fishers were required to switch on their GPS units every time they went out fishing and to record a point each time they caught fish. These data helped to identify the peak fishing season and target areas for fishers. Data from tuna tagging vessels were also used to determine areas where schools of tuna occurred. We obtained these data from the Indian Ocean Tuna Commission (IOTC) for Kenyan and Tanzanian waters during a 2005–2007 tuna tagging exercise. Using GIS techniques, we integrated the satellite data with the fishers’ data and showed that fishing occurred in waters above 25°C where Chl-a concentrations ranged from 0.1 mg/L to 0.2 mg/L (Figure 1). The mean sea level anomaly values indicated that more fishing occurred in waters with positive anomalies.
|
|
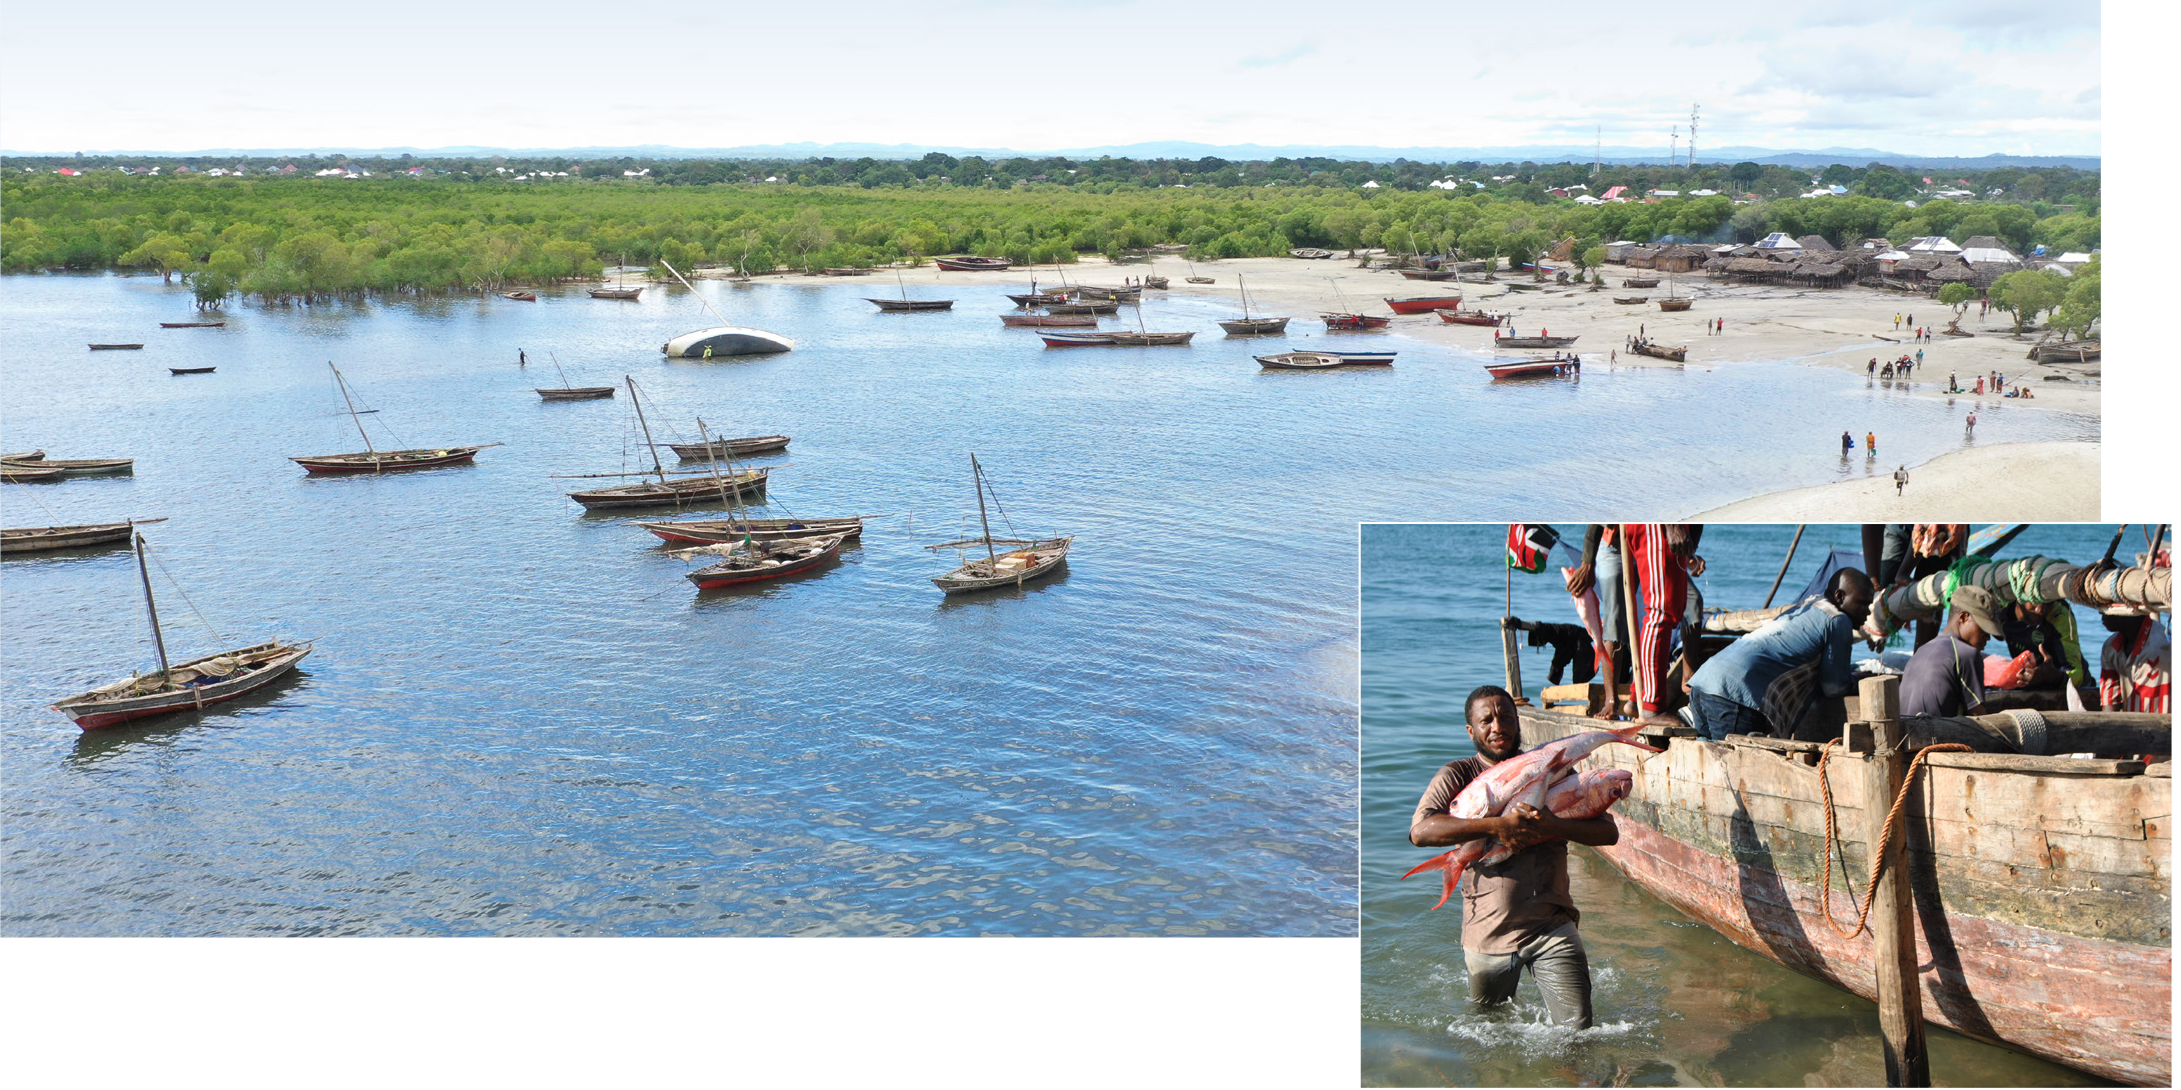
In Tanzania, the latest technology was used to find and delineate fishing grounds to enable profitable and sustainable fishery exploitation. A total of 87 ring net fishers from 14 coastal districts of the Tanzania mainland and Zanzibar were identified, supplied with and trained to use GPS units, and then asked to mark and record the positions of fish occurrence along with catch- and effort-related data (Figure 2). The data were entered into a database (eCAS) through a mobile phone application for a period of one year (January to December 2020) and then analyzed for temporal and spatial variation in fishing effort and catch rates.
|
|
Results showed that ring net fishing catches during the southeast monsoon season were higher (n = 301) compared to the northeast monsoon season (n = 269) and significant (χ2(876) = 34.72, p <0.05) at 95% confidence interval (0.15, 0.35). Although the median catch rate of 28.47 kg/hr during the northeast monsoon season was higher than during the southeast monsoon season (32.24.84 kg/hr), the difference in catch rate was insignificant (U(877) = 0.64, p = 0.47) at 95% confidence interval (–0.05, 0.10). This study provided data that are useful for sustainable fishery management to ensure a vibrant Blue Economy capable of sustaining livelihoods. Importantly, this study contributes baseline information on fishery locations that can be used by managers to measure the “ecological footprint,” that is, human/fishers’ impact on the fishing environment.