Introduction
Optics-based technology has become a powerful monitoring method for marine ecologists and managers (Bicknell et al., 2016). Cameras are relatively noninvasive when compared to other monitoring methods (Chaudoin et al., 2015), and they permit in situ observations of behavior (Bouchet and Meeuwig, 2015; Parnell et al., 2017), diversity (Favaro et al., 2012), and abundance (McLean et al., 2010) of a wide variety of marine animals. Despite recent advancements in underwater housings, image quality, and data storage, low-cost (i.e., <$5,000) optical imaging systems (OISs) are still challenged by power and light limitations (Balazy et al., 2018). Most battery-powered OISs that sample nearly continuously are only capable of a few hours of image or video capture (e.g., Favaro et al., 2012; Mallet and Pelletier, 2014; Wilby et al., 2016). OISs capable of longer deployments are often part of seafloor ocean observatories that are powered from shore (Aguzzi et al., 2011; Vardaro et al., 2013). Additionally, behavioral observations using OISs should be made without artificial lighting, as many fish species exhibit behavior patterns that are regulated by ambient light levels (Potts, 1990), so artificial lighting can alter behavior (Nightingale et al., 2006). However, to capture high-quality images during crepuscular periods, OISs for studies of fish are often equipped with artificial lights (e.g., Harvey et al., 2012; Fitzpatrick et al., 2013; Myers et al., 2016). Others who have not used artificial lighting simply do not record any observations during the hours near sunrise and sunset (Chaudoin et al., 2015).
Studies to monitor fish crepuscular behavior have mostly been conducted in coral reef environments (Potts, 1990), where the abundance of ambient light allows for extended observation periods. However, temperate fish species that inhabit environments such as kelp forests also display light-dependent behaviors (Hobson et al., 1981). The scotopic pigments responsible for low-light vision in many of these temperate fish species cluster about wavelengths that are spectrally similar to ambient light during twilight (Hobson et al., 1981), suggesting increased visual sensitivity during crepuscular periods when the risks and opportunities of predation are greatest (Munz and McFarland, 1973). While the complex three-dimensional habitat of kelp forests provides additional refuge to its inhabitants from visual predators (Schiel and Foster, 2015), it also presents a significant challenge to monitoring animal biodiversity using cameras without artificial light due to the decreased ambient light levels near the seafloor. Changing ocean conditions are threatening kelp forests’ diverse and productive communities (Krumhansl et al., 2016), and many are now safeguarded within marine protected areas (MPAs) to ensure their persistence and resiliency. However, it is challenging and expensive to gauge the efficacy of MPAs utilizing traditional methodology (Pendleton et al., 2018).
Traditional monitoring methods, such as diver surveys, allow species to be identified in situ; yet, these surveys are laborious, expensive, time-limited, weather-dependent, and reliant on a talented pool of divers. Additionally, a diver’s presence can alter animal behavior (Dickens et al., 2011). Other monitoring methods, such as acoustic telemetry, are relatively invasive, requiring, for example, the implantation of a transmitter tag into the fish of interest. Methods that are noninvasive, such as passive acoustics, currently do not allow assignment of in situ observations to a particular species (Pagniello et al., 2019; Butler et al., 2021), as catalogues of fish sounds are either incomplete or nonexistent in most aquatic environments (Rountree et al., 2006). Given the limitations of these methods, optical imaging systems have become an increasingly popular, noninvasive, in situ monitoring method to quantify species diversity and abundance in and around MPAs (e.g., Langlois et al., 2006; Pelletier et al., 2011; Bouchet and Meeuwig, 2015).
Here, we describe the development and proof-of-concept of a novel, cost-effective OIS to enhance the efficient identification of fishes to a species level in low-light environments without artificial light. We review the capabilities of this new system and provide results from a deployment in the kelp forests within the South La Jolla State Marine Reserve (SMR). Given the performance and relatively low price of the system, this OIS has the potential to become a valuable tool for monitoring biodiversity, animal behavior, and presence/absence patterns in a host of aquatic environments. Details about the components, assembly steps, and software for the OIS are available online in this GitHub repository: https://github.com/cpagniel/FishOASIS/.
Design of the Optical Imaging System
The hardware for the OIS was assembled with off-the-shelf products (Figure 1a), based on a Sony α7S II (ILCE-7SM2) camera (Sony, Tokyo, JP) capable of capturing still frame images with 4,240 × 2,380 pixel resolution. The camera was fitted with a Rokinon 12 mm F2.8 fisheye lens (Elite Brands Inc., New York, NY) to provide a hemispherical field of view whose depth, and hence the imaging volume, depended on the water turbidity and ambient light. The OIS did not have stereoscopic capability.
The camera was set to “PC Remote” interface mode so that it could be controlled by a Raspberry Pi Model A+ single-board computer (SBC; Raspberry Pi Foundation, Cambridge, UK) equipped with a Witty Pi 2 real-time clock and power management (RTC/PM) board (UUGear, Prague, CZ). Bourne shell (.sh) scripts on the SBC managed camera actuation, sampling, and data storage (Figure 1b). The open-source command-line client gphoto2 (http://gphoto.org/), which allows the camera to be controlled by the SBC via USB, was used to capture an image and download it to one of three SanDisk Cruzer 256 GB USB 3.0 flash drives (SanDisk, Milpitas, CA). If the OIS’s total data storage capacity was exceeded, new images captured were not saved. The RTC/PM board kept the correct time without using network time protocol over the internet by using the accurate temperature-compensated real-time clock DS3231 (Maxim Integrated, San Jose, CA) and synched the time to the SBC clock. It also scheduled the start-up/shutdown sequence of the SBC with a Bourne shell script. After shutdown, the power to the SBC and all its USB peripherals was fully cut by the RTC/PM board.
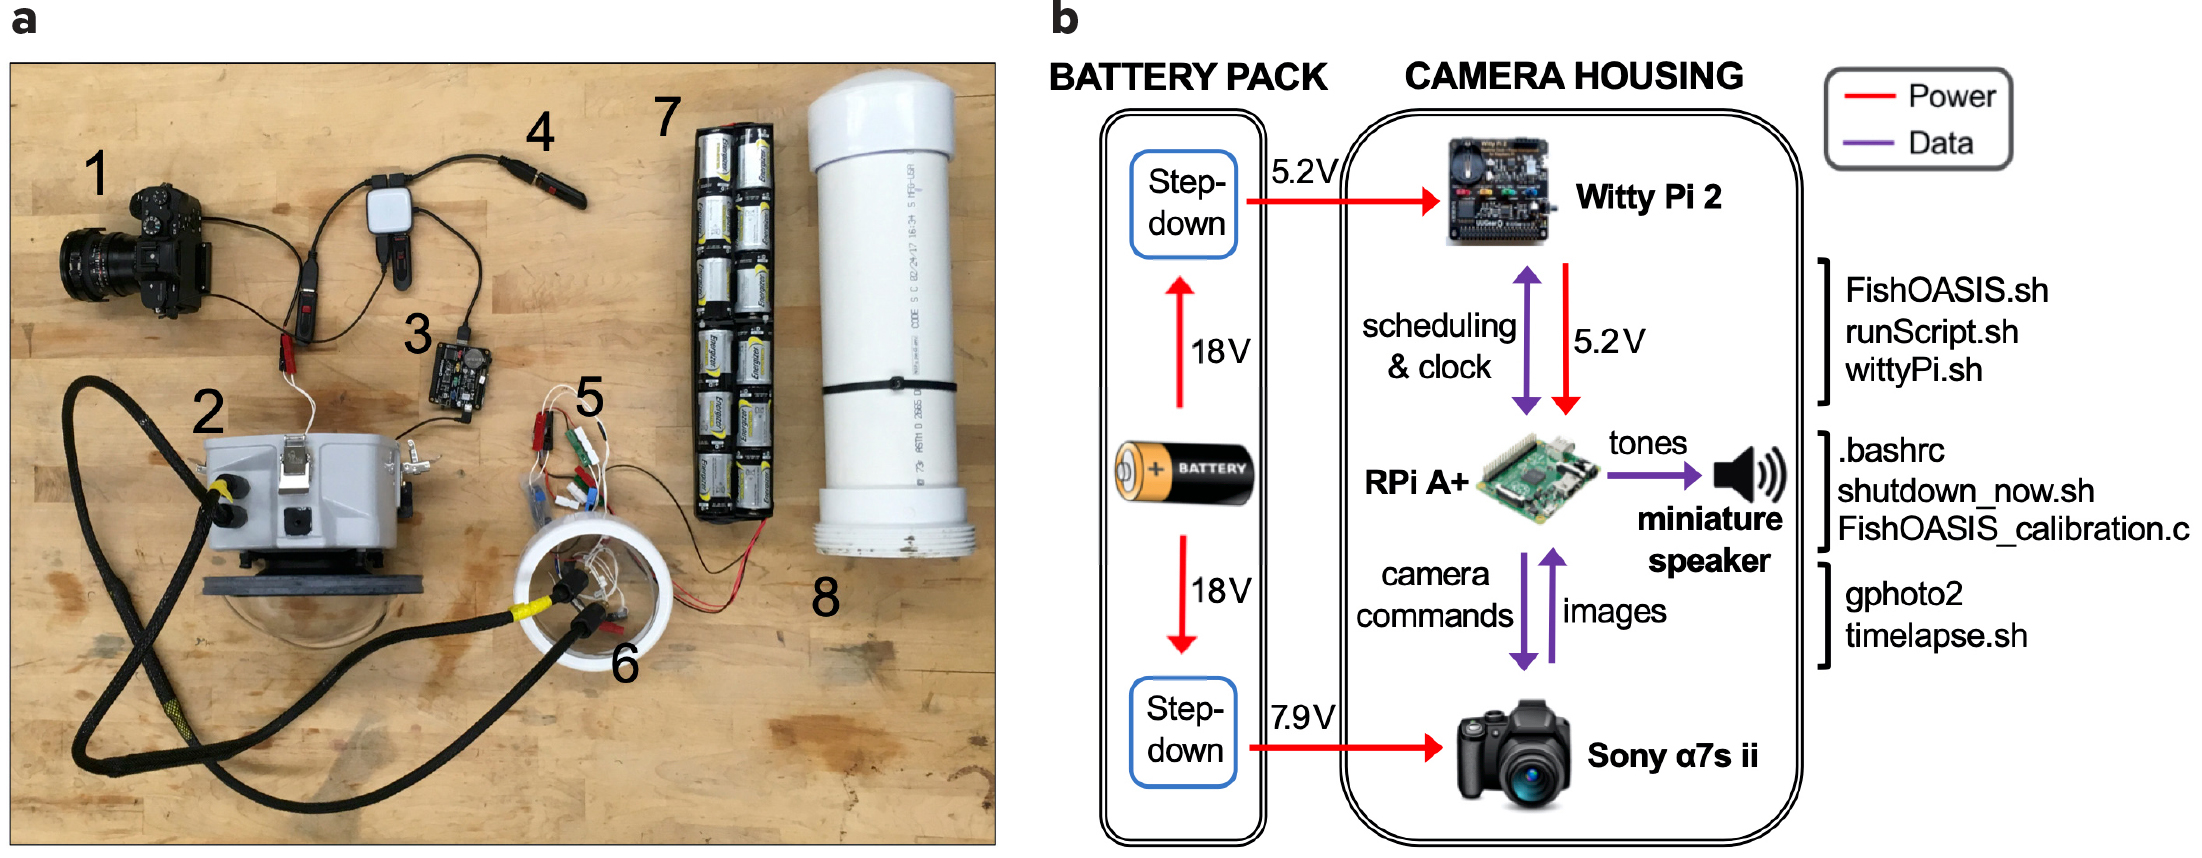
Figure 1. (a) Optical imaging system hardware components: (1) Sony α7s II camera with fisheye lens. (2) Ikelite camera housing. (3) Raspberry Pi A+ with Witty Pi 2 real-time clock and power management board. (4) USB flash data storage. (5) Step-down converters. (6) Wet-mateable bulkhead connectors. (7) Battery bank. (8) PVC battery housing. Note that the pictured battery bank (7) allowed for a 7-day deployment of the optical imaging system, while the battery bank that allowed for a 14-day deployment is twice as long. The miniature speaker that is soldered onto the Raspberry Pi A+ and used to produce synchronization tones is not pictured. (b) Schematic of the optical imaging system showing the flows of power (red lines) and data (purple lines) within and between the battery pack and the camera housing. Bourne shell code files (.sh) noted in the image can be found at https://github.com/cpagniel/FishOASIS/. > High res figure
|
To enable the co-deployment of the OIS and a passive acoustic system (PAS), a miniature 8 Ω, 0.5 W metal speaker (Adafruit, New York, NY) was soldered to the SBC’s general-purpose input/output (GPIO) pin 22 and ground pin. The GPIO access library WiringPi (http://wiringpi.com/) was used to output simple synchronization tones alternating between 610 Hz and 690 Hz on the startup of the SBC through the speaker. The camera, SBC, data storage, speaker, and other hardware described above were all placed in a custom-ordered camera housing with an 8-inch dome port and a 3.5-inch port extension (Ikelite, Indianapolis, IN), which was depth-rated to 60 m.
An external battery pack consisting of 48 industrial D-cell alkaline batteries (Energizer, St. Louis, MO) housed in a 30-inch PVC tube was used to power the OIS. Four banks, each consisting of 12 batteries wired in series, were wired in parallel to create a 720 Wh battery pack that outputs a nominal 18 V. Two DC-DC step-down converters (RioRand, Richmond, BC) were used to output voltages of 5.2 V and 7.9 V to power the SBC and the camera, respectively. The positive and negative output wires of each converter were soldered to a MCBH4M 4-pin micro bulkhead connector (SEACON, San Diego, CA) to connect the battery pack to the camera housing via a wet-mateable connection consisting of two MCIL4F 4-socket micro in-line connectors. This battery pack enabled the OIS to operate for 16 hours per day over 14 days, capturing a burst of 24 images taken over 2 minutes in a 12-minute cycle.
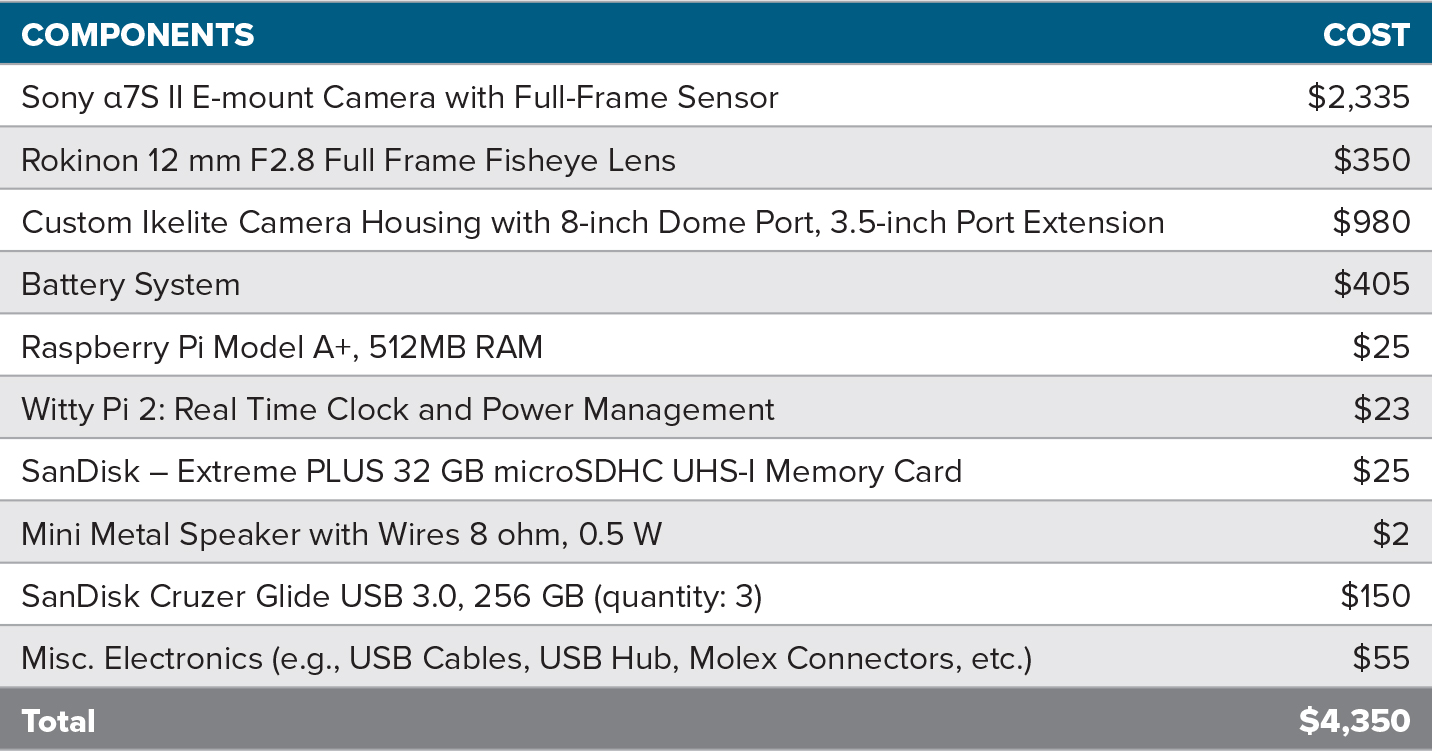
The total cost of the hardware components of the optical imaging system, including the camera, the SBC, and the housing, was approximately $4,350 (USD in 2017) at the time of fabrication (Table 1). A recent survey of components suggests that the cost of the OIS in 2021 is around $4,900 due to the significant increase in the price of bulkhead connectors.
Table 1. Estimated cost (USD in 2017) of the major hardware components of the optical imaging system. > High res figure
|
Optical Imaging System Performance
Power Consumption
This OIS takes advantage of contemporary hardware that requires little power for extended use, enabling deployment lengths on the order of days to months (depending on the sampling rate) without a connection to shore for power (Table S1). The lower limit of power consumption for the system is set by the Sony camera because the camera’s proximity sensor always remains activated by the housing. As a result, the camera does not enter the no-power sleep mode until 5 minutes and 4 seconds after the SBC has shut down. Given that the battery pack provides a total of 720 Wh, the camera can capture images for approximately 14.1 days with a 24 image/12-minute duty cycle over 16 operational hours per day. This is based on the 0.28 Wh power consumption of one on/off cycle of the SBC during which one image is captured and the camera sleeps. Specifically, each instance of the startup of the SBC and the capture of one image by the camera consumes on average 0.02 Wh. In addition, throughout an entire cycle, the SBC draws 0.42 A. After the SBC is shut down and prior to entering sleep mode, the camera consumes an additional 0.19 Wh. As the number of images captured during each 12-minute cycle is increased, the OIS shifts from battery limitation to storage limitation (Table S1). An .xlsx sheet with these power and data calculations is provided in the GitHub repository to help users calculate their own recording durations.
Clock Synchronization Between Optical Imaging and Passive Acoustic Systems
The OIS has a built-in method for time-aligning the OIS and an independent PAS. Given that the OIS is programmed to take only still images, a traditional clapboard cannot be used for the time synchronization between systems. In order to synchronize the OIS with a passive acoustic system, the miniature speaker that was attached to the SBC in the OIS was used to play synchronization tones at the start of each image capture sequence. These tones could be clearly identified in spectrograms of the acoustic data captured by the hydrophone co-located with the OIS (Figure S2a). While the clocks of both the passive acoustic and the optical imaging systems were synchronized before a deployment, the clocks linearly drifted apart at a rate of approximately 41.5 seconds per day (Figure S2b). Further testing of the OIS indicated that its clock drifts less than a second in 14 days, so the majority of the drift between the systems was due to the PAS’s clock. In addition to the sound produced by the miniature speaker, the sound produced by the actuation of the camera shutter could also be clearly identified in a spectrogram, providing an exact time stamp as to when an image was captured (Figure S2a). This feature could be used for future deployments without the need for a speaker if the OIS were placed within 0.5 m of a hydrophone and could thus enable users to establish species-sound associations for soniferous fishes in situ.
Field Application
Details about the underwater operation of the OIS, its deployment in the kelp forests on the northern edge of the South La Jolla SMR in approximately 14 m water depth from July 10–23, 2018, and post-deployment data analysis can be found in the online supplementary materials.
Fish Species Identification Using the OIS
Fish often display crepuscular behaviors that have been historically difficult to observe and characterize in temperate marine habitats (Potts, 1990). This OIS captured images with sufficient quality to permit identification of fish species without artificial lighting before sunrise (approximately 05:30 PDT) and after sunset (approximately 20:30 PDT), when light availability was extremely low (Figure 2). Images captured between these hours had the best signal-to-noise ratio, with no visible pixelation and exposure times less than 1/60 seconds and ISOs less than 128,000. Only about 80 of the 1,500 images per day were deemed unusable as they were too dark to identify any fishes. Remarkably, the system appeared to out-perform the ability of divers to visually observe animals underwater. When divers reported “poor visibility” (i.e., visibility that was <2 m), the system was capable of acquiring usable images at ranges of 3–4 m.
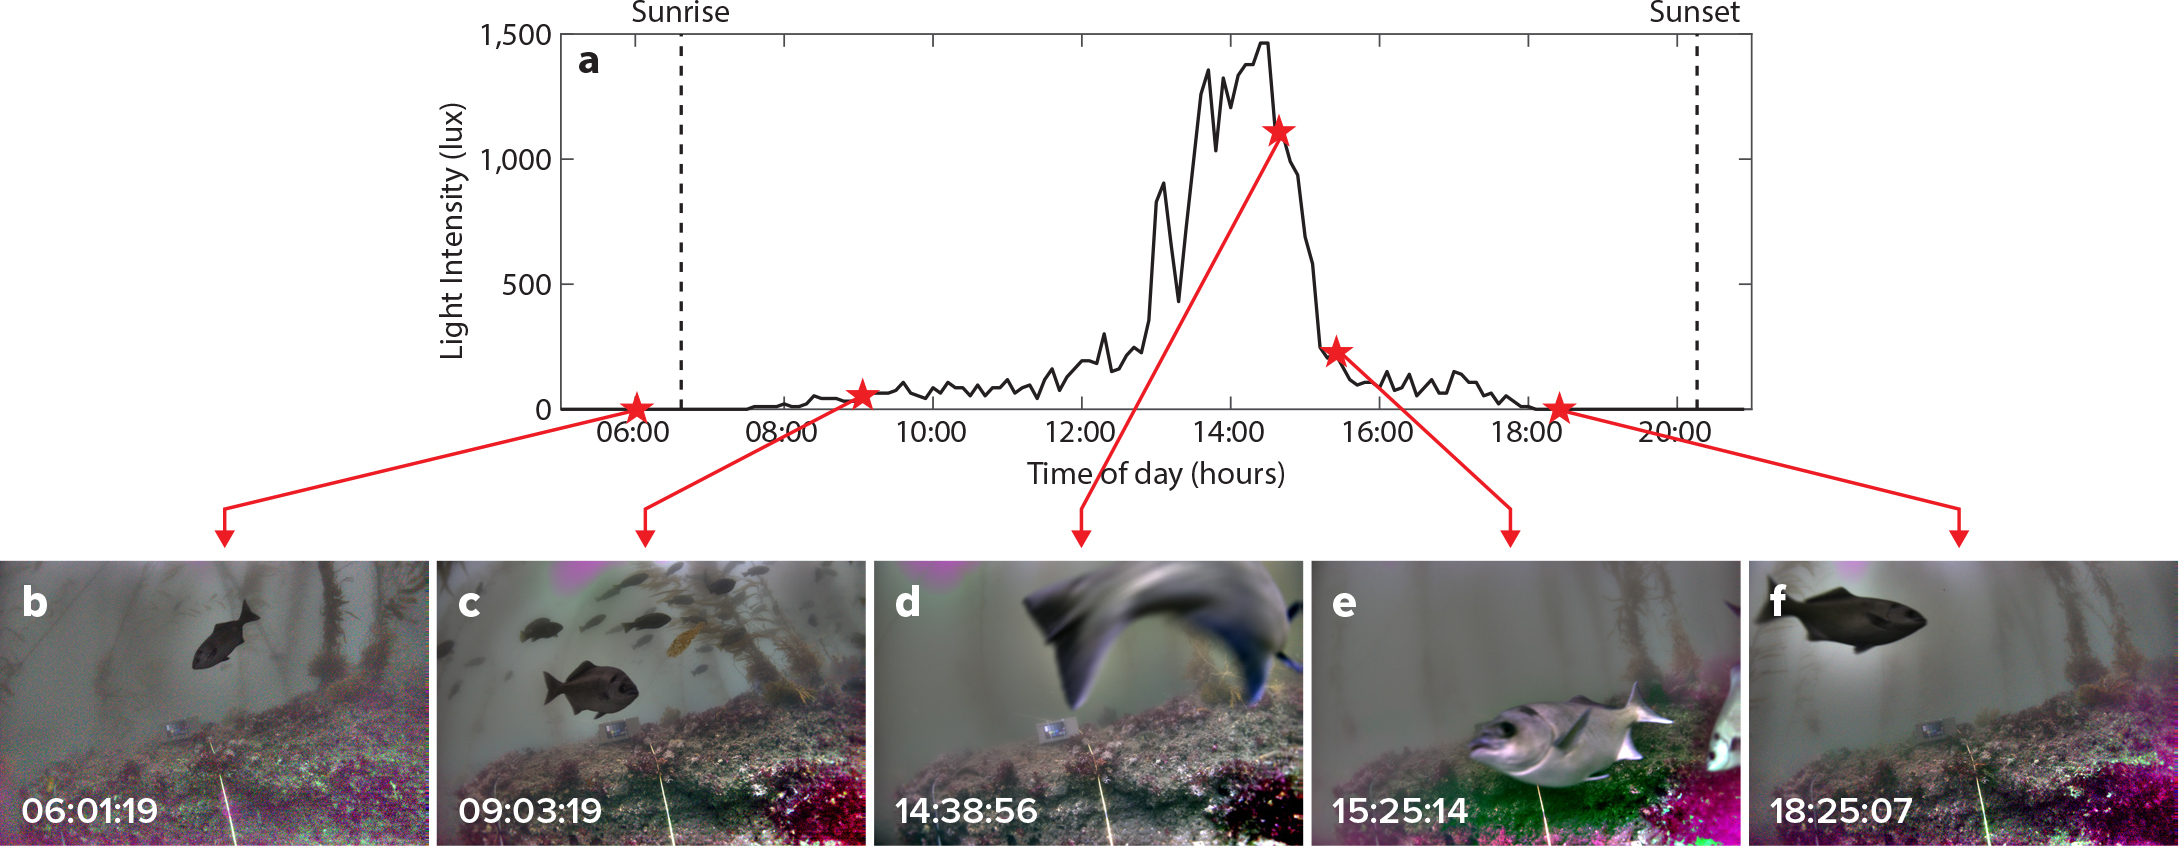
Figure 2. (a) Light intensity (lux) from 05:00 to 21:00 on July 12, 2018, in the South La Jolla State Marine Reserve. Images of halfmoon fish taken using the optical imaging system at (b) 06:01:19, (c) 09:03:19, (d) 14:38:56, (e) 15:25:14, and (f) 18:25:07 on July 12, 2018, at the same location. All times are local (Pacific Daylight Time). > High res figure
|
Overall, the high image quality reduced the need for a highly specialized expert analyst, as many different fish species can easily be distinguished based on coloration and shape, even before sunrise and after sunset. Other factors that affected identification of fish species in the images included the distance of the fish from the system, the size of the fish, and the vertical position of the fish within the water column. In general, with moderate amounts of ambient light (i.e., between 90 and 130 lux), fishes could be identified to a species level at distances of up to 8 m and to a family level at 10 m (Figure S3). However, identification of the species of a distant fish was also dependent on the shape, coloration, and size of the fish. We estimate that the OIS can resolve fishes as small as 10 cm if they are located within 2 m of the system. Additionally, fishes located higher in the water column were also more difficult to identify to species or family because the system provided a silhouetted, more ventral view of the fish.
Behavioral and Presence/Absence Observations from the South La Jolla SMR Kelp Forest
From July 10 to July 23, 2018, in the South La Jolla SMR kelp forest, a total of 17,101 images in which fish species could be identified were captured. A total of 9,601 fish across 20 species were manually identified (Table S2) by a team of analysts. Often, it was also possible to identify life stages of different fish. In this deployment, only 11% of fish were not identifiable.
Images captured various species of fish exhibiting a range of biologically important behaviors. Aggregations of kelp bass (Paralabrax clathratus) were observed potentially engaging in the spawning behavior described by Erisman and Allen (2006; Figure 3a). Terminal adult male California sheephead (Semicossyphus pulcher) were seen chasing other adult conspecifics, possibly to defend their territory (Figure 3b). Halfmoon (Medialuna californiensis) were often photographed within 0.5 m of the system, with many appearing to brush up against the lens dome (Figure 3c). Larger and rarer animals such as broadnose sevengill sharks (Notorynchus cepedianus) were also photographed (Figure 3d).

Figure 3. Examples of fish behaviors and species diversity captured with the optical imaging system. (a) Possible spawning aggregation of kelp bass. (b) A terminal adult California sheephead defending his territory. (c) Halfmoon close approach to the imaging system. (d) Broadnose sevengill shark. > High res figure
|
Fishes were present in the kelp forest throughout each day (Figure 4a). Adult señorita (Oxyjulis californica) were observed most frequently, comprising over 46% of the fish identified to a species level (Table S2). Schools of señorita were present every day during daylight hours (Figure 4b). Other species exhibited temporal variability in their presence. For example, Blacksmith (Chromis punctipinnis), the second most encountered fish species, were plentiful on some days, but nearly absent from images on others (Figure 4b). Rock wrasse (Halichoeres semicinctus) were almost exclusively identified in images before 12:00 PDT, whereas kelp bass were generally identified after 12:00 PDT (Figure 4c). Though both species are known to form schools, most of these fishes were imaged as individuals. Note, these counts of fish occurrence do not account for the presence of the same individual of a species appearing on multiple images throughout the deployment. This is an ongoing problem with optically based surveys, which Willis et al. (2000), for example, addressed by only choosing images with the maximum number of fish. We are not proposing that this OIS solves this over-counting problem. Thus, counts of fish occurrence reported here should be considered as inflated measures of “abundance.”
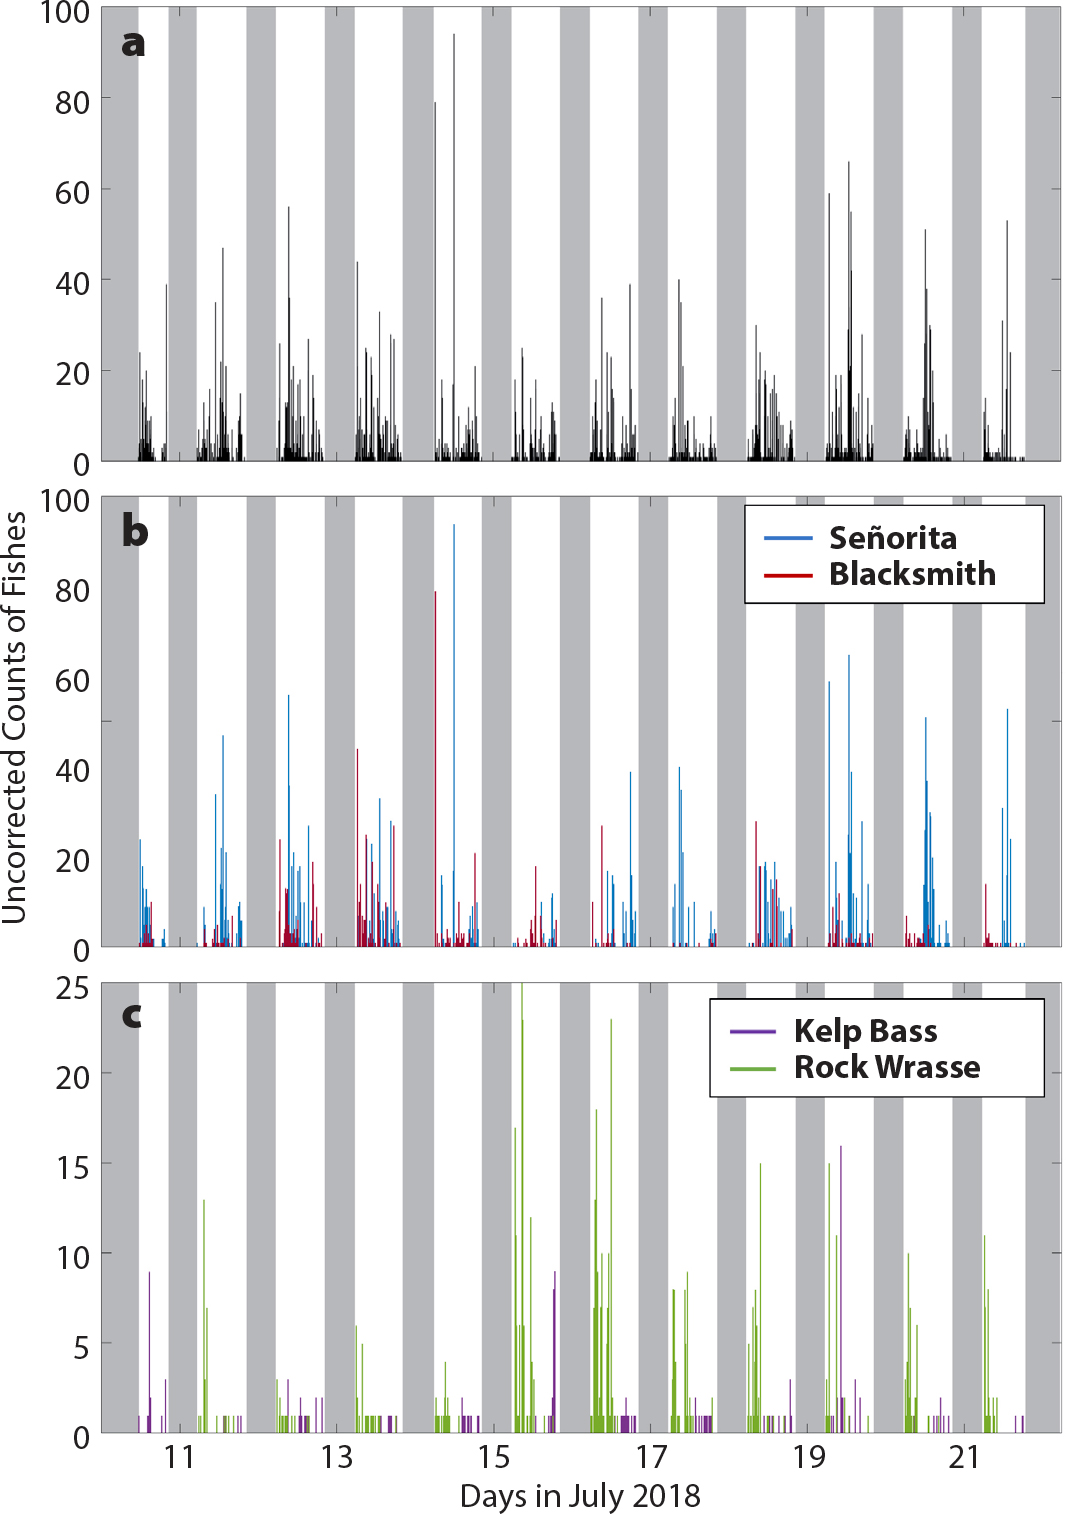
Figure 4. (a) Total number of all fishes (black) and counts of occurrences of (b) señorita (blue) and blacksmith (red), and (c) kelp bass (purple) and rock wrasse (green) captured in images from July 11, 2018, through July 21, 2018, in the kelp forest. All counts are uncorrected for the amount of ambient light available at the time of image capture and do not account for recurring individual fish in multiple images. All life stages of each species are included. Gray areas represent times when there were no usable images or when the camera was not operational. > High res figure
|
Future Modifications
We have identified three limitations of the OIS that could be addressed in future system upgrades. First, the Sony camera remains energized for an additional five minutes after the system captures its final image and the SBC shuts down because the camera’s proximity sensor is always activated inside the housing. To further extend recording durations, addition of an n-channel MOSFET switch could be considered so that the SBC could fully cut power to the camera after it has captured the images. Secondly, the camera encounters errors when an image has not been downloaded before gphoto2 actuates the camera to capture a subsequent image. Because the camera automatically selects its own shutter speed based on available light and gphoto2 actuates the camera at a predefined interval, the shutter speed can be longer than the predefined interval between images, leading to a situation where the SBC signals the camera to capture another image while it is still capturing the previous image. Thus, the camera is unable to continuously capture images without encountering an error when this situation occurs. Changing the camera actuation interval based on the time of day (a proxy for available light) or incorporating a light sensor could enable continuous image capture in the future. Finally, the OIS is not a completely noninvasive monitoring system. We captured a high number of images where halfmoon were located less than 0.5 m away from the camera. Often referred to as the “reef effect,” the aggregation response of fish to the addition of an artificial structure, including a camera, to their habitat has been well documented (Vardaro et al., 2007). In our case, we hypothesize that halfmoon may be attracted to the sound of the camera shutter or are simply attracted to the OIS itself. The potential change in behavior due to the presence of the OIS may lead to the overestimation of halfmoon occurrence or incorrect interpretations of their behavior.
Conclusions
We have designed and deployed an optical imaging system that captures high-quality images in low-light conditions, can be deployed for two weeks to a month (depending on the sampling rate), and includes a built-in method for synchronizing its clock with that of a passive acoustic system. Unlike other OISs, this one also provides the user with maximum system flexibility. All of the OIS’s Bourne shell scripts can easily be modified to alter the sampling rate or to capture video instead of still frame images and to run on any computer with a Unix-like operating system. Many of the hardware components can be interchanged as the command-line client gphoto2, used by the SBC to control the camera, is compatible with 574 unique camera models. Therefore, the Sony α7S II camera could be interchanged with a less expensive camera for use in higher ambient light environments (e.g., coral reefs). This built-in flexibility and interchangeability allow users to select the best settings and configurations based on their deployment objectives and budgets.
In 14 days, the OIS captured 40% of the fish species recorded during 500 dive transects conducted in the same region over a different three-year period, with similar rank-order abundances (Hastings et al., 2014). The OIS also captured almost the same diversity of fish species reported by recreational anglers in the area (Parnell et al., 2010). We estimated a diver-based approach at the same study site in the kelp forest with six 25 m dive transects per day (or approximately 3 dive hours per day) over 14 days would cost approximately US$10,000 in 2020 (including boat time and gas, scuba equipment, and personnel salary). This is about 2.3 times greater than the initial acquisition cost of the OIS (~US$4,350 in 2017), with the diver-based approach costing approximately $240 per monitoring hour and the camera-based approach costing about $130 per monitoring hour (including dives to deploy and recover the system). The cost of a camera-based approach drops substantially to only $15 per monitoring hour when the acquisition cost of the OIS is removed, illustrating the improved cost-efficiency of the OIS over extended uses in addition to the greater temporal spread of observations (i.e., observations for 2 minutes every 12 minutes over 16 hours per day) captured using the OIS compared to traditional methods. The availability of a consumer-grade camera with the ability to produce high-quality images in low-light levels without artificial lighting was key to extending the price-performance ratio of this system.
With our successful deployment in the kelp forest, we show that this OIS provides a novel, cost-effective scientific approach for monitoring the behavior, diversity, and frequency of occurrence of fish species in MPAs as well as other nearshore areas, and that it maintains its efficacy near sunrise and sunset when biological activity intensifies. Furthermore, the OIS is minimally invasive, and it captures presence/absence patterns that are similar to those captured by traditional methods but with much greater temporal resolution and duration. The OIS’s capability to collect data at larger sample sizes provides high statistical power at specific locations and increases our ability to accurately detect population trends. Note, OIS deployment locations should be chosen to be representative of the larger surveyed areas of dive transects. We anticipate that ongoing developments in consumer-
grade cameras will continue to improve the price-performance ratio of OISs, creating more opportunities in the future. We are hopeful that this OIS will become a highly utilized tool by researchers to study fish communities in MPAs, given its advantages over traditional MPA monitoring methods.
Acknowledgments
Thank you to I. Arzeno, K. Bagheri, D. Bevans, A. Brennan, J. Busch, S. Brody, M. Cimino, M. Costa, A. Cusick, B. Frable, M. Harvey, P. Lertvilai, C. McDonald, A. Palinkas, K. Pederson, B. Pickering, M. Sedarat, R. Walsh, K.C. Wilson, K. Wilson, and W. Wolfe for assistance in the field. Thank you to D. Akkaynak for generating the color-corrected images using the Sea-thru method. Thank you to B. Frable and P. Hastings for assistance in identifying fish species in images. Thank you to R. Walsh for assistance with diver survey cost estimates.
Funding was provided by California Sea Grant College Program Project Award Number NA14OAR4170075 to AŠ, JSJ and PEP, through NOAA’S National Sea Grant College Program, US Department of Commerce. CMLSP was also supported in part by a Natural Sciences and Engineering Research Council (NSERC) of Canada Postgraduate Scholarship-Doctoral Program.

