Introduction
The annual mean atmospheric CO2 concentration at Mauna Loa, Hawaii, first exceeded 400 ppmv (parts per million by volume) in 2015 (Figure 1a). With the rapid rise in CO2, global mean surface temperature (GMST), both in the atmosphere (GMSAT) and in the ocean (GMSST), shows a long-term warming trend (Figure 1b,c). Concerns over the rapid anthropogenic warming rallied countries to ratify the Paris Agreement in December 2015 to curb greenhouse gas emissions and keep the rise of GMST in this century well below 2°C above pre-industrial levels and to pursue efforts to limit the temperature increase to 1.5°C (Figueres et al., 2017).
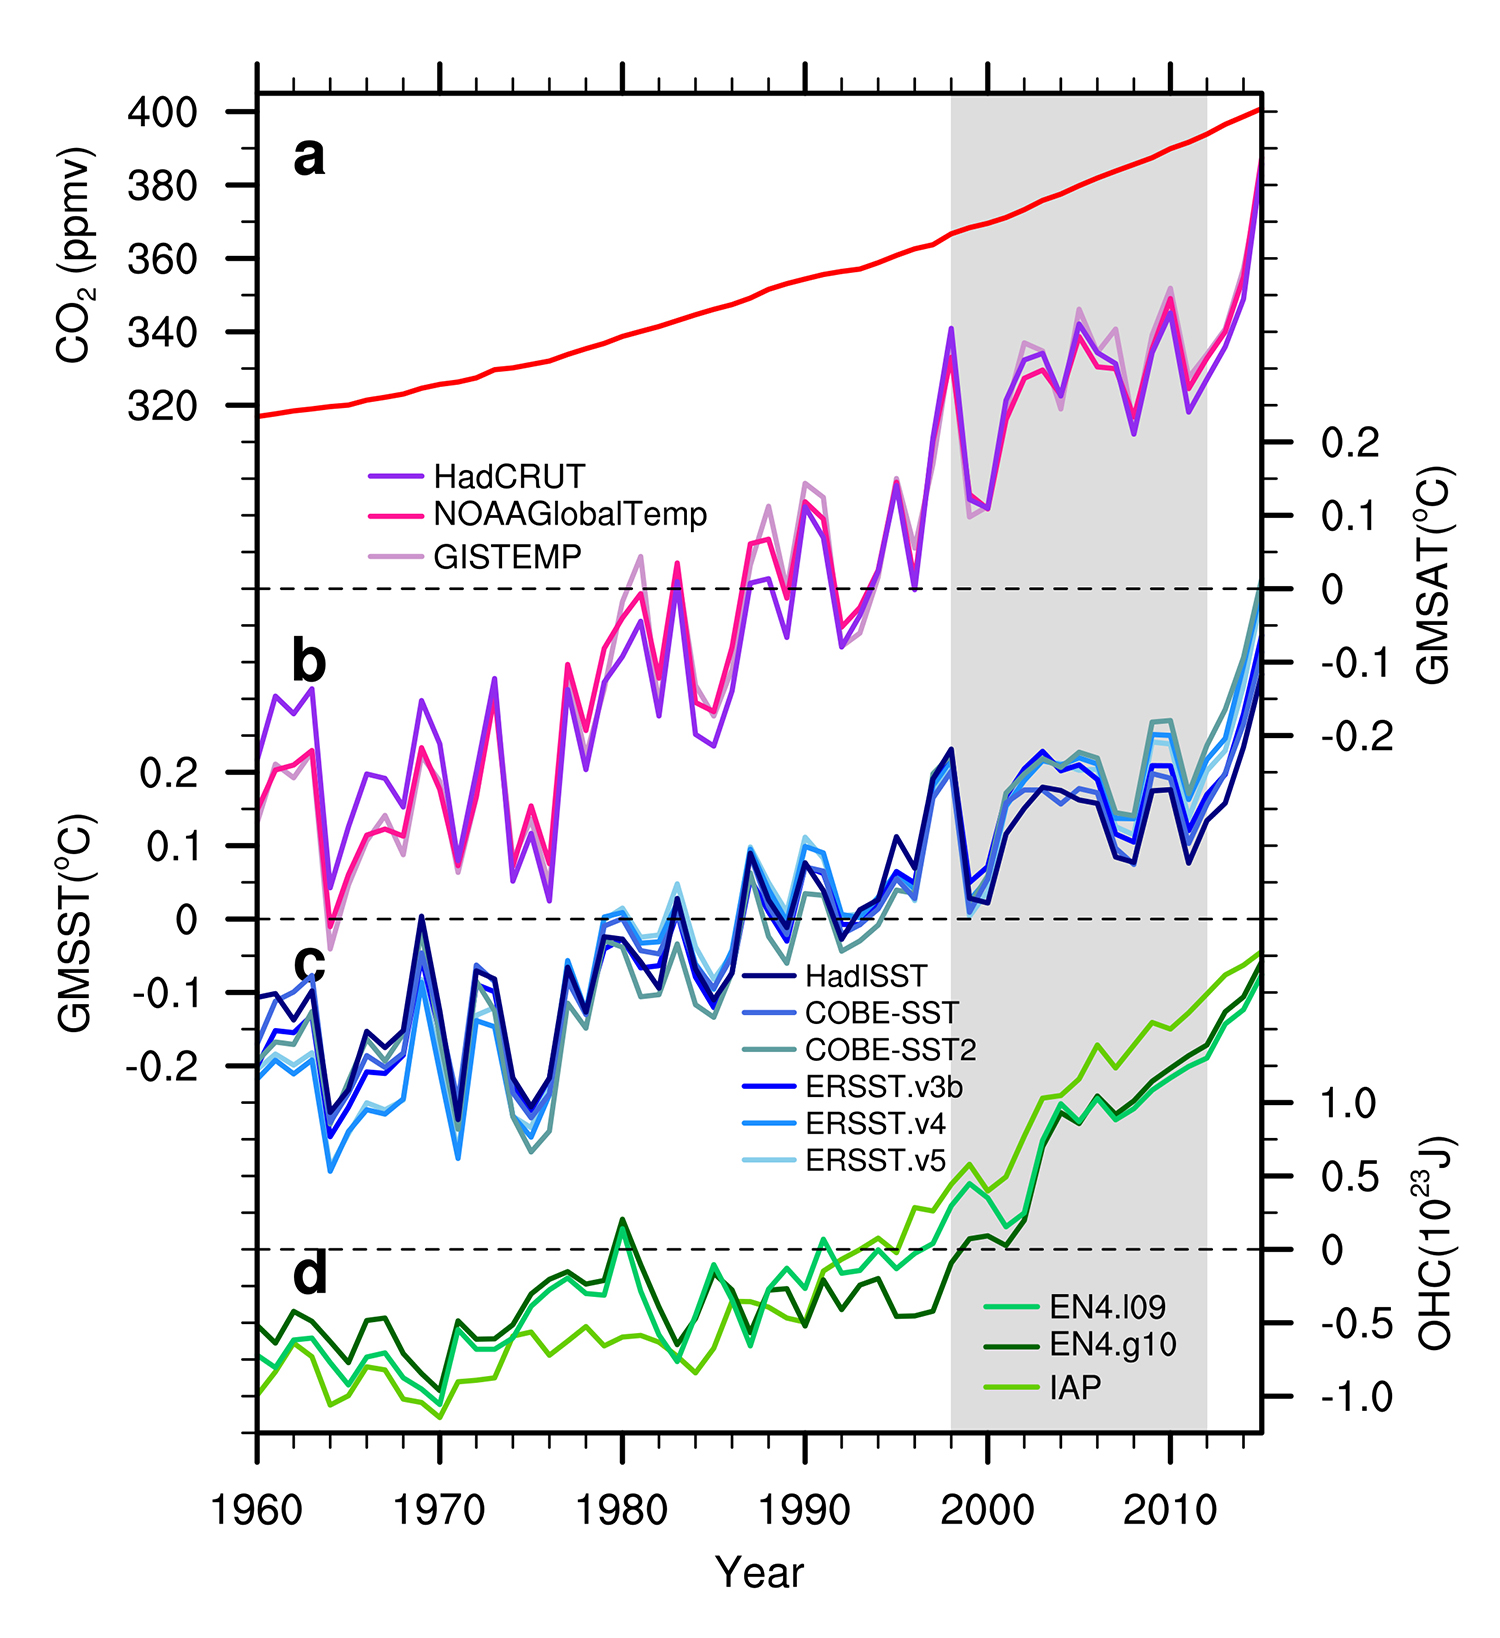
Figure 1. (a) Observed annual-mean CO2 concentration at Mauna Loa. (b) Annual global mean surface air temperature (GMSAT) anomalies. (c) Annual global mean sea surface temperature (GMSST) anomalies. (d) Annual global mean 0–2,000 m ocean heat content (OHC) anomalies relative to the 1960–2015 average. Gray shading highlights the hiatus period. GMSAT is based on Hadley Centre Climate Research Unit Temperature (HadCRUT) version 4.6.0.0 (Morice et al., 2012), NOAA Merged Land Ocean Global Surface Temperature Analysis (NOAAGlobalTemp; T.M. Smith et al., 2008), and Goddard Institute for Space Studies Temperature (GISTEMP; Hansen et al., 2010). GMSST is based on Hadley Centre Sea Ice and Sea Surface Temperature (HadISST; Rayner et al., 2003), Centennial In Situ Observation-Based Estimates of the Variability of SST and Marine Meteorological Variables versions 1 (COBE-SST: Ishii et al., 2005) and 2 (COBE-SST2; Hirahara et al., 2014), and Extended Reconstructed Sea Surface Temperature versions 3b (ERSST.v3b; T.M. Smith et al., 2008), 4 (ERSST.v4; Huang et al., 2015; Liu et al., 2015), and 5 (ERSST.v5; Huang et al., 2017). OHC is based on EN4 data with Levitus et al. (2009) (EN4. l09) and Gouretski and Reseghetti (2010) (EN4.g10) corrections and Institute of Atmospheric Physics Chinese Academy of Sciences (IAP) data (Cheng et al., 2017). > High res figure
|
GMST fluctuates on decadal timescales against a century-long warming trend (Easterling and Wehner, 2009). The increase in GMST slowed during 1998–2012, as noted by the Intergovernmental Panel on Climate Change (IPCC) Fifth Assessment Report (AR5): “the rate of warming over the past 15 years (1998–2012; 0.05°C [−0.05°C to +0.15°C] per decade), which begins with a strong El Niño, is smaller than the rate calculated since 1951 (1951–2012; 0.12°C [0.08–0.14°C] per decade)” (Hartmann et al., 2013). This global warming hiatus is present in all the observational data sets (Fyfe et al., 2016, also, c.f. Figure 1b,c), but with some uncertainty (Karl et al., 2015). Many climate models do not simulate the hiatus during the specific period of 1998–2012. A vigorous debate has ensued over whether this slowdown in warming was the result of naturally occurring internal variability or anthropogenically forced changes to Earth’s climate system. Volcanic eruptions (Santer et al., 2014) and anthropogenic aerosols (D.M. Smith et al., 2016) were suggested to have played a modest role in this warming hiatus, but natural modes of variability of the coupled climate system (Dai et al., 2015) have been identified as the main culprits.
The Interdecadal Pacific Oscillation (IPO; Power et al., 1999) and the Atlantic Multidecadal Oscillation (AMO; Kushnir, 1994) are thought to be the leading modes of GMST variability. The IPO is closely related to the Pacific Decadal Oscillation (PDO; Mantua et al., 1997), except the former is Pacific-wide and the latter is confined to the North Pacific. Climate model simulations (Meehl et al., 2013; Brown et al., 2015) consistently show that decadal variability in unforced GMST is mainly associated with a global pattern of surface temperature that resembles the IPO mode. A positive (negative) IPO is associated with an increase (decrease) in GMST. By regressing out the forced change in the Coupled Model Intercomparison Project Phase 5 (CMIP5) ensemble GMST, Dai et al. (2015) found that the leading mode of “unforced” GMST for 1920–2013 is the IPO, while the fourth mode resembles the AMO. Given that the Pacific accounts for a large percentage of Earth’s total surface area, the IPO dominates GMST variability, with a significant contribution from the AMO. The second and third modes, though explaining more regional variability than the AMO, do not project onto the GMST. By forcing changes in the IPO and AMO modes, Dai et al. (2015) successfully reconstructed the observed GMST, including the recent hiatus.
Two lines of research have been pursued to decipher historical GMST variations and to examine the recent global warming hiatus (Xie and Kosaka, 2017). One explores the physical mechanism for sea surface temperature (SST) patterns (e.g., Kosaka and Xie, 2013). The IPO and the AMO result from ocean dynamics and ocean-atmosphere feedbacks. Pacemaker experiments, designed to constrain the interannual-to-decadal modes of variability of a coupled model to follow observed fluctuations, identify the IPO as the main cause of the warming hiatus. The other line of research focuses on variations in Earth’s energy, more specifically on ocean heat content (OHC). More than 90% of Earth’s energy imbalance induced by anthropogenic radiative forcing is stored in the ocean in the form of OHC (Rhein et al., 2013). It is evident that the global OHC exhibits a different evolution from the GMST (Figure 1d). There was no hiatus in the former when the rate of increase in the latter slowed in the early 2000s. The unaltered increase in OHC over the hiatus period suggests that “external forcing” explanations for the hiatus, such as increased negative volcanic aerosol forcing, may not be sufficient. Thus, the energy line of research aims to relate the hiatus to changes in energy fluxes at the top of the atmosphere (TOA; Xie et al., 2016) and to the three-dimensional distribution of OHC change on decadal timescales (Meehl et al., 2011). As a natural mode of the climate system, the IPO regulates and redistributes ocean heat uptake in certain characteristic patterns (Nieves et al., 2015; Liu et al., 2016). Substantial work has been done to pursue both lines of research since about 2005. The conclusions of these studies are consistent in some respects, though there is still active debate over observational uncertainty and differences between observations and climate models.
Physical Mechanism for SST Patterns
Tropical Origin of the IPO and the Pacemaker Experiments
The IPO features a strong covariance between the tropics and the extratropics. One leading theory suggests that the IPO originates from the tropics (Deser et al., 2004; Newman et al., 2016) and largely follows the classical mechanism for the El Niño–Southern Oscillation (ENSO). In particular, the negative (positive) phase of the IPO manifests as a cooling (warming) center in the eastern and central equatorial Pacific and warming (cooling) centers in the northwest and southwest Pacific, conditions that resemble the La Niña (El Niño) pattern. Similar to ENSO, an atmospheric Pacific–North America teleconnection causes the strong negative correlation between tropical and North Pacific SSTs (Alexander, 1990). Nevertheless, ENSO and the IPO act at distinct timescales (interannual vs. interdecadal) and according to different physics. Vertical displacements of the thermocline are essential for ENSO but not for the IPO (Clement et al., 2011).
Built on the tropical origin of the IPO, the “pacemaker” experiments nudge the central to eastern tropical Pacific SST anomalies in climate models toward observations (Kosaka and Xie, 2013; Deser et al., 2017). Via atmospheric teleconnection, the restored tropical SSTs (based on observations) in the pacemaker experiments lock the Pacific variability in a negative IPO and thus enable the model to reproduce the recent hiatus (Figure 2b–d). The decadal trend in GMST is substantially reduced in the Pacific Ocean–Global Atmosphere (POGA) experiment compared to the historical simulation without the tropical Pacific SST having been restored, and the pacemaker results agree much better with observations (Figure 2a).
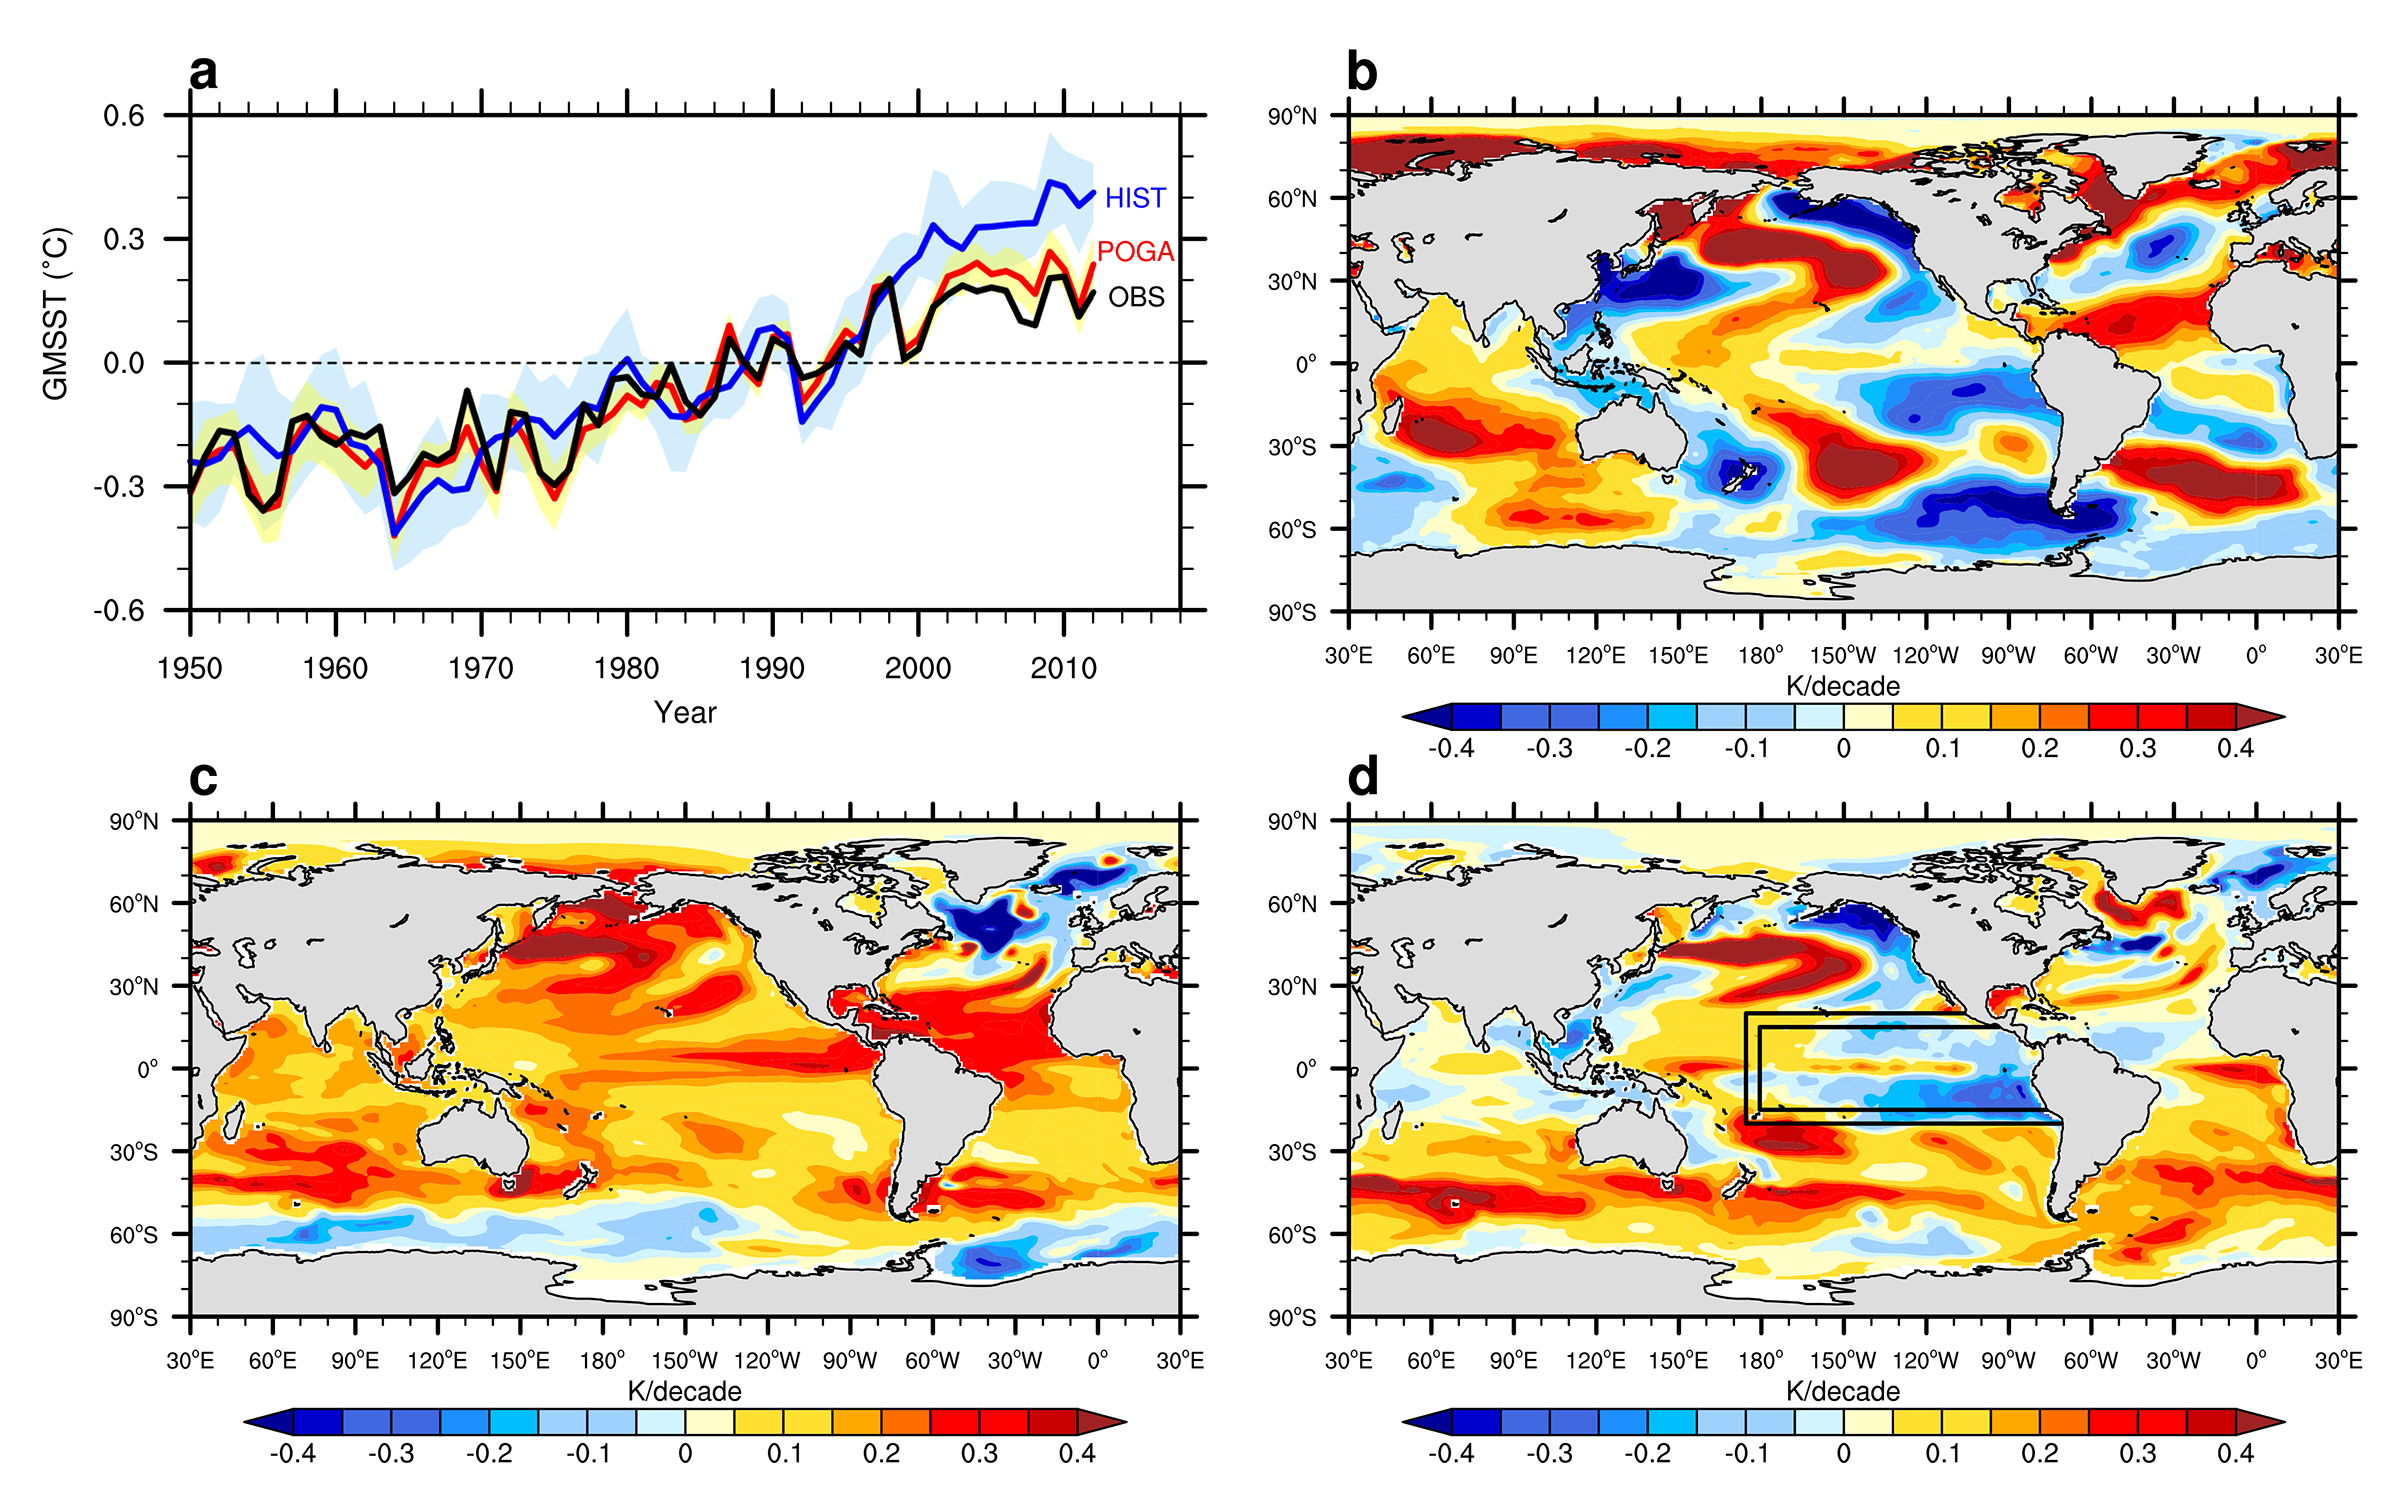
Figure 2. (a) Annual-mean GMSST anomalies relative to the 1980–1999 average based on observations (the ensemble mean of six SST data sets in Figure 1; black line), ensemble means of historical (HIST; blue line), and Pacific Ocean–Global Atmosphere (POGA; red line) simulations from Kosaka and Xie (2013). The light blue and yellow shadings indicate one standard deviation from the ensemble means of HIST and POGA. (b–d) SST trend patterns in (b) observations, (c) HIST, and (d) POGA ensemble means during 1998–2012 (shading in K per decade). Panel (d) shows the region where SST is restored; within the inner box, the ocean surface heat flux is fully overridden, while in the buffer zone between the inner and outer boxes, the flux is blended with the model-diagnosed flux. > High res figure
|
Alternatively, the pacemaker experiments can be performed by driving the tropical Pacific with observed wind variability (England et al., 2014; Watanabe et al., 2014). The underlying rationale is the Bjerknes feedback of ocean-atmosphere interaction that links the La Niña-like decadal cooling with the intensified easterly trade winds in the equatorial Pacific. Because of this feedback, the pacemaking effect of the tropical Pacific on the recent hiatus has been demonstrated by prescribing observed wind variations in climate models, instead of restoring SST. Both SST- and wind-forced pacemaker experiments reproduce a significant slowdown in the increase of GMST over the hiatus period. Restoring the SST produces the intensified trade winds (Kosaka and Xie, 2016), and likewise the prescribed trade wind intensification causes the tropical Pacific to cool.
The AMO Impact on the Hiatus
The AMO is a North Atlantic mode of natural variability that has a distinctive expression in the SST field. The AMO has started to switch to a positive phase since the late 1990s, and manifests as warming of the North Atlantic SST, which has been suggested to contribute to the recent global warming hiatus via a tropic-wide teleconnection (McGregor et al., 2014; Li et al., 2016). Specifically, the Atlantic warming drives easterly wind anomalies over the Indo-Western Pacific through Kelvin waves and westerly anomalies over the eastern Pacific as Rossby waves (Figure 3). By enhancing the easterly trade winds and through Bjerknes ocean-dynamical processes, the Indo-Western Pacific warming intensifies the La Niña-type response over the tropical Pacific and contributes to the global warming hiatus (Li et al., 2016).
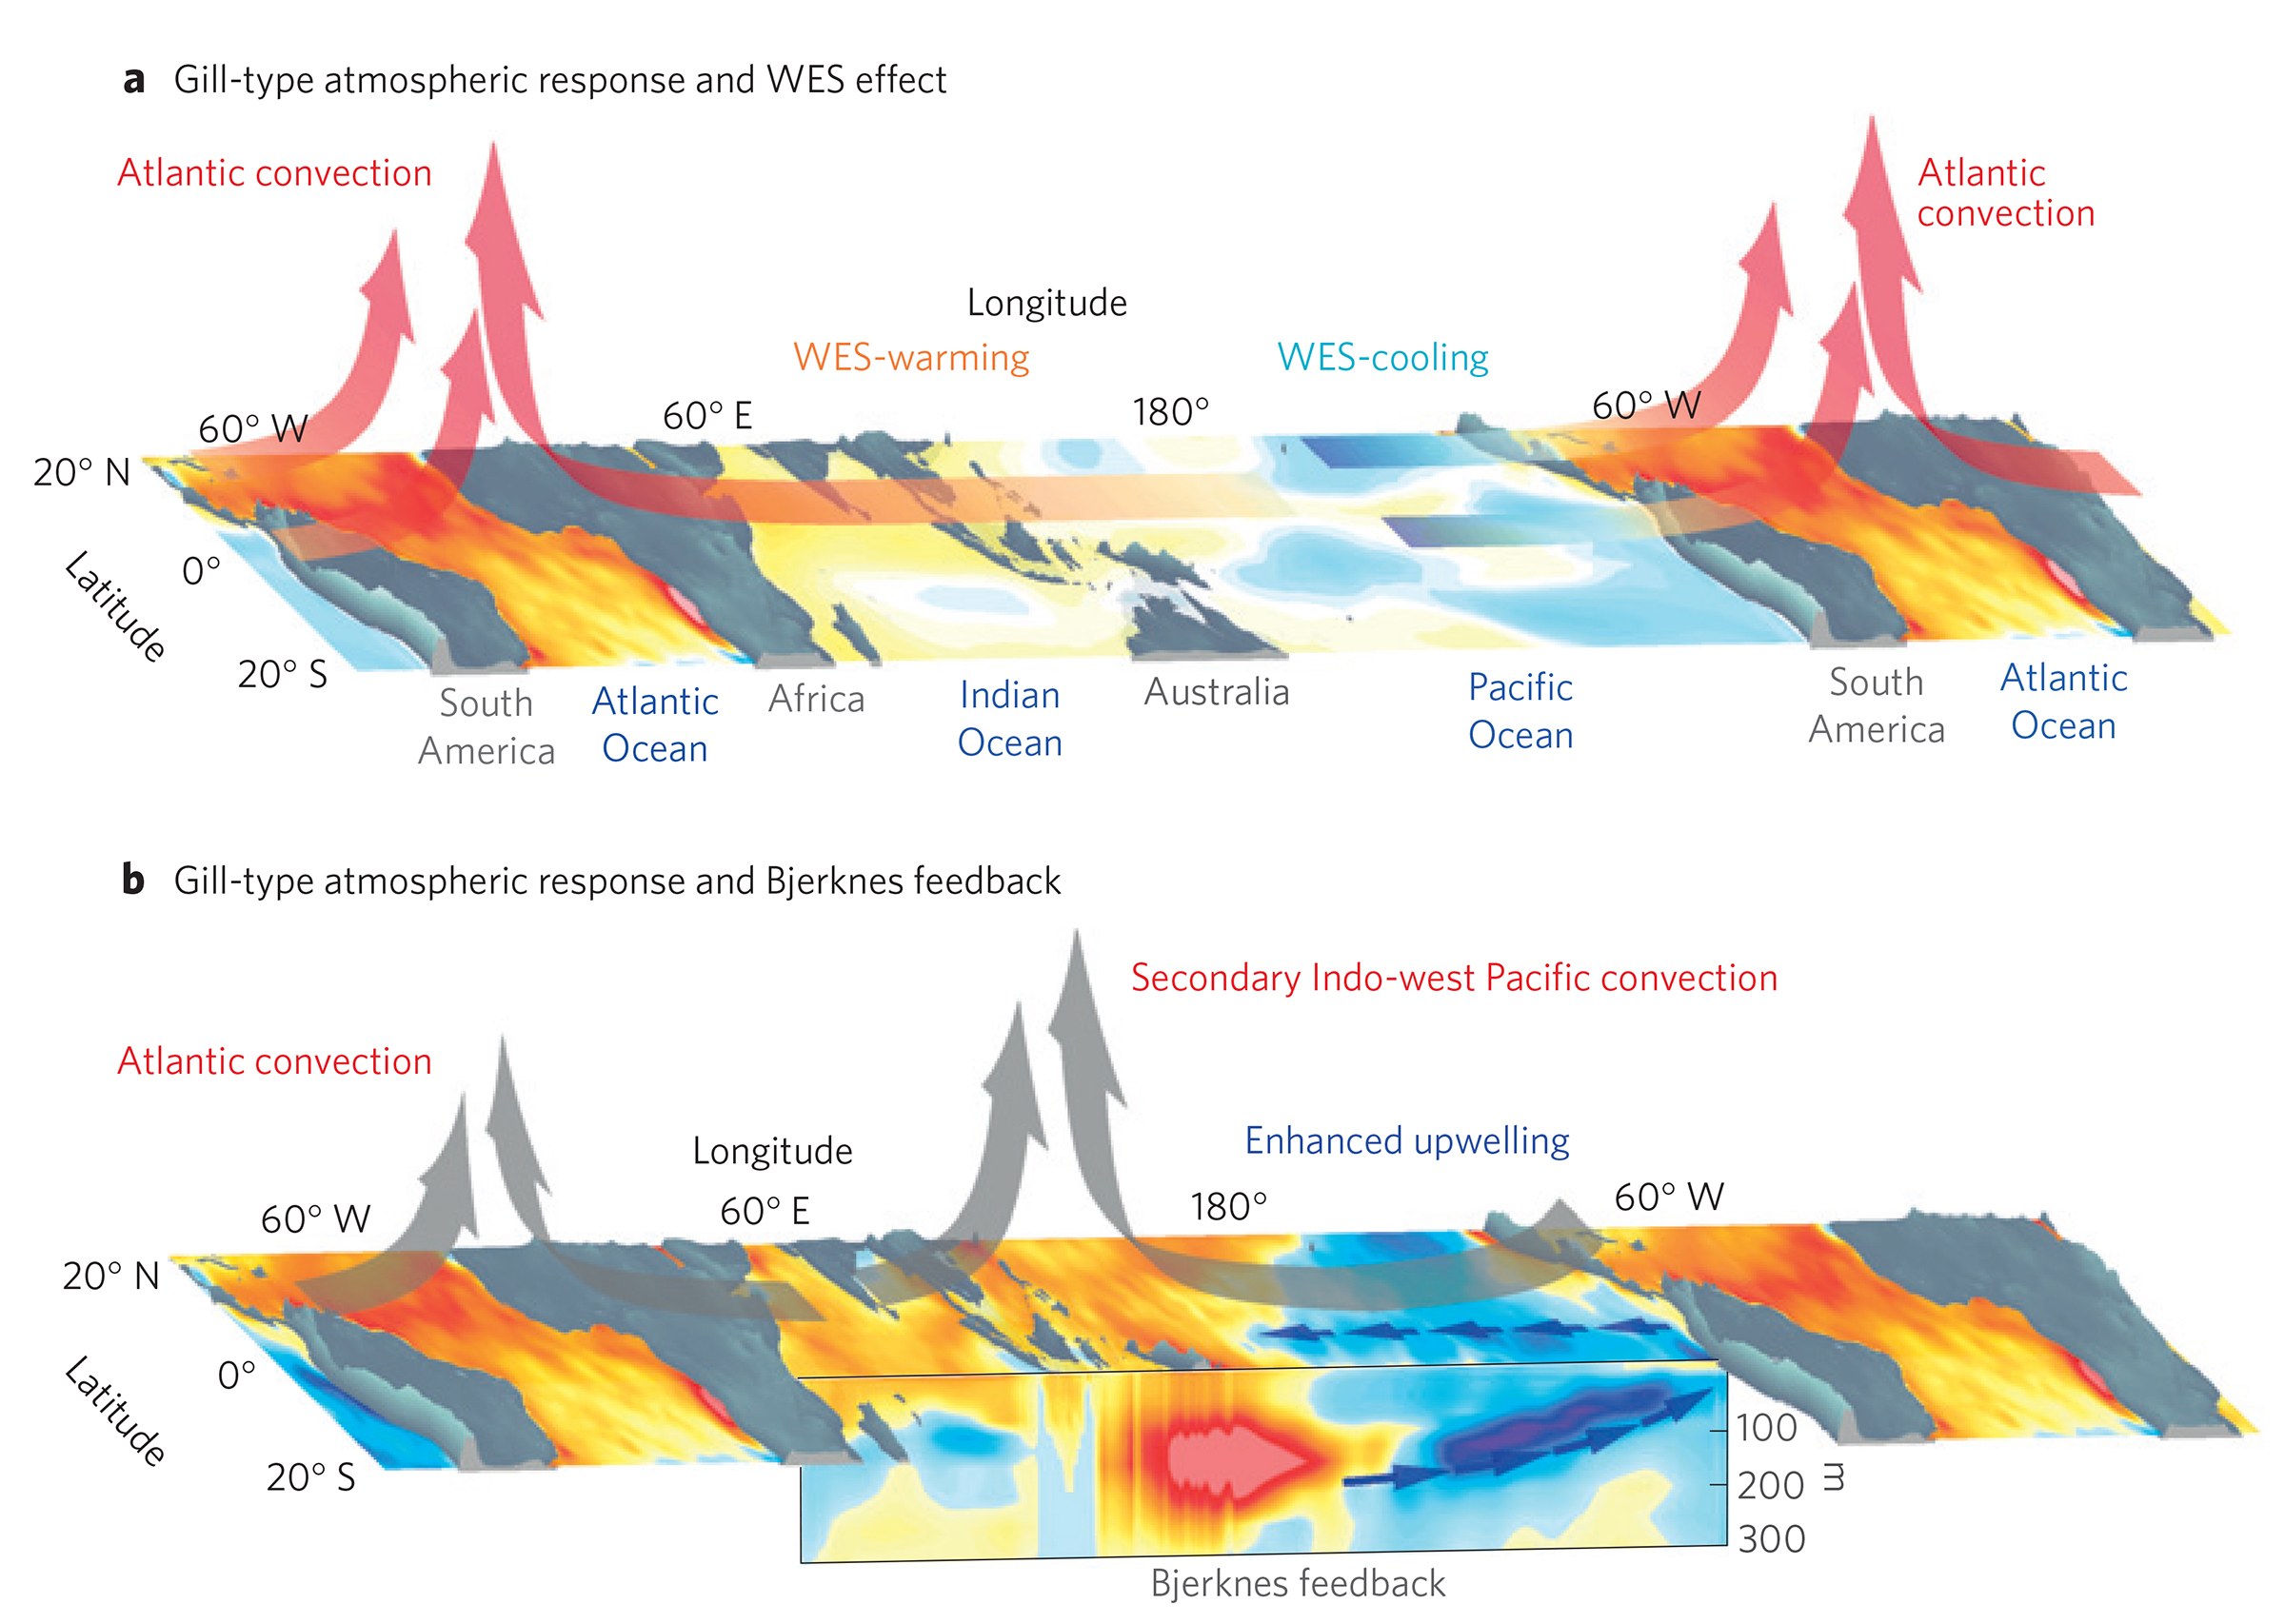
Figure 3. (a) Atlantic warming generates anomalous atmospheric deep convection, mimicking the Gill convective model. The deep convection forces an easterly wind anomaly over the Indian Ocean, which weakens the background westerly wind and thus suppresses local evaporation and increases the SST there. This atmosphere–ocean interaction initiates a temperature gradient over the Indo-Pacific Ocean. (b) The Pacific Ocean dynamic effect feeds back positively on the SST gradient. The SST gradient generates a secondary deep convection over the Indo-Western Pacific warm pool, reinforcing the easterly wind anomalies over the Pacific basin, which intensifies the Ekman pumping over the eastern Pacific and enhances the Pacific undercurrent. Such dynamical effects cool the eastern Pacific and warm the western Pacific. The vertical cross section in panel (b) illustrates the temperature and circulation anomalies in the subsurface Indo-Pacific. Adapted from Li et al. (2016). > High res figure
|
The Hiatus from the Energy Perspective
It has been suggested that, during the hiatus, less net radiation enters Earth’s energy budget via the TOA or that the ocean absorbs extra heat even if net TOA radiation is unchanged. This argument, however, has been debated due to uncertainties in both observations and models. For example, OHC estimates from oceanic temperature observations do not show accelerated ocean warming during the hiatus period (Levitus et al., 2012; Trenberth et al., 2014), and satellite data since 2000 show hardly any change in TOA radiation (Loeb et al., 2012). However, by combining several data sets of expanded satellite observations dating to 1960, D.M. Smith et al. (2015) show a reduction in net downward TOA radiation between 1999 and 2005 that potentially contributed to the warming hiatus. On the model side, some analysis suggests that global-mean net TOA radiation or global ocean heat uptake are generally not simply functions of GMST as indicated for internal decadal variability (Xie et al., 2016), while other analysis (Hedemann et al., 2017) argues that hiatuses result from small energy-flux deviations that can originate at the TOA, in the ocean, or both.
A further argument for energy flux is that the surface warming hiatus is associated with accelerated warming of the global deep ocean (>700 m; Balmaseda et al., 2013). This argument can be evaluated by comparing the vertical heat distribution in the ocean during hiatus and non-hiatus periods. A model study (Meehl et al., 2011) shows that a surface warming hiatus is significantly correlated with accelerated warming in deep ocean depths, below 750 m in the Atlantic and Southern Oceans and below 300 m in the Pacific and Indian Oceans.
The complex relationship between changes in OHC and GMST motivates expanding the energy-flux perspective to three dimensions: that is, explore the three-dimensional heat redistribution in the ocean and find the part that is tied to the surface warming hiatus. One robust OHC pattern associated with the surface warming hiatus is found in the Indo-Pacific and is related to the phase shift of the IPO. As a natural mode of the climate system, the IPO is associated with robust changes in oceanic and atmospheric circulations that in turn modulate ocean heat uptake and redistribute ocean heat within the Pacific Ocean and between the Pacific and Indian Oceans (Nieves et al., 2015; Lee et al., 2015; Liu et al., 2016). Figure 4 shows the differences between oceanic and atmospheric circulations and oceanic heat from two suites of members of the Community Earth System Model-Large Ensemble project (CESM-LE; Kay et al., 2015). One suite simulates a global warming hiatus during 2002–2012, and the other simulates a warming surge during that period. Associated with the negative phase of the IPO, the Pacific trade winds intensify during the hiatus because of accelerated Walker and Hadley cells, as reflected in anomalously high sea level pressure in the mid-latitude Pacific (Figure 4a). The intensified surface winds strengthen equatorial surface currents and the equatorial undercurrent, and accelerate the Pacific shallow meridional overturning circulation by increasing the wind-driven Ekman divergence away from the equator (Figure 4b). In the central and western Pacific, the tropical thermocline deepens in response to the equatorial heat convergence and the equatorial easterlies (Figure 4c). Oceanic heat is redistributed in the tropical Pacific, with an OHC decrease in the tropical central and eastern Pacific and an OHC increase in the western Pacific warm pool (England et al., 2014; Liu et al., 2016).
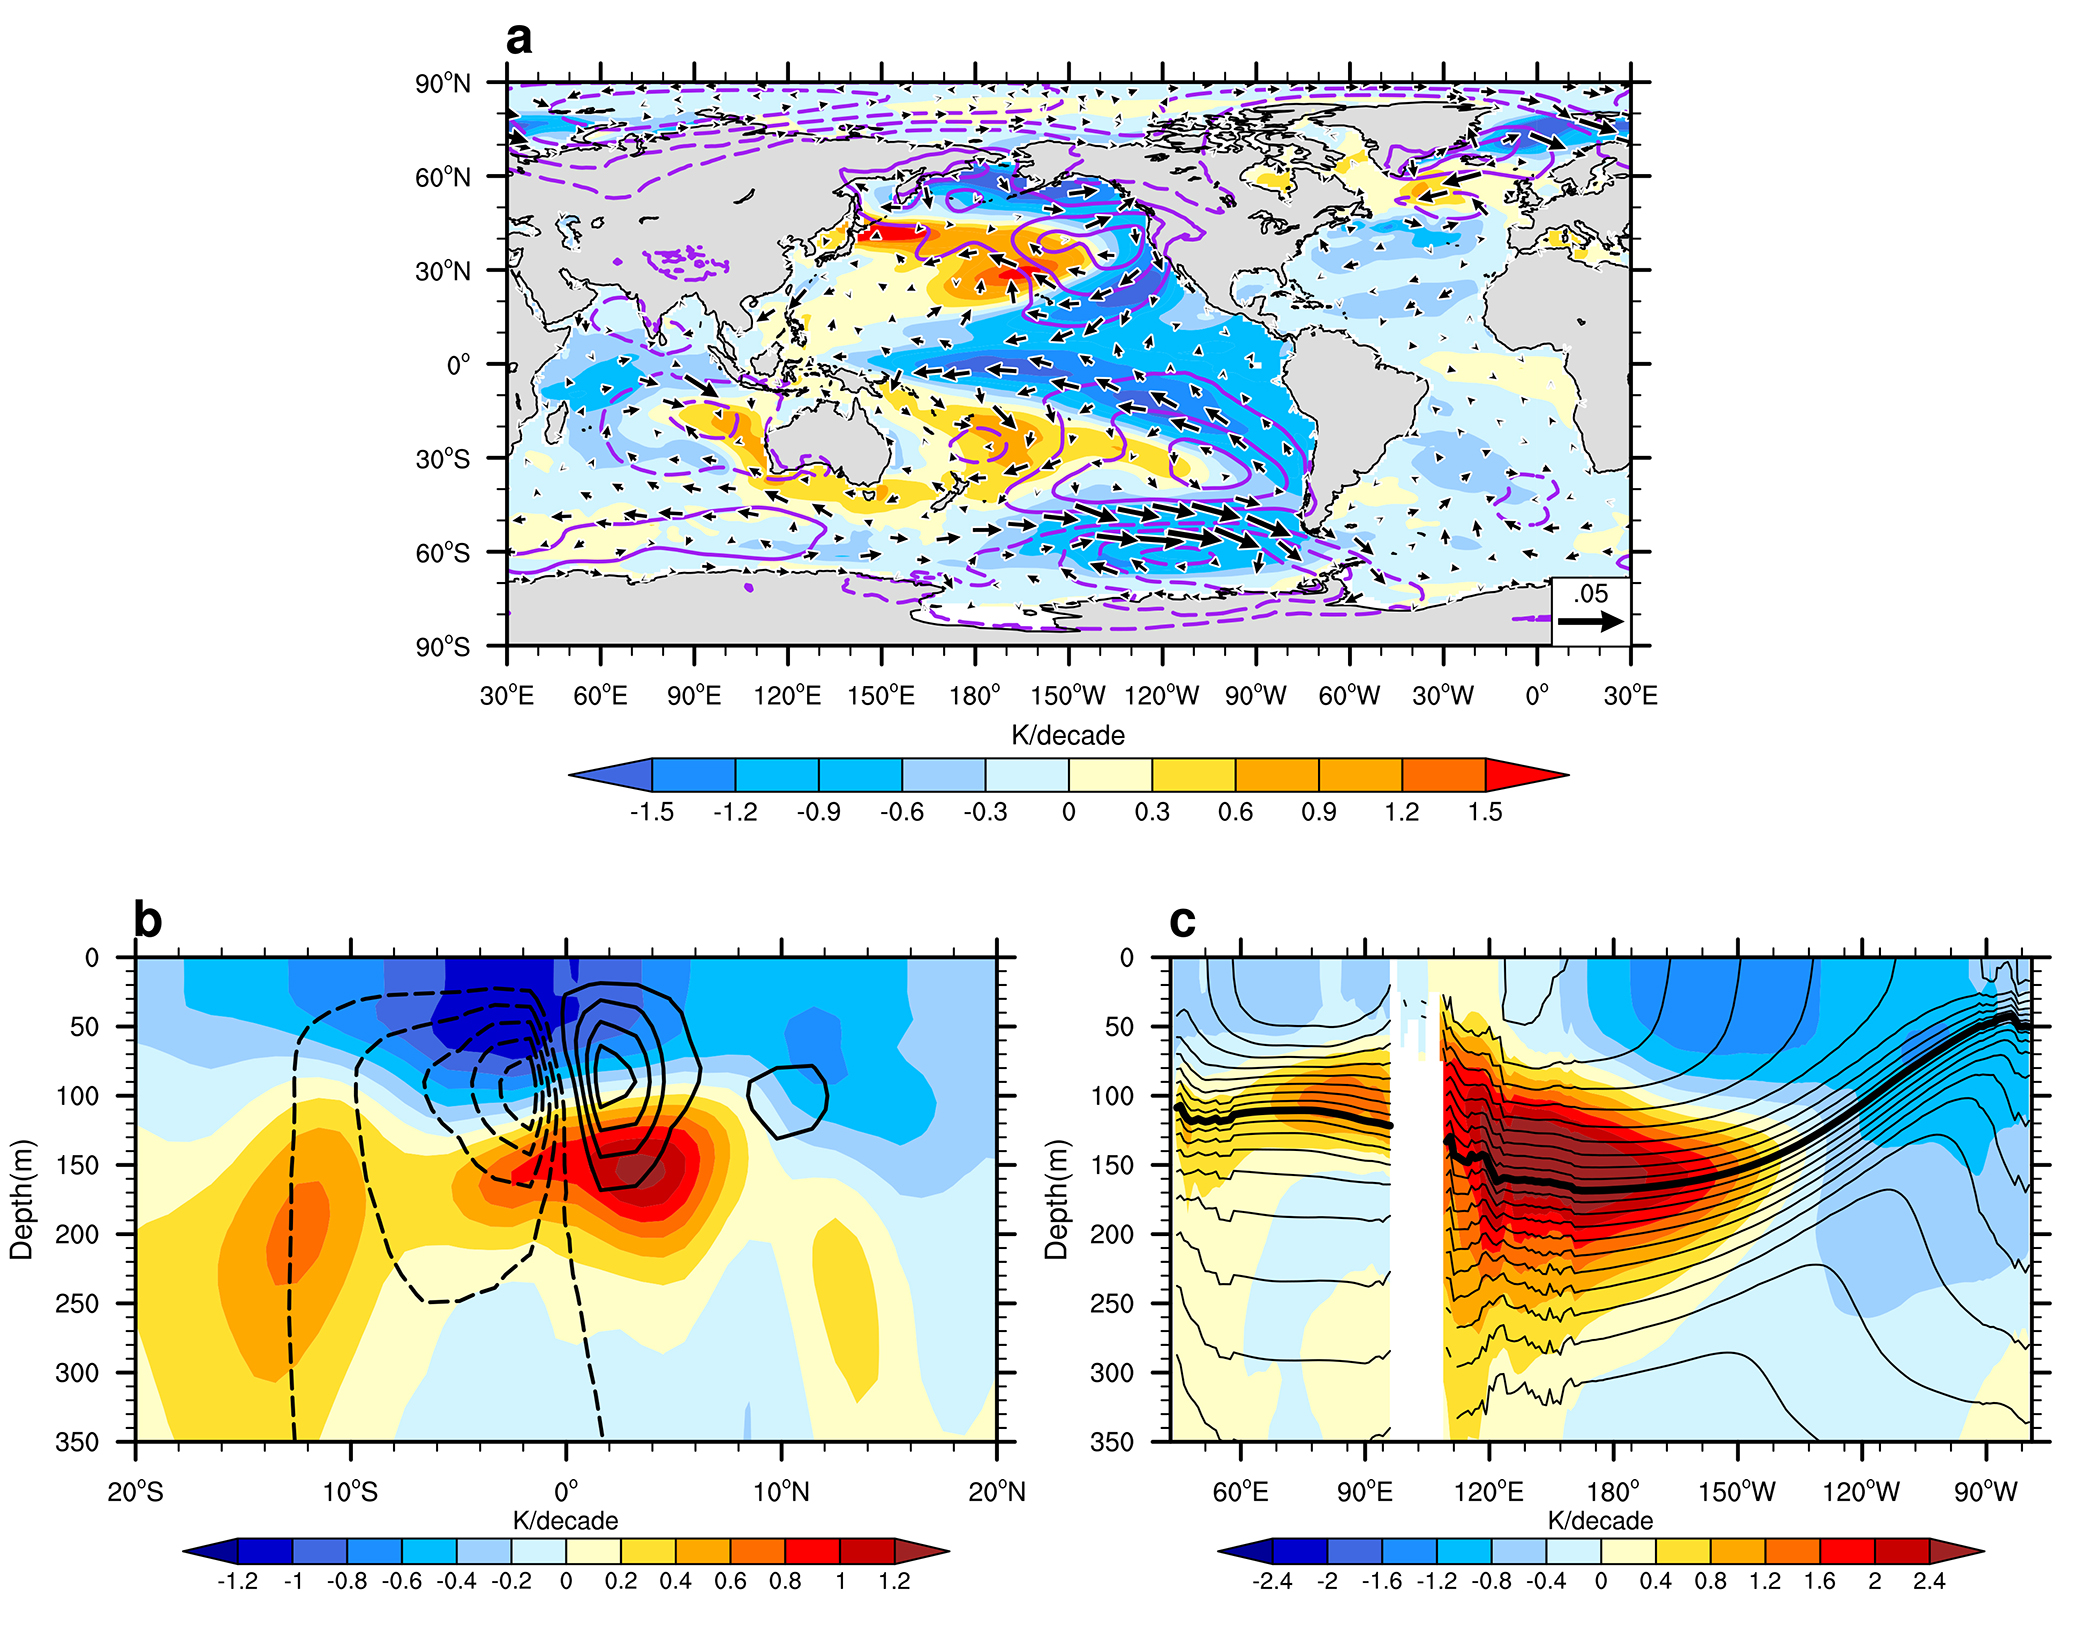
Figure 4. (a) Trend differences of SST (shading in K per decade), sea level pressure (contour interval of 80 Pa per decade, with zero contours omitted), and surface wind stress (vector N m–2 per decade) between the ensemble means of the Community Earth System Model-Large Ensemble project (CESM-LE) Hiatus and Surge groups during 2002–2012. (b) The trend difference of zonal mean temperature (shading in K per decade) in the tropical Pacific, superposed on the trend difference of meridional overturning stream-function (contour, Sv per decade, with zero contours omitted). (c) The trend difference of temperature (shading in K per decade) along equatorial band 5°S–5°N in the Indian and Pacific Oceans. The mean isotherms during 2002–2012 (38-member CESM-LE ensemble mean) are also included as contours with an interval of 1°C. The 20°C contour is thickened to indicate the depth of thermocline. After Liu et al. (2016) which is licensed under a Creative Commons Attribution 4.0 International License http://creativecommons.org/licenses/by/4.0/. > High res figure
|
Along with this rearrangement in the tropical Pacific, heat is also redistributed between the tropical Pacific and Indian Oceans (Nieves et al., 2015; Liu et al., 2016). During the hiatus period, there is anomalous subsurface warming and an increase in OHC in the tropical Indian Ocean, mostly at the thermocline depth (70–150 m). One cause of this warming is transport of anomalously warm tropical western Pacific waters into the Indian Ocean via the Indonesian passages (Lee et al., 2015). The Indonesian Throughflow (ITF) strengthens, and the ITF heat transport increases during the La Niña-like shift (England et al., 2014; Maher et al., 2017). In addition, the local climate response in the Indian Ocean helps to accelerate the OHC increase there (Liu et al., 2016).
Unlike the Indo-Pacific, the hiatus-related heat redistribution in the Atlantic and associated mechanisms are under debate. Chen and Tung (2014) suggest that the enhanced deep heat sequestration (300–1,500 m) in the Atlantic accounts for the 1998–2012 hiatus and results from a strengthened Atlantic Meridional Overturning Circulation (AMOC). However, Drijfhout et al. (2014) argue that, during the hiatus period, the heat uptake anomaly over the subpolar North Atlantic arises from reduced heat loss to the atmosphere, partly associated with atmospheric circulation changes and partly with less vertical mixing and a declining AMOC.
To examine the relationship between GMST, Atlantic OHC, and AMOC, we show the evolution of observed GMST, AMOC strength, and Atlantic OHC over a time span covering the recent hiatus period (Figure 5). Comparison of the evolution of GMST to Atlantic OHC shows that Atlantic heat sequestration is not in sync with a global surface warming hiatus. The Atlantic OHC shows an enhanced increase from 2000 but decreases after 2005. The decreased OHC coincides with a declined AMOC during the same period (Jackson et al., 2016), both of which show a mid-2000s shift. However, Somavilla et al. (2016) argue that this shift could instead be related to a transformation of mode waters in the eastern North Atlantic. In other words, the relationship between the decadal variability of the GMST, Atlantic basin-integrated OHC, and the AMOC remains unclear. Possible reasons are: (1) in addition to the AMOC, factors such as wind stress via Ekman transports (Williams et al., 2013) could be important; and (2) changes in ocean circulation can generate OHC anomalies of opposite signs between different ocean layers and regions (e.g., subtropical versus subpolar gyre), whereas these anomalies are compensated when integrated at the ocean basin scale and decadal timescales (Lozier et al., 2008). Over the subpolar region, OHC is highly correlated with the AMOC due to the strong influence of the North Atlantic Oscillation (Robson et al. 2016).
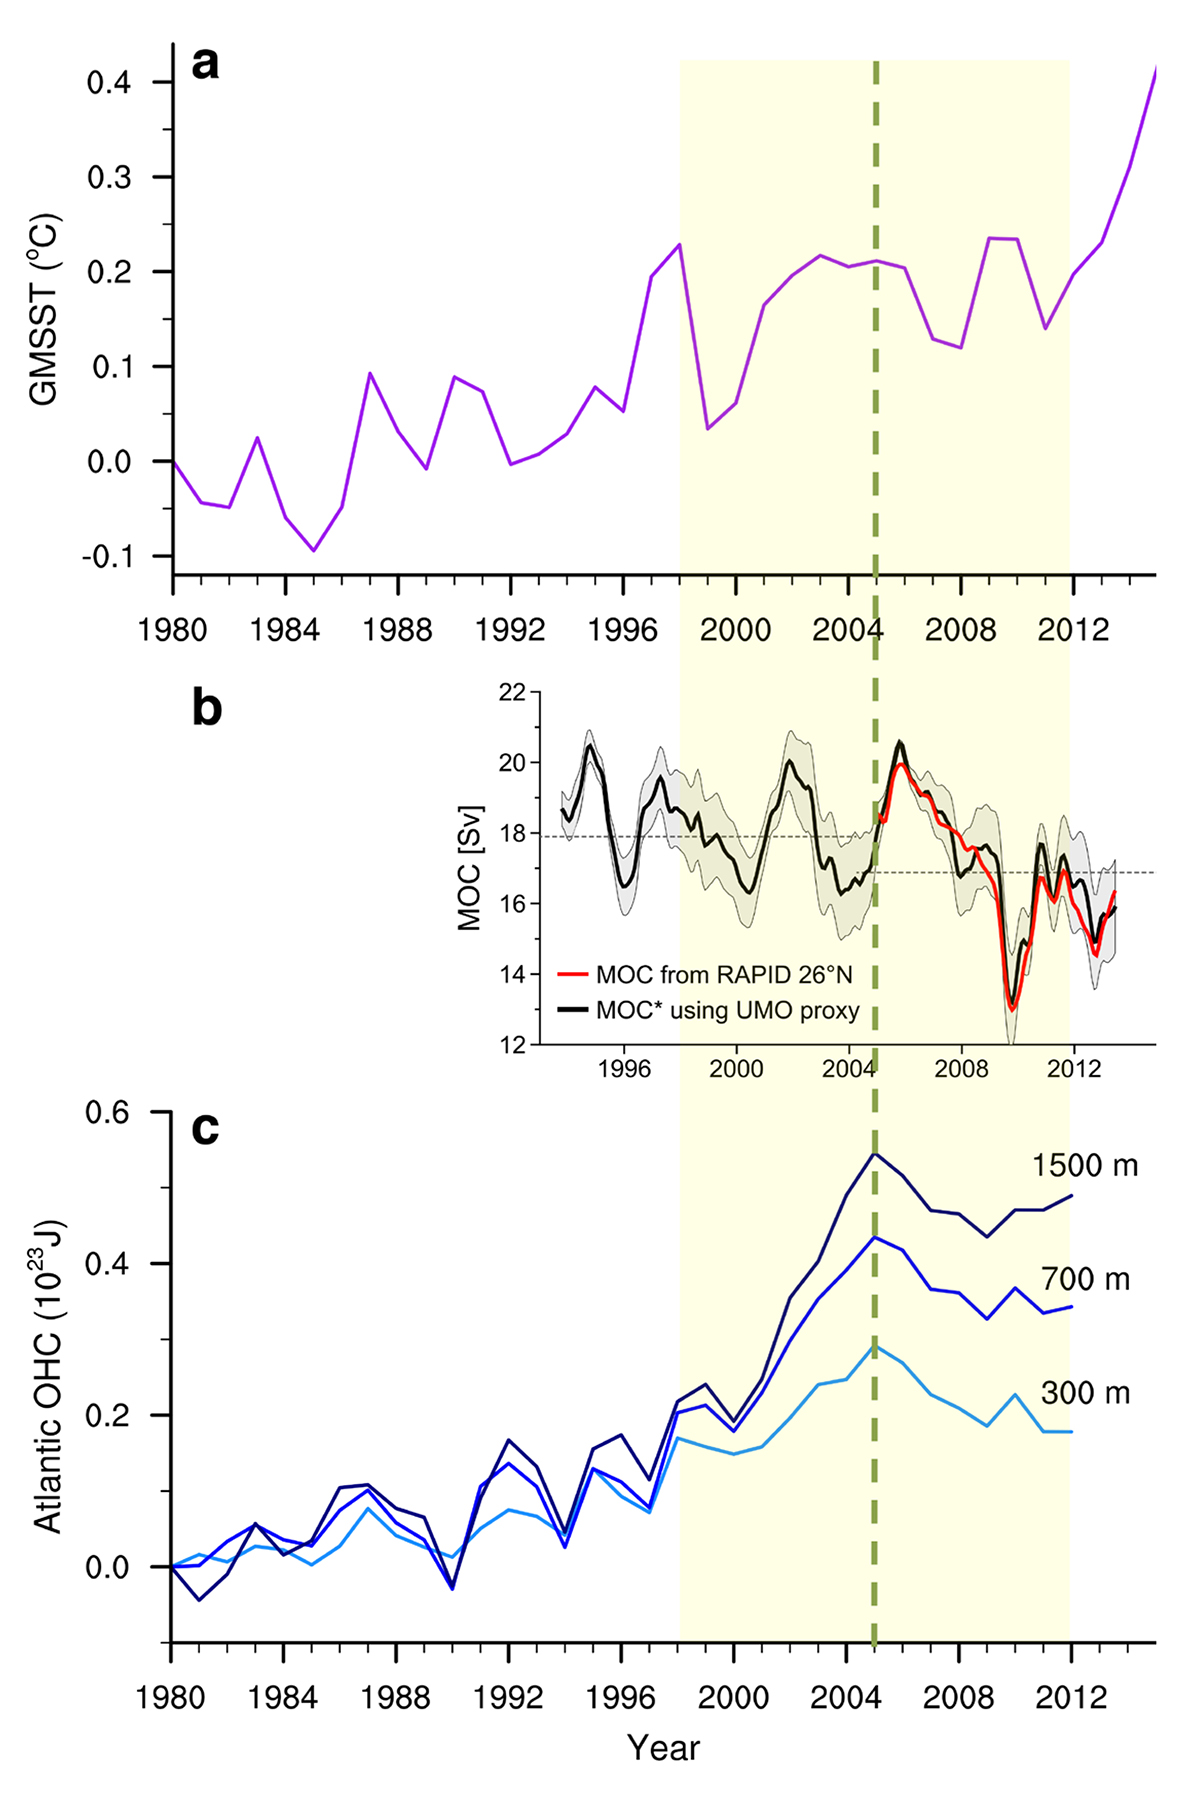
Figure 5. (a) Annual-mean GMSST anomalies relative to 1980–2015 average based on the ensemble mean of six SST data sets in Figure 1 (purple). (b) Meridional overturning circulation (MOC) transports from RAPID array observations at 26°N in the Atlantic (red; Srokosz and Bryden, 2015) and estimated MOC* from the sea level anomalies (SLA) proxy for upper mid-ocean (UMO, black) in the Atlantic. Gray shading indicates the uncertainty associated with the slope of the regression between SLA and UMO. (c) OHC (relative to the year 1980) integrated from the surface to 300 m (light blue), 700 m (blue), and 1,500 m (deep blue) depths over the Atlantic basin (from 34°S to around 80°N, see Liu et al., 2016) based on Ishii et al. (2005) data. The yellow shading denotes the 1998–2012 hiatus period and the green dashed line denotes a mid-2000s shift. Panel (b) is adapted from Frajka-Williams (2015). > High res figure
|
Summary and Discussion
The recent global warming hiatus highlights that natural variability is large enough to modulate the rate of global surface warming over a decade and longer. This hiatus has attracted broad interest from the climate variability and climate change communities. Variability associated with the IPO and the AMO has been found to be crucial. The hiatus is associated with the transition of the IPO from positive to negative phase and heat redistribution between the tropical Pacific and Indian Oceans. By restoring SST or winds over the tropical Pacific to observations, pacemaker experiments can adjust the Pacific variability into a negative IPO phase, and they can thus enable climate models to reproduce the hiatus. Meanwhile, the AMO is shifted to a positive phase around the onset of the hiatus, in favor of a La Niña-type response over the tropical Pacific via a tropical-wide teleconnection. This interbasin interaction further contributes to the hiatus.
Active debate continues due to limitations in both observations and climate models. One major problem with observations is the uncertainty of OHC estimates. Over the Southern Ocean—a region critical to ocean heat uptake and storage (Liu et al., 2018)—observations were sparse until the deployment of Argo floats during the first decade of this century (Roemmich et al., 2015). Meanwhile, historical measurements from instrumentation, such as expendable bathythermographs, have notable biases in depth and temperature (Lyman et al., 2010). Both factors contribute to large uncertainty in estimating OHC (Loeb et al., 2012; Durack et al., 2014; also see Figure 1d). Regarding models, they cannot simulate the hiatus event during the specific period of 1998–2012 (Meehl et al., 2011, 2013) except for some ensemble members that happen to transition into a negative IPO phase during the period (Meehl et al., 2014; Liu et al., 2016). Also, most climate models use laminar (coarse resolution) oceanic components where mesoscale effects are crudely parameterized. Recent papers (Sérazin et al., 2017; Leroux et al., 2018) show that AMOC variability, as well as OHC variability and multidecadal trends acquire a chaotic behavior in turbulent ocean models (Penduff et al., 2018, in this issue), suggesting that the natural variability simulated by coarse-ocean climate models is underestimated. Given limitations of observational estimates as well as model simulations, joint investigation of observations and model simulations for physical consistency is the best way forward.