INTRODUCTION
Through close cooperation, training, and education in modern ocean technology, oceanographic capacity-building between US academic and foreign institutions aims to improve local institutional infrastructure in order to collect observations and conduct mutually beneficial research. To this end, a collaborative program between Vietnamese government institutions, including the Vietnam Center for Oceanography (CFO), Administration of Seas and Islands (VASI), and the Ministry of Natural Resources and Environment (MONRE), and US scientists from Scripps Institution of Oceanography (SIO), Oregon State University (OSU), and Rutgers University was initiated in 2014 to study forcing factors and responses to them within the Gulf of Tonkin using modern numerical models and observational techniques. Part of the joint effort was to collect, assemble, and synthesize historical observations, including from the Naga expedition surveys (1959–1961), Soviet-Vietnam cooperation surveys (1989–1995), various scientific campaigns reported in NOAA’s National Centers for Environmental Information, and other cooperative programs. The historical data provide an essential climatological framework for assessing modern data sets, such as high-frequency (HF) radar, in our joint analysis of oceanographic processes within the Gulf of Tonkin.
The oceanography of the South China Sea has been well documented through numerous in situ and numerical modeling studies (e.g., Centurioni et al., 2004, 2009; Simmons et al., 2011), which often focused on the generation and propagation of the largest recorded internal waves in the global ocean (e.g., Alford et al., 2010). Comprehensive reviews of many of these field studies over the past decade can be found in Cai et al. (2012) and Guo and Chen (2014). Despite its significant geographic location, published papers regarding the oceanography of the Gulf of Tonkin are few (Gao et al., 2017), often byproducts of larger-scale studies of the South China Sea (e.g., Gan et al., 2006; Chern et al., 2010). In the limited numerical studies available for the region (e.g., Wyrtki, 1961; Guan and Chen, 1961; He, 1987; Yu and Liu, 1993; Manh and Yanagi, 2000; Sun and Huang, 2001), forcing fields were often idealized (e.g., climatological boundary and/or surface forcing, or homogeneous density field) or neglected completely (e.g., riverine freshwater discharge or tides). These models typically focused on a single process or on a single time period based on few observations, and they were also limited by a lack of observations in the western side of the Gulf of Tonkin, including the Red River coastal plumes. In a review of work to date, Gao et al. (2017) define a scientific gap resulting from limited hydrodynamic studies, lack of recent observations, and often controversial findings, confirming a need for further studies to attain a complete description of the Gulf of Tonkin seasonal dynamics.
Here, we synthesize the first results from the US-Vietnam Gulf of Tonkin collaborative program using data sets collected along the data-poor western portion of the gulf, including satellite imagery, HF radar-based surface currents, and repeat (monthly) coastal hydrography. The persistent feature among the data sets is seasonally variable coastal plumes from the Red River. For larger-scale seasonal circulation assessments, including the seasonal variability of coastal plumes along the Vietnamese coast, we utilize an observationally calibrated high-resolution numerical model. Surface currents measured by free-drifting wave buoys illustrate seasonal surface circulation responses as well as responses generated by intermittent storm forcing. In addition, we present the rapidly changing HF radar surface current response to an approaching typhoon as an example of higher frequency variability generated by episodic storm events.
STUDY REGION
The Gulf of Tonkin, also known as the Beibu Gulf, is a semi-enclosed basin approximately 270 km wide. It connects with the Vietnamese East Sea to the south and with Chinese shelf waters through Hainan Strait (also known as the Qiongzhou Strait) to the northeast (Figure 1). The Red River is the primary riverine discharge into the shallow gulf (water depths <100 m), with less significant freshwater inputs from smaller rivers along the northern coast of the Gulf of Tonkin (Guangxi region). Generally, the climate is wet during summer and dry during winter, resulting in higher freshwater discharges during the summer months. The maximum discharge from the Red River occurs in August at a rate of >1.0 × 10⁴ m3 s–1 (Chen et al., 2012a,b), approximately 10 times larger than the sum of runoff rates from all remaining rivers along the Guangxi coast (Ding et al., 2013). Red River plumes can propagate long distances along the coast as coherent structures, significantly impacting marine ecosystems through along-shelf transports of freshwater, nutrients, larvae, pollutants, and sediment (Mazzini et al., 2014). In addition, the sharp density fronts generated between the coastal flows and offshore waters block exchange processes and affect continental shelf dynamics through modification of ocean stratification.
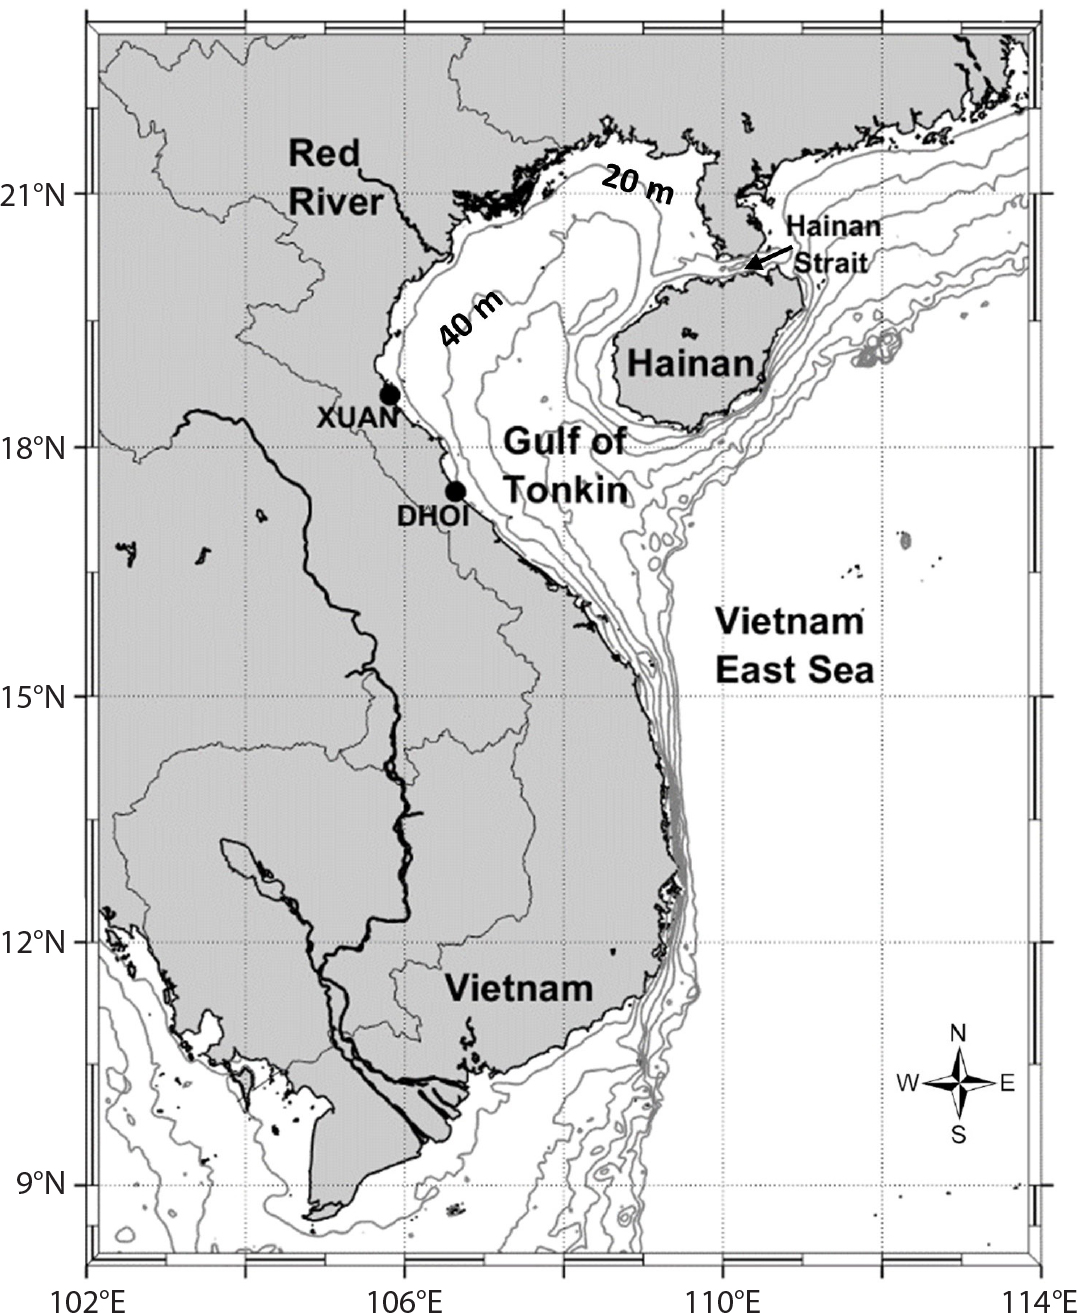
Figure 1. Map of Vietnamese coastal waters overlaid with 20 m depth contours. Black dots indicate two HF radar stations located at Nghi Xuan (north) and Dong Hoi (south). > High res figure
|
The East Asian monsoon dominates oceanographic conditions in the region. Northeasterly (from the northeast) winds blow from September through April (winter season) and southwesterly winds during summer (Manh and Yanagi, 2000), resulting in major seasonal changes in momentum and buoyancy. The transition to the summer monsoon season (May through August) occurs consistently at the end of May, with atmospheric conditions dominated by low-level southwesterlies. Conversely, the transition to the dry season is gradual, beginning in September, with the mean winds slowly changing direction to northeasterlies over a three-month period.
Tidal waves enter the Gulf of Tonkin from the southeast and are partly reflected in its northern portion. Its geometry is resonant to diurnal tides that greatly amplify within the Gulf (Fang et al., 1999; Zu et al., 2008; Nguyen et. al., 2014). A detailed tidal analysis of the region can be found in Nguyen et al., (2014). The basin geometry, the tidally rich environment, the strong seasonal forcing due to the reversal of the monsoon winds, and the associated strong fluxes of heat and freshwater produce complicated seasonal circulation patterns within the gulf.
METHODS
Remote Sensing
Satellite Imagery
Collecting long-term in situ observations of ocean parameters (e.g., currents, salinity, and temperature) is logistically challenging and expensive, particularly near the surface because of the contaminating effects of waves and wind (Paduan and Rosenfeld, 1996). The temporal and spatial resolution needed to characterize complex mesoscale oceanic processes is generally not feasible using boat-based sampling techniques. Conversely, remote-sensing methods can provide near continuous synoptic observations over large regions of the ocean under most environmental conditions and for comparatively low operational costs relative to traditional in situ monitoring methods (e.g., no ship time, no deployment/recovery of instruments). For this study, satellite imagery and HF radar observations were used to assess the two-dimensional, near-surface seasonal variability of the Red River coastal currents that flow along the western portion of the Gulf of Tonkin. Collection of satellite data remains one of the most effective tools for monitoring the spatial and temporal patterns of turbid water (Binding et al., 2003; Figueras et al., 2004). Increased concentrations of suspended matter and colored dissolved organic matter (CDOM) in coastal waters shift the spectrum toward longer wavelengths (Bukata et al. 1983). Radiometers integrated onto satellites measure radiance in specific spectral bands of the visible spectrum and can be related quantitatively to various constituents in the water column, including chlorophyll, CDOM, and suspended matter (Figueras, et al., 2004).
The normalized water leaving radiance at 555 nm wavelength (nLw555) is an effective tracer of turbidity and CDOM in the water column, which in turn allows for delineation of buoyant coastal flows (Thomas and Weatherbee, 2006; Saldías et al., 2016). Charts of monthly averages of the weekly (eight-day) level 3 mapped 555 nm water leaving radiance product (9 km resolution) observed by the Moderate Resolution Imaging Spectroradiometer (MODIS) on the Terra satellite from 2007 to 2016 (the same integration period as the numerical model) were developed for the Gulf of Tonkin region to assess interannual remotely sensed coastal plume variability. Ocean color products used as part of this study were developed, validated, and distributed by ACRI-ST, France (Maritorena et al., 2010).
HF Radar Observations
Hourly surface current observations from two long-range (5 MHz) HF radars located at Nghi Xuan (XUAN) and Dong Hoi (DHOI) were used to assess seasonal variability of surface currents between the sites (Figure 1). HF radar relies on ocean surface roughness (e.g., waves) to derive surface currents from the measured Doppler return of Bragg waves consistent with the frequency of the radar; however, the sea state within the Gulf of Tonkin tends to be less energetic than many HF radar sites (e.g., Kohut et al., 2006; Kim et al., 2008; Ramp et al., 2008), limiting radial coverage and the derived surface current observations (Liu et al., 2010). Regardless, two years of monthly averaged HF radar observations, from June 2014 through July 2016, were used to assess the seasonal temporal and spatial variability of the Red River coastal currents. A minimum monthly data availability threshold of 10 days (i.e., data available approximately 33% of the time) was used to compute the averages.
Monthly Coastal Hydrography Surveys
Offshore of the XUAN radar site, the OSU team, in collaboration with staff from the Vietnamese CFO, collected monthly, boat-based, CTD profiles to assess the seasonal variability in the nearshore portion of the Red River coastal plume at depth. Water column observations of temperature and salinity were acquired along a 25 km cross-shelf survey line with 2.5 km spacing and 0.5 m vertical resolution from September 2015 to August 2016. Each month, one section was completed over two to three consecutive days (depending on weather conditions), using an RBR Concerto sensor at 16 Hz deployed by hand-line from a local fishing vessel.
Numerical Modeling
The Rutgers University team implemented the Regional Ocean Modeling System (ROMS), a split-explicit, free surface, topography-following coordinate oceanic model to describe the seasonal dynamics of the Gulf of Tonkin. ROMS is open source and is widely accepted and supported by the oceanographic and modeling communities (see Shchepetkin and McWilliams, 2005, for detailed information on ROMS).
The Gulf of Tonkin ROMS application, integrated for 10 years (2007–2016), was calibrated to be compatible with the large collection of historical and modern observations we assembled (Figure S1), resulting in a robust synthesis of the Gulf of Tonkin seasonal cycle. The spatial resolution is 6.5 km in the horizontal direction, and 40 terrain-following levels define a variable vertical resolution that increases gradually toward the surface. This resolution was sufficient to model the seasonal dynamics, but it is likely inadequate to resolve submesoscale dynamics associated with the Red River plume. However, the vertical resolution was good enough in shallow areas to resolve the thin vertical stratification (~5 m) associated with the Red River plume. Wind forcing in the model is provided by ERA-Interim winds (Dee et al., 2011), which we also use throughout this paper (unless otherwise noted) to describe periodic wind conditions.
Miniature Wave Buoy Deployments
Surface drifters have commonly been used to assess surface circulation patterns within the South China Sea (e.g., Centurioni et al., 2004, 2009), and a limited number of drifters have circulated within the Gulf of Tonkin (Figure S2). To collect surface observations from this data-poor region, SIO provided the Vietnamese CFO with SIO-fabricated wave-sensing miniature wave buoys (MWBs), drogued at 1 m, for periodic deployments approximately 25 km offshore of XUAN. The GPS-enabled buoys (Figure S1b) measure wave parameters from the Doppler shift in GPS signals to obtain the buoy’s horizontal and vertical velocities. The resulting three-axis GPS velocity data are transformed and integrated in the spectral domain to plot wave displacement spectra, which are used to compute bulk wave statistics and directional spectra (Long, 1980; de Vries et al., 2003). Several of the deployed MWBs traveled the length of the Vietnamese coast, exited the Gulf of Tonkin, and intersected the western boundary current near 16°N (Figure 1). In addition to along-track observations of wave statistics, buoy speed was used to infer along-track current variability, and showed good agreement with HF radar-derived surface currents from previous studies. Three buoys deployed by CFO on March 11, August 25, and November 29, 2017, were used to qualitatively assess along-coast current variability and the mechanisms responsible for their observed trajectories out of the Gulf of Tonkin.
RESULTS
Remote Sensing
Satellite Imagery
The prominent features in monthly satellite imagery of the Gulf of Tonkin were the seasonal fluctuations in the Red River coastal plume as mapped by elevated monthly nLw555 values along the Vietnamese coast. From spring to summer, weaker onshore winds transition to an offshore direction, resulting in a less-defined satellite coastal signature (Figure 2a). However, as the summer winds shift back to an onshore direction (northeast) during the winter, a more prominent coastal plume develops (Figure 2b) and becomes a nearshore (30 km), coherent signal that reaches peak radiance values in November and December (Figure 2c). With the onset of spring, onshore winds weaken and freshwater discharge from the Red River is at its minimum, coinciding with the dissipation of the coastal water mass as depicted by a reduction in elevated monthly nLw555 values south of XUAN (Figure 2d).
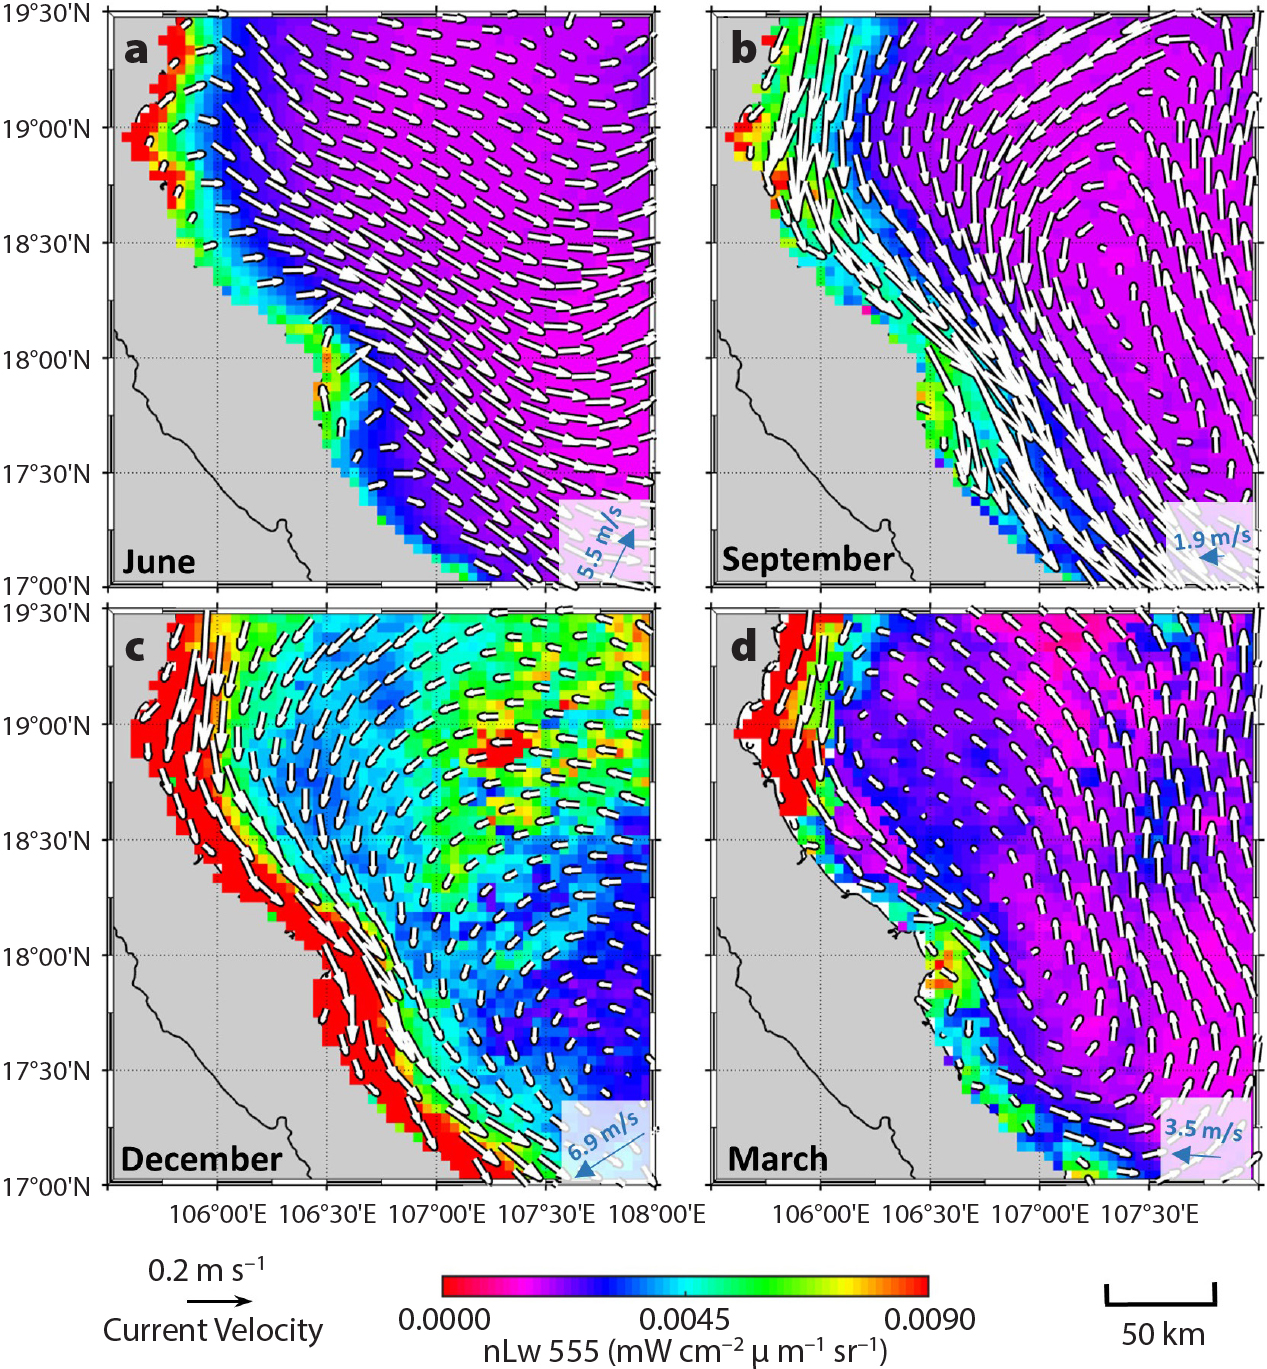
Figure 2. Monthly averages (from 2007 to 2016) of the weekly (eight-day) level 3 mapped 555 nm normalized water leaving radiance (nLw555) product from the Moderate Resolution Imaging Spectroradiometer (MODIS) on NASA’s Terra satellite for the western portion of the Gulf of Tonkin for (a) June, (b) September, (c) December, and (d) March. Averaged monthly model-derived current vectors from 2007 to 2016 overlay each image. ERA-averaged monthly wind speed and direction for the data period are provided in the lower right of each figure (blue vectors). > High res figure
|
HF Radar Observations
The coverage area of remotely sensed surface current observations depended on sea state within the Gulf of Tonkin. Low sea state conditions resulting from offshore winds during the summer limited data availability. Conversely, larger sea states from onshore winds (i.e., longer fetch) consistently resulted in larger coverage areas and increased data availability. In general, coverage areas were observed to decrease rapidly for significant wave heights less than 1 m, consistent with a previous study in a low energy environment by Liu et al. (2010). Despite summer data limitations, monthly averaged surface current observations exhibited similar seasonal variability, as illustrated by satellite imagery (Figure 3).
During summer, when data were available, little evidence of the coastal current was observed offshore of DHOI (Figure 3a). As winds transition to an offshore direction in the fall, a pronounced coastal plume develops, with the largest surface current velocities observed from September to November. The monthly averaged HF radar surface current observations from October illustrate an approximately 100 km wide coastal plume that weakens along the southern extent of the coverage region (Figure 3b). As onshore winds increase during December, the plume narrows and becomes confined along the Vietnamese coast, with an observed decrease in currents from previous months (Figure 3c). By March, the velocities within the coastal plume weaken by approximately 25 cm s–1 from December values as winds decrease, beginning the transition to an offshore wind direction prevalent during the summer monsoon season (Figure 3d).
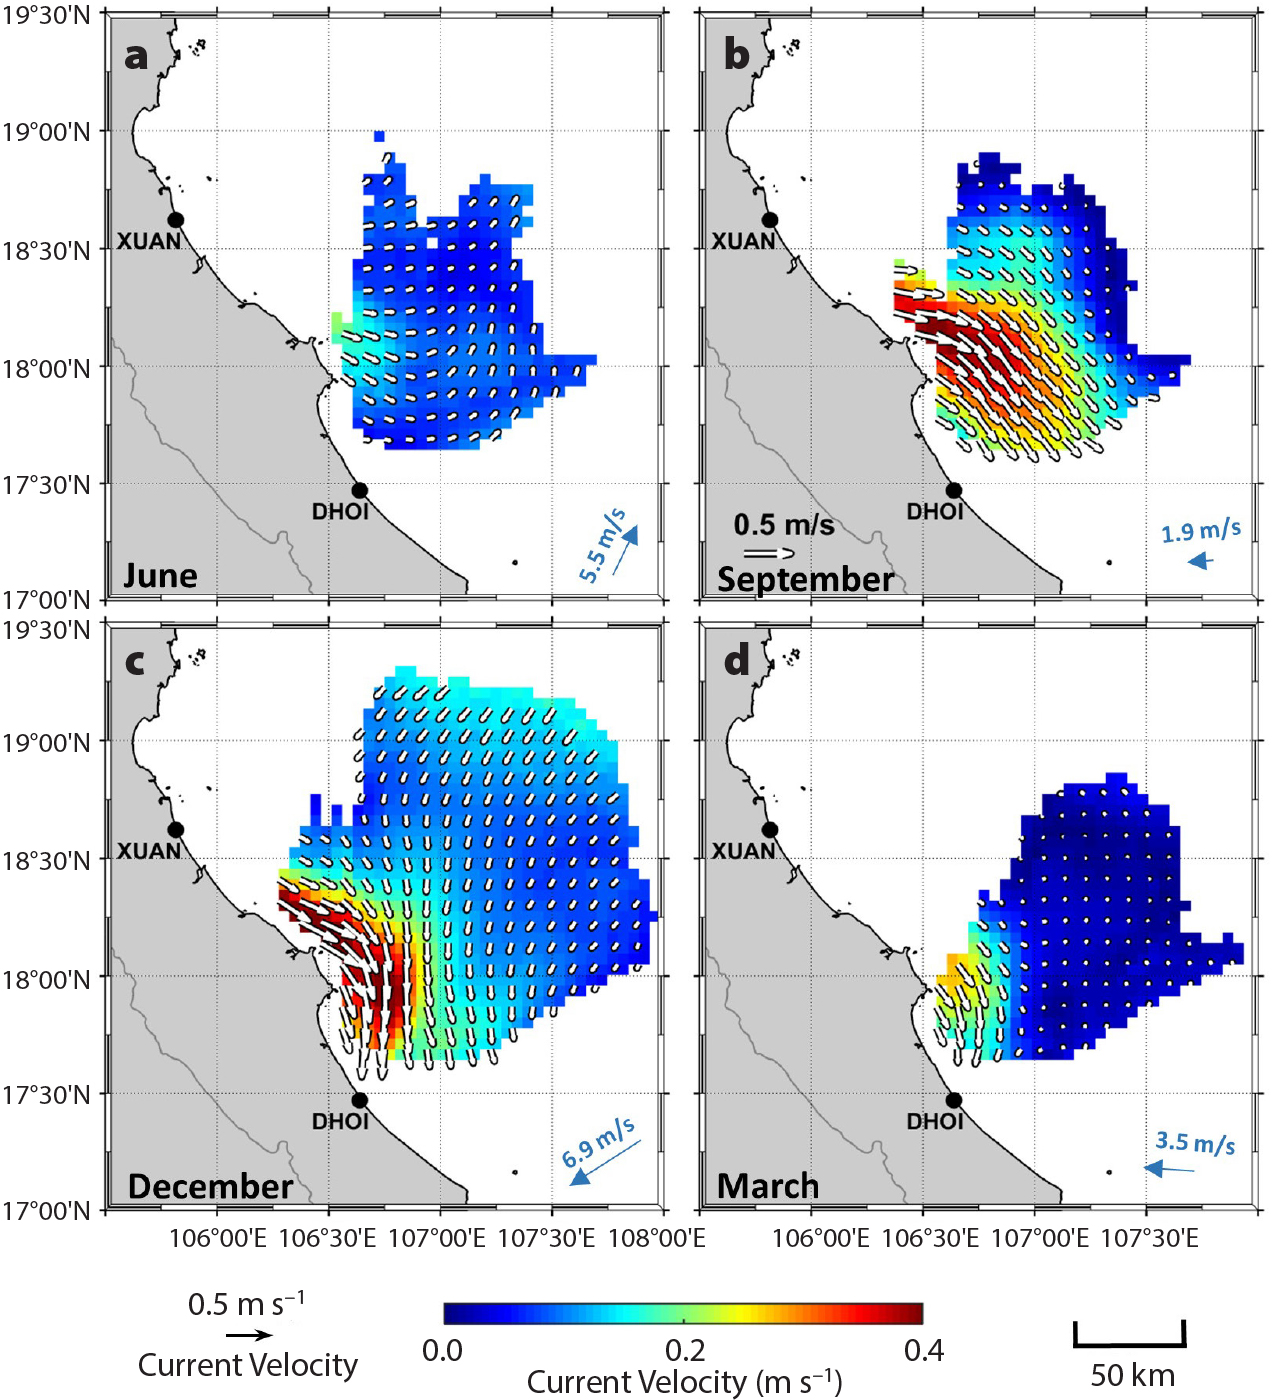
Figure 3. Monthly averaged HF radar-observed surface current magnitudes and corresponding current vectors along the western portion of the Gulf of Tonkin from June 2014 to June 2016. Surface currents are derived from radial data collected at the XUAN and DHOI radar sites for (a) June, (b) September, (c) December, and (d) March. ERA averaged monthly wind speed and direction for the data period are provided in the lower right of each figure (blue vectors). > High res figure
|
Monthly Coastal Hydrography Surveys
Remote-sensing observations were used to map the two-dimensional (i.e., surface) seasonal evolution of the Red River coastal plume within the Gulf of Tonkin. To characterize the subsurface variability of the coastal plumes, we used observations of stratification from the monthly CTD data collected offshore of XUAN. Coastal currents can generally be classified as bottom trapped or surface advected (Chapman and Lentz, 1994; Yankovsky and Chapman, 1997). The majority of the cross-sectional area of a bottom trapped coastal current is in contact with the bottom, while a surface advected current is detached from the bottom (Mazzini and Chant, 2016). These classifications were evident from the monthly surveys that began on September 5, 2015, during the transition from southwest summer monsoon winds (offshore) to northeasterly winter winds.
The observed salinity stratification from the initial survey in September 2015 is indicative of a surface advected river plume (Figure 4a). The fresher plume waters are confined to the upper 5 m of the water column and extend beyond the survey line. During the following two months, the plume waters extended deeper into the water column and detached from the bottom between 10 km and 15 km offshore. The observed depth variability of the freshest waters ranged from the upper 10 m in October (Figure 4b) to a near-surface thin layer in November (Figure 4c). By December, the full across-shore extent of the plume was observed, with detachment from the bottom occurring near 10 m depth and approximately 10 km offshore (Figure 4d). The plume continued to evolve, becoming well mixed in January, with minimal stratification continuing through March (Figure 4f,g). During early to mid-summer, no river plume salinity signature was observed, but the CTD survey on August 22, 2016, shows a similar plume structure to that observed on September 5, 2015, suggesting a transition to a new seasonal cycle.
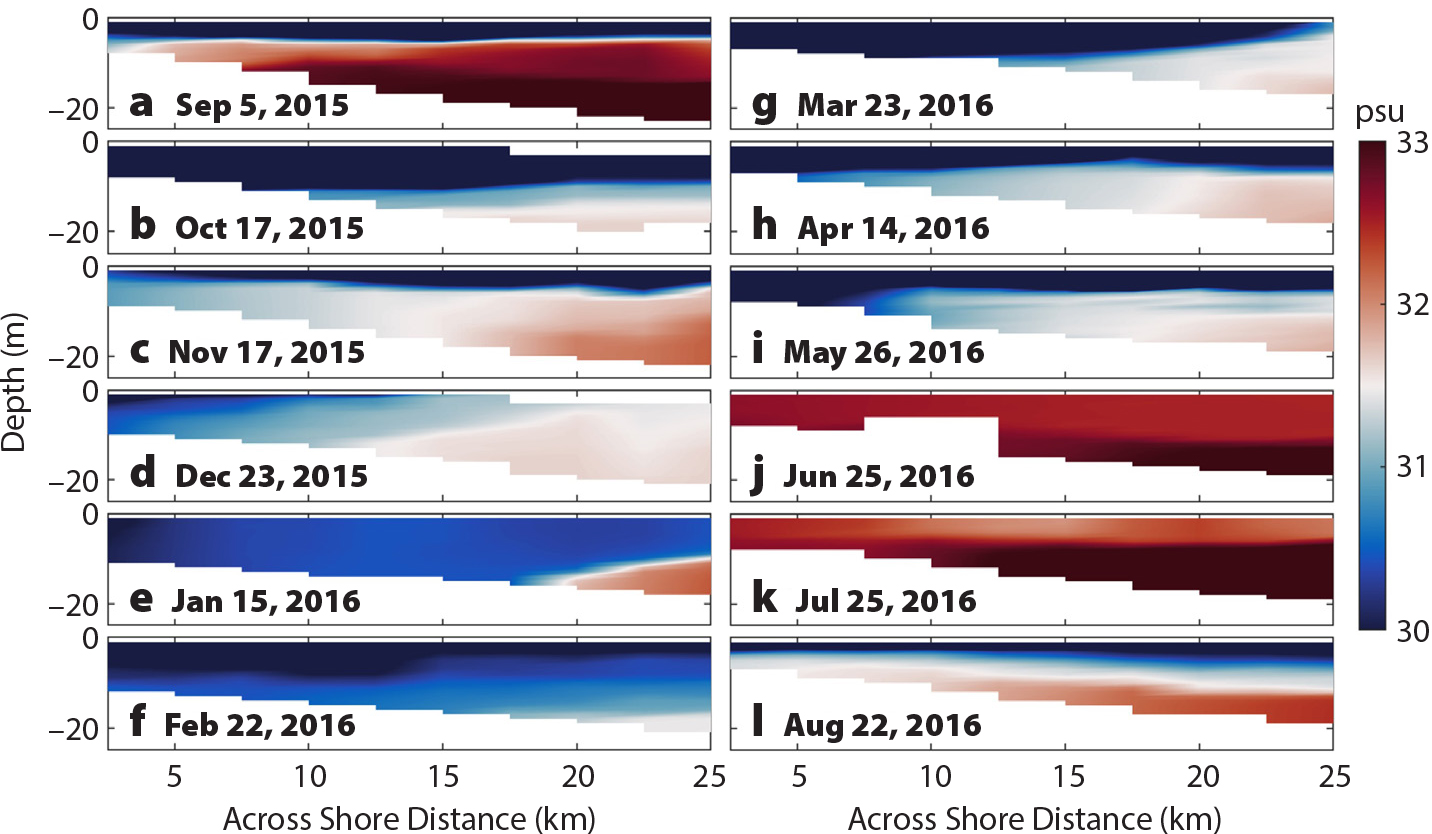
Figure 4. Summary of monthly salinity observations along a 25 km across-shore survey line that originates near the XUAN radar site. > High res figure
|
The dominant feature of in situ temperature (Figure S3) records is a seasonal cycle. Warmer water temperatures were observed over the entire water column along with increased thermal stratification in summer, and temperatures were cooler, with decreased (or non-existent) stratification, in winter. Superimposed on the seasonal cycle, the Red River coastal plume also exhibited a temperature signature for several of the monthly CTD surveys. The November 17, 2015, survey recorded coastal plume waters that were 0.5°C warmer than ambient waters, followed by a transition to plume waters that were 0.5°C cooler than surrounding waters during the two subsequent surveys in December and January. By March, coastal plume waters were observed to be significantly warmer than surrounding waters by 3.5°C, with larger differences of 6°C observed for April/May.
Numerical Modeling
HF radar-derived surface currents and CTD profiles confirmed the presence of a coastal plume, yet they failed to show its origin or the larger-scale processes responsible for the observed variability. The validated ROMS model, integrated over a 10-year period for the entire Gulf of Tonkin, provides seasonal circulation trends that drive the observed variability in our remotely sensed and boat-based observations. Model sensitivity experiments confirm the seasonal development of buoyancy-driven coastal plumes originating from the Red River. These plumes constitute a prominent feature that impacts the circulation of the western region of the Gulf of Tonkin and that needs to be included in seasonal assessments.
Seasonal wind reversals and freshwater discharge variability typical of the East Asian monsoon climate are the primary drivers of the Red River buoyant plumes. At the onset of the winter monsoon season, there is a transition from predominantly offshore (i.e., with respect to central Vietnam), southwesterly summer winds to onshore, northeasterly winds. As winds relax in September, a low-salinity water mass formed from increased freshwater discharge during the summer and trapped near the mouth of the Red River (Figure 5a) is “released” from the northern regions of the Gulf of Tonkin via a southward buoyant coastal jet (Figure 5b). An approximate one-month lag between peak Red River discharge (mid-August) and corresponding larger downcoast coastal flows is evident from model outputs, with the largest coastal flows occurring from September through November. As winter progresses, stronger downwelling-favorable northeasterly winds that blow south of the Red River mouth result in a narrower, more defined nearshore coastal current (Gao et al., 2013; Figure 5c). With the onset of spring, surface currents in the Gulf of Tonkin are generally weak, coinciding with minimum Red River discharge and the transition of winds from an onshore (winter) to an offshore direction (summer), as well as with an observed reduction in the alongshore extent of the plume (see Figure 5d).
The salinity fields from the model show an additional buoyant coastal flow from the Zhujiang (Pearl) River that migrates downcoast in August, eventually passes through Hainan Strait, and influences dynamics in the northern portions of the Gulf of Tonkin by December (Figure 5b,c). The Zhujiang River is China’s third largest river and has an annual mean transport similar to the Red River.
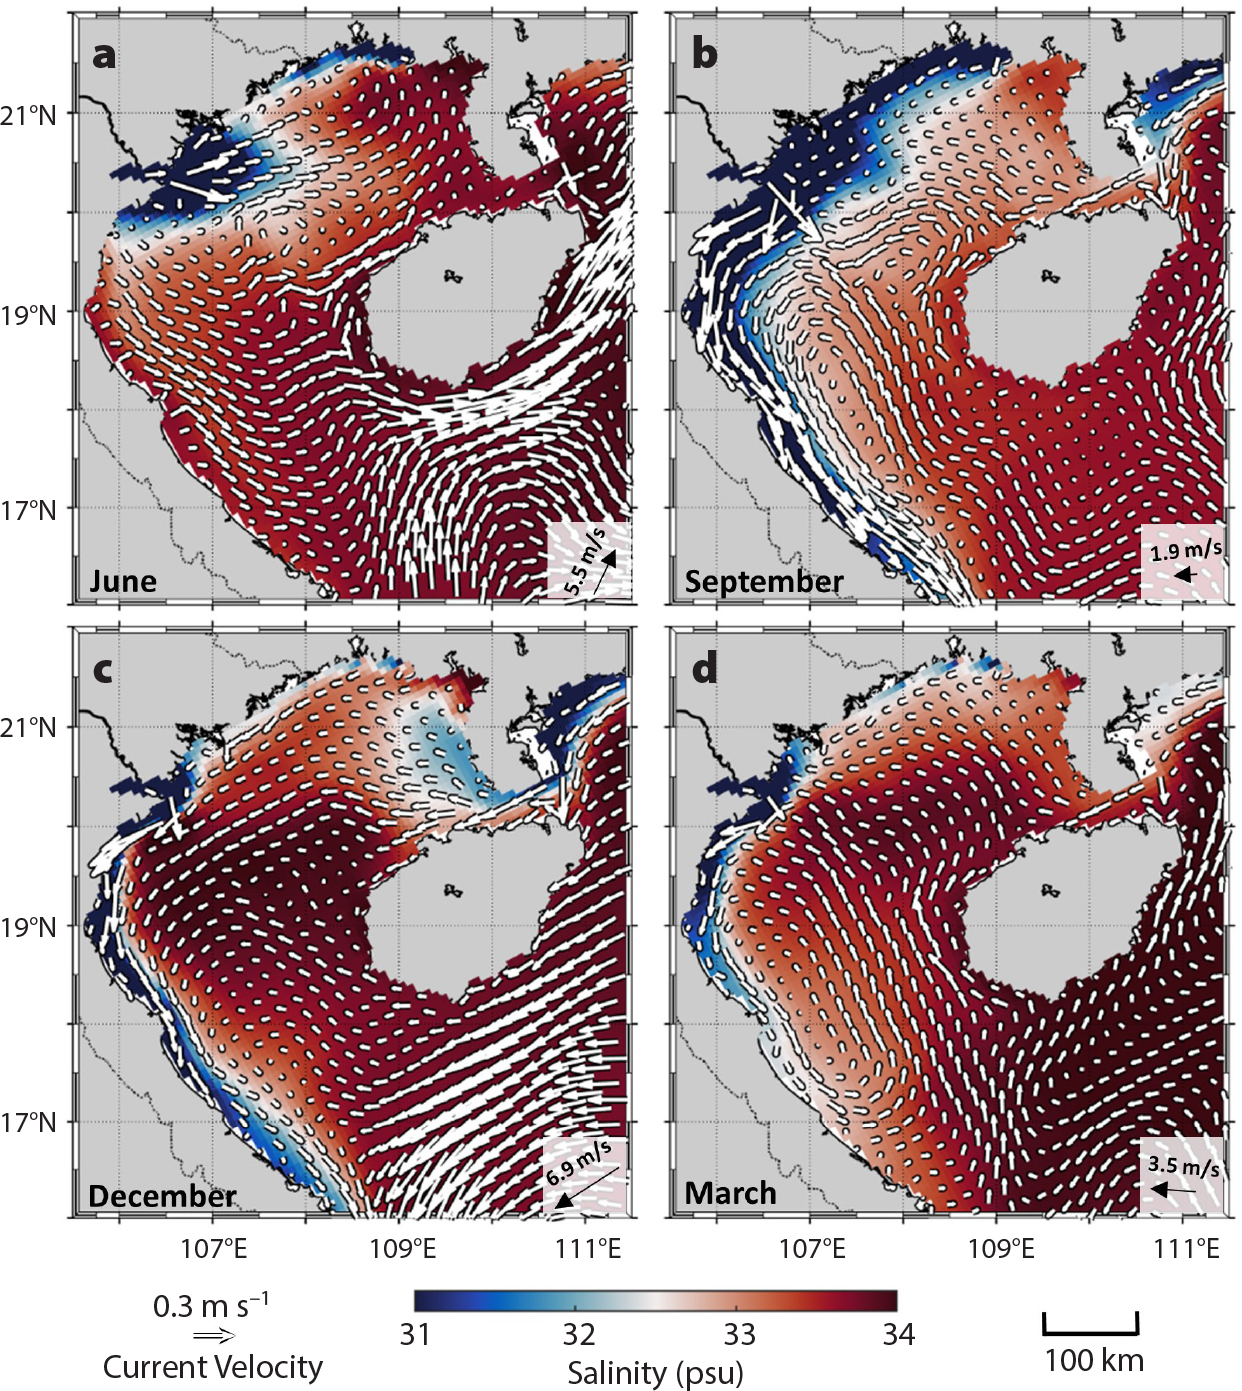
Figure 5. Regional Ocean Modeling System (ROMS) surface salinity of the Gulf of Tonkin region for a 10-year integration period (2007–2016) overlaid with corresponding model surface current vectors for (a) June, (b) September, (c) December, and (d) March. ERA-averaged monthly wind speed and direction for the data period are provided in the lower right of each figure (black vectors). > High res figure
|
Coastal Current Climatology
Model circulation results are in agreement with previous gulf-scale studies of the region that show the prominence of cyclonic flows during winter (Figure 6a). However, the circulation structure during summer remains a topic of debate and is generally classified into three proposed patterns: gulf-scale anticyclonic, gulf-scale cyclonic, and two-gyre structures (Gao et al., 2017). Our model simulations show a complex summer circulation pattern (June–August) in the northern gulf, while surface currents below 19°N primarily exit the gulf with significant surface flow circulating toward the southern end of Hainan Island and interacting with the western boundary current (Figure 6b). To better quantify the complex seasonal variability in the western gulf, we use Hovmoller diagrams showing 10 years of modeled surface currents (2007–2016) along two 200 km transects approximately shore-normal to XUAN and DHOI (Figure 6a). The normal component of the monthly averaged surface current velocity was computed at each model grid point along the transect (6 km resolution), providing a continuous illustration of the monthly across-shore current variability at XUAN and DHOI (Figure 6c,d).
A downcoast current persists throughout the year in the areas extending from both sites out to approximately 100 km offshore, but it transitions to a stronger, narrower current regime with the onset of the winter monsoon season. Model outputs show XUAN currents peak from September to November in a narrow (25 km) downcoast flow (Figure 6c), while a wider region (88 km) forms at DHOI beginning in mid-July (Figure 6d). The seasonal patterns are consistent with a shore normal HF radar transect approximately 40 km north of DHOI that shows stronger downcoast currents beginning in August and reaching a width of 75 km by September (Figure 6e). The model and HF radar surface current outputs both show a narrowing of the coastal jet during the winter monsoon when northeasterly winds peak. However, averaged currents during the winter monsoon season for the two years of HF radar observations were approximately 0.1–0.2 m s–1 larger than the model output averaged over the 10-year model integration period. Figure 6f,g illustrates surface salinity responses to seasonal intrusions of Red River flows offshore of XUAN and DHOI.
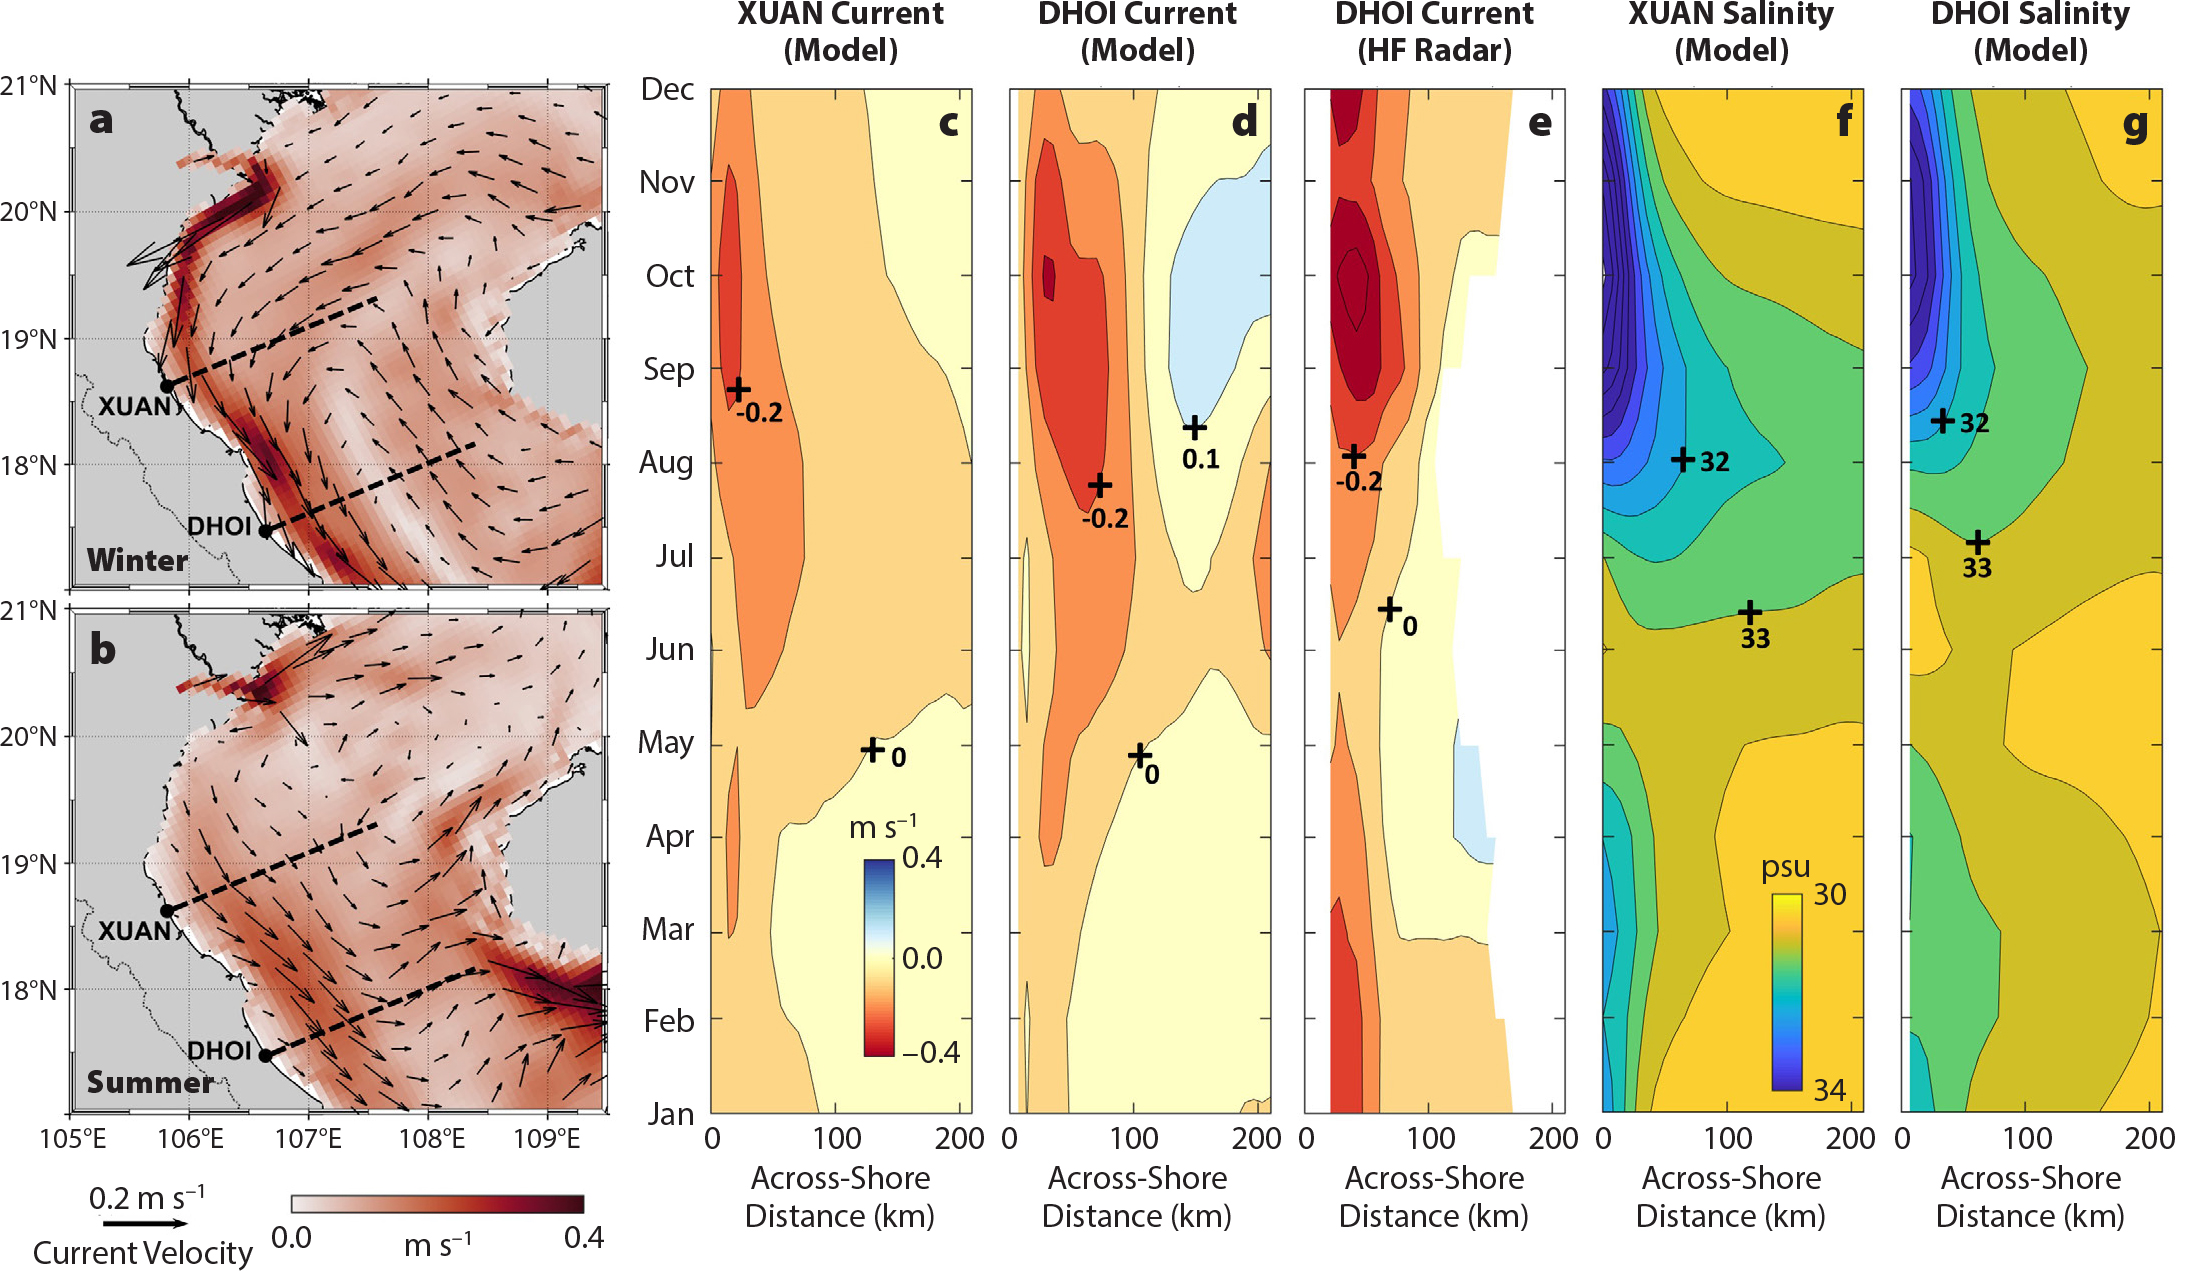
Figure 6. Seasonal averages of modeled surface current circulation for (a) winter (September–December), and (b) summer (June–August). Hovmoller diagrams of surface currents perpendicular to the across-shore transects (dotted lines in Figure 6a,b) at (c) XUAN (model output), (d) DHOI (model output), and (e) DHOI (HF radar observations). Positive currents indicate upcoast flow and negative values denote regions of downcoast flow. Surface salinity Hovmoller diagrams generated from model outputs are also provided along the (f) XUAN and (h) DHOI transects. > High res figure
|
Miniature Wave Buoy Deployments
Free-drifting MWBs deployed as part of the collaborative program provide observational insight into Gulf of Tonkin seasonal circulation patterns as well as higher frequency episodic events that modify the seasonal patterns. An MWB deployed on March 12, 2017, offshore of XUAN advected downcoast at a rate of 0.7 m s–1 and then decreased to 0.3 m s–1 beginning near 18°N (Figure 7a). Slow downcoast advection continued until 17.5°N, where the buoy stalled and began slowly migrating in a northerly direction. The northward movement of the buoy coincided with a region of weak cyclonic surface circulation offshore of the DHOI radar site (Figure 7a) that persisted for five days. A more energetic current regime resulting from the passage of a tropical depression on March 25, 2017, was the mechanism that finally migrated the buoy out of the region and returned it to its downcoast trajectory. The increased sea state resulting from the tropical depression was evident in significant wave height observations offshore of DHOI (Figure 7a). Over the course of the following week, the buoy continued to migrate downcoast at a speed of 0.5 m s–1 to 16°N, where it began to interact with the western boundary current. Once influenced by the western boundary current, the buoy moved quickly downcoast, as illustrated by increased spacing between MWB location reports, with speeds observed to range between 1 m s–1 and 2 m s–1 (Figure 7a).
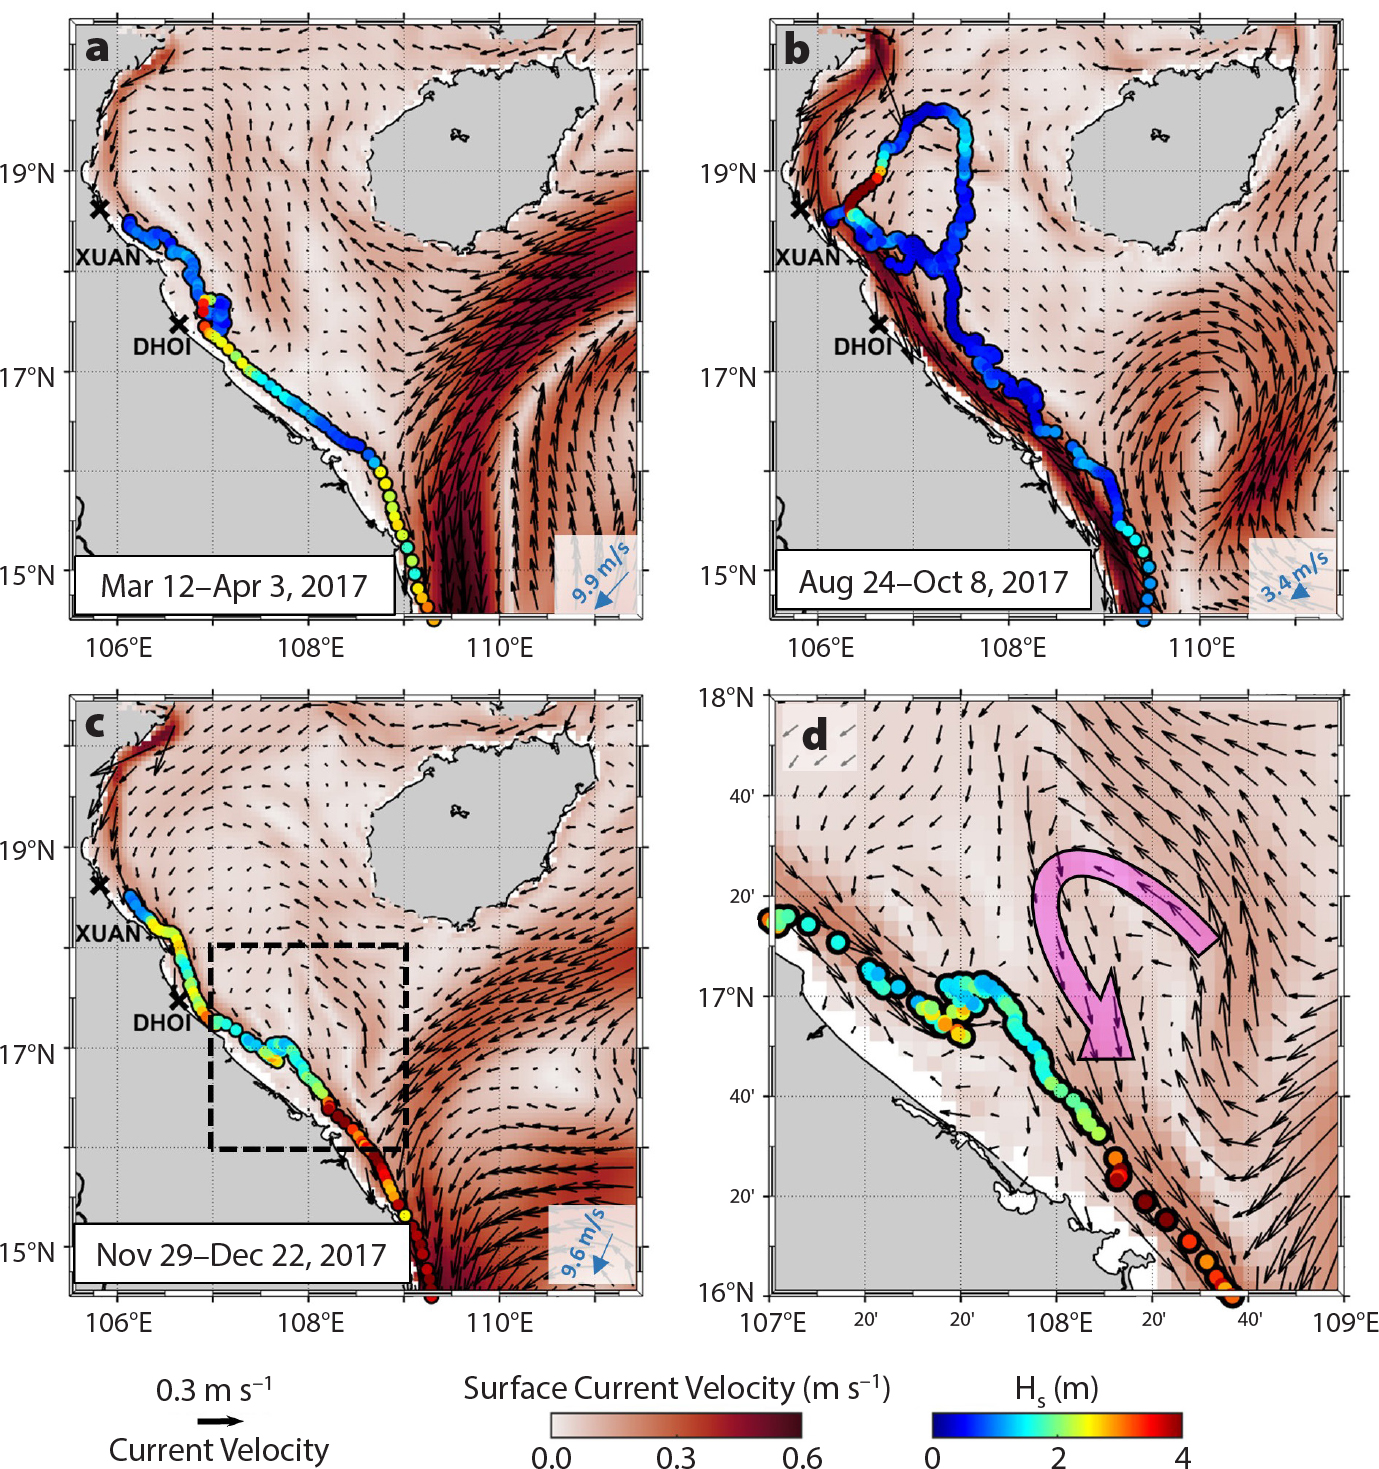
Figure 7. Averaged model surface currents during three miniature wave buoy (MWB) deployments offshore of XUAN in (a) March, (b) August, and (c) November of 2017. Observations of the wave field were made at three-hour intervals at locations denoted by subsequent circles. The resulting buoy tracks are color-coded by observed significant wave height at each measurement location. (d) Close-up of area denoted by black dotted box in (c) with pink arrow illustrating a local cyclonic eddy. ERA-averaged wind speed and direction during the buoy deployment are indicated by blue vectors provided at lower right in (a), (b), and (c). > High res figure
|
A subsequent MWB deployed on August 24, 2017, initially advected out of the faster moving coastal currents and began a cyclonic recirculation pattern that eventually carried it back near its deployment site (Figure 7b). During its southwestward onshore movement toward XUAN, on September 15, 2017, the buoy was influenced by Typhoon Doksuri, whose eye passed just north of the DHOI radar site, resulting in observed significant wave heights greater than 8 m. In the aftermath of the typhoon, the buoy migrated downcoast in calm seas (<1 m significant wave height) along the outer boundary of the coastal current, reaching the western boundary current on October 4, 2017, where it quickly advected along the full southerly extent of the Vietnamese coastline.
A third MWB deployed on November 29, 2017, closely followed the narrow coastal current (Figure 7c) that persists during that time of year (Figure 5c). During the buoy deployment period, several storm systems impacted the Gulf of Tonkin region, resulting in increased sea states that were observed along the buoy track, with several periods of observed significant wave heights greater than 2 m. From the deployment location offshore of XUAN, the magnitude of the coastal currents remained consistent until approximately 17°N, where they weakened and changed to an easterly direction before resuming a downcoast direction.
A close-up illustration of the currents in this region shows a highly variable, complex circulation pattern that includes a cyclonic eddy interacting with the coastal currents (Figure 5d). The complex mesoscale circulation patterns are well captured by the model, as evidenced by the buoy track mirroring the meandering coastal current. The buoy also recorded a substantial increase in significant wave heights from 2 m to a peak of 5 m in the region of eddy-coastal current interaction.
DISCUSSION
Seasonal Evolution of the Red River Plume
The highest rainfalls in the Gulf of Tonkin region occur during the summer monsoon season, producing peak river discharges in mid-August. From May to June, a rapid increase in Red River discharge results in the formation of a low-salinity water mass that remains confined to the northeastern portion of the Gulf of Tonkin. Model simulations confirm that the southwesterly wind direction prominent during the summer monsoon is the main mechanism preventing downcoast advection of the Red River plumes (Figure 5a). In the absence of the Red River coastal flows, HF radar surface currents and CTD observations show little evidence of Red River influence during the summer monsoon season, while elevated nLw555 values along the Vietnamese coast are attributed to local freshwater discharges (e.g., Mazzini et al., 2014) (Figures 2a and 4j,k). Model outputs and HF radar observations do show higher nearshore velocities during the summer (Figure 6c–e). However, model salinity outputs (Figure 6f,g) and CTD casts showed the buoyant Red River plume did not reach XUAN and DHOI until the end of summer (Figure 4l) as winds relaxed and began to transition to a northeasterly direction. This suggests the down-coast surface currents prevalent during the summer are forced by the natural circulation pattern within the Gulf of Tonkin and not by the Red River buoyant discharge (Figure 6b). Model runs with no river input confirmed the presence of these summer circulation patterns.
As southwesterly winds relax during the transition to the winter monsoon season (August–September), the influx of freshwater from the wet season that was confined in the north develops into a strong (0.5 m s–1) buoyant coastal jet that persists along the western length of the Gulf of Tonkin (Figure 5b). Modeled surface currents and salinity show Red River waters typically reach XUAN around August (and DHOI approximately three weeks later), and are strongest from September to November (Figure 6). From January to May, the coastal plume is weaker (i.e., lower current velocities, lower salinity signature), but persists until the start of the summer monsoon season. The waters offshore at DHOI tend to be slightly saltier during this period than those at XUAN because DHOI is farther from the Red River source.
An interesting result from this study is that despite the different averaging intervals (satellite/model: 10 years; HF radar: two years), monthly averages of HF radar surface current observations show seasonal variability trends consistent with those observed in the model outputs and satellite observations (Figure 6d,e). In addition, the significant spatial and temporal variability observed by the one year of CTD observations (i.e., monthly salinity and temperature profiles) was also evident in satellite imagery and model outputs. Specifically, the seasonal plume widths, delineated from 10 years of model and satellite results, are consistent with seasonal patterns observed from the relatively sparse monthly CTD surveys. The spatial and temporal similarities between numerical/satellite results and observations, regardless of averaging interval, suggest the temporal regularity of the summer and winter monsoon seasons is a dominant forcing mechanism dictating the downcoast extent and across-shore width of the Red River coastal plume.
In addition to the two-dimensional seasonal variability assessments, monthly across-shelf CTD surveys provided observations of depth variability for the Red River plume offshore of XUAN. Water profile observations show the seasonal cycle of salinity is not coherent with the relative plume size. The lowest salinity values are observed in September/October, consistent with the arrival of the Red River plume after the wet summer monsoon season (also seen in the modeling results), and then again in April/May (generally not seen in the modeling results). The elevated salinity over the winter period could be the result of increased mixing due to stronger winds and surface waves. This idea is reinforced by the decrease in stratification observed in winter-month in situ observations. The secondary low in salinity in April/May corresponds to a period when buoyant inputs remain strong, but surface forcing is weak. With the onset of spring, onshore winds weaken, transitioning to an offshore direction, and surface heating intensifies, resulting in increasing stratification (Figure 4h,i) as the southerly extent of the coastal plume decreases. The observed monthly variability in coastal plume temperature is consistent with the seasonal variation in discharge temperature and local surface forcing once the plume is over the shelf.
Episodic Forcing in the Gulf of Tonkin
In addition to a seasonal assessment of the western Gulf of Tonkin, a synthesis of the programs first results found that Red River coastal plume interactions with eddies and intermittent storm forcing were important mechanisms responsible for observed variability several deviations above the mean. During the November/December MWB buoy deployment, a substantial increase in significant wave heights from 2 m to a peak of 5 m in the region of eddy-coastal current interaction was observed (Figure 7d). The increase was much higher than would be expected by standard fetch/wind speed relationships (Coastal Engineering Research Center, 1984). The interactions of eddy circulation with the coastal currents and opposing winds were likely the forcing mechanisms that caused the observed spike in significant wave heights within this region (Figure 7d).
The most prominent example of an episodic forcing event during our observational period was Typhoon Doksuri, which made landfall just north of DHOI on September 15, 2017. Meteorological stations installed by SIO and CFO measured cyclonic wind circulation as the storm passed between the HF radar sites. Maximum observed winds at DHOI reached 33.5 m s–1 in an offshore direction, while simultaneous onshore wind velocities at XUAN were measured at 17.5 m s–1 (Figure S4a). As the typhoon moved across the gulf, localized wind seas resulted in substantial increases in the typically benign wave conditions. A free-drifting MWB located approximately 150 km offshore of XUAN captured the rapidly changing sea state. A significant wave height of 3 m was observed on September 14, 2017, that rapidly increased to a peak of 8.7 m 12 hours later. As the typhoon moved away, wave conditions quickly dissipated to 2 m significant heights by September 16, 2017, with a return to ambient conditions by September 17, 2017 (Figure 7b). The increased sea state resulted in a substantially larger HF radar coverage area than observed under typical environmental conditions.
Prior to loss of power at the DHOI radar site, increased HF radar surface current coverage in the region provided evidence of rapid surface circulation variability. Ambient conditions typical of the Gulf of Tonkin were observed at 03:00 UTC on September 14, 2017, with maximum current velocities of 0.65 m s–1 within the Red River coastal plume (Figure S4b). As the typhoon increasingly influenced the region, a circulation pattern consistent with the cyclonic rotation of the storm was evident, with maximum nearshore currents increasing to 1.2 m s–1 on September 14, 2017, 09:00 UTC (17 hours prior to landfall; Figure S4c). The last HF radar observations made 10 hours before landfall showed a drastically different circulation pattern than seven hours earlier, with strong onshore surface currents (Figure S4d) generated from the typhoon’s cyclonic circulation located southeast of DHOI. Maximum sustained onshore currents three times larger than typical ambient conditions (1.5 m s–1) were observed prior to power loss at the radar station. Currents likely would have increased as the typhoon continued its northwesterly approach, with the strongest regions of onshore flow moving north of DHOI, coinciding with the northern side of the storm. The resulting wind-driven storm surge, in addition to the pressure-driven surge, likely caused the substantial flooding in the region (see Brakenridge and Kettner, 2017). The Typhoon Doksuri observations are an extreme example of episodic forcing in the region; however, event-driven variabilities (e.g., storms, typhoons) are regular occurrences and need to be considered in assessments of Gulf of Tonkin dynamics (Shao et al., 2018).
Vietnam Capacity Building
The Vietnamese economy has rapidly developed in recent decades through industrialization and economic reform (Tang et al., 2016). Although the Gulf of Tonkin plays an essential role in this economic development due to the region’s marine transportation, resource extraction, fishing, and tourism activities, oceanographic studies in the region remain limited. A primary objective of the US–Vietnamese program is capacity building through science education and training in modern ocean technologies to support societal issues associated with water quality, oil spill response, sedimentation, and storm impacts (e.g., coastal flooding).
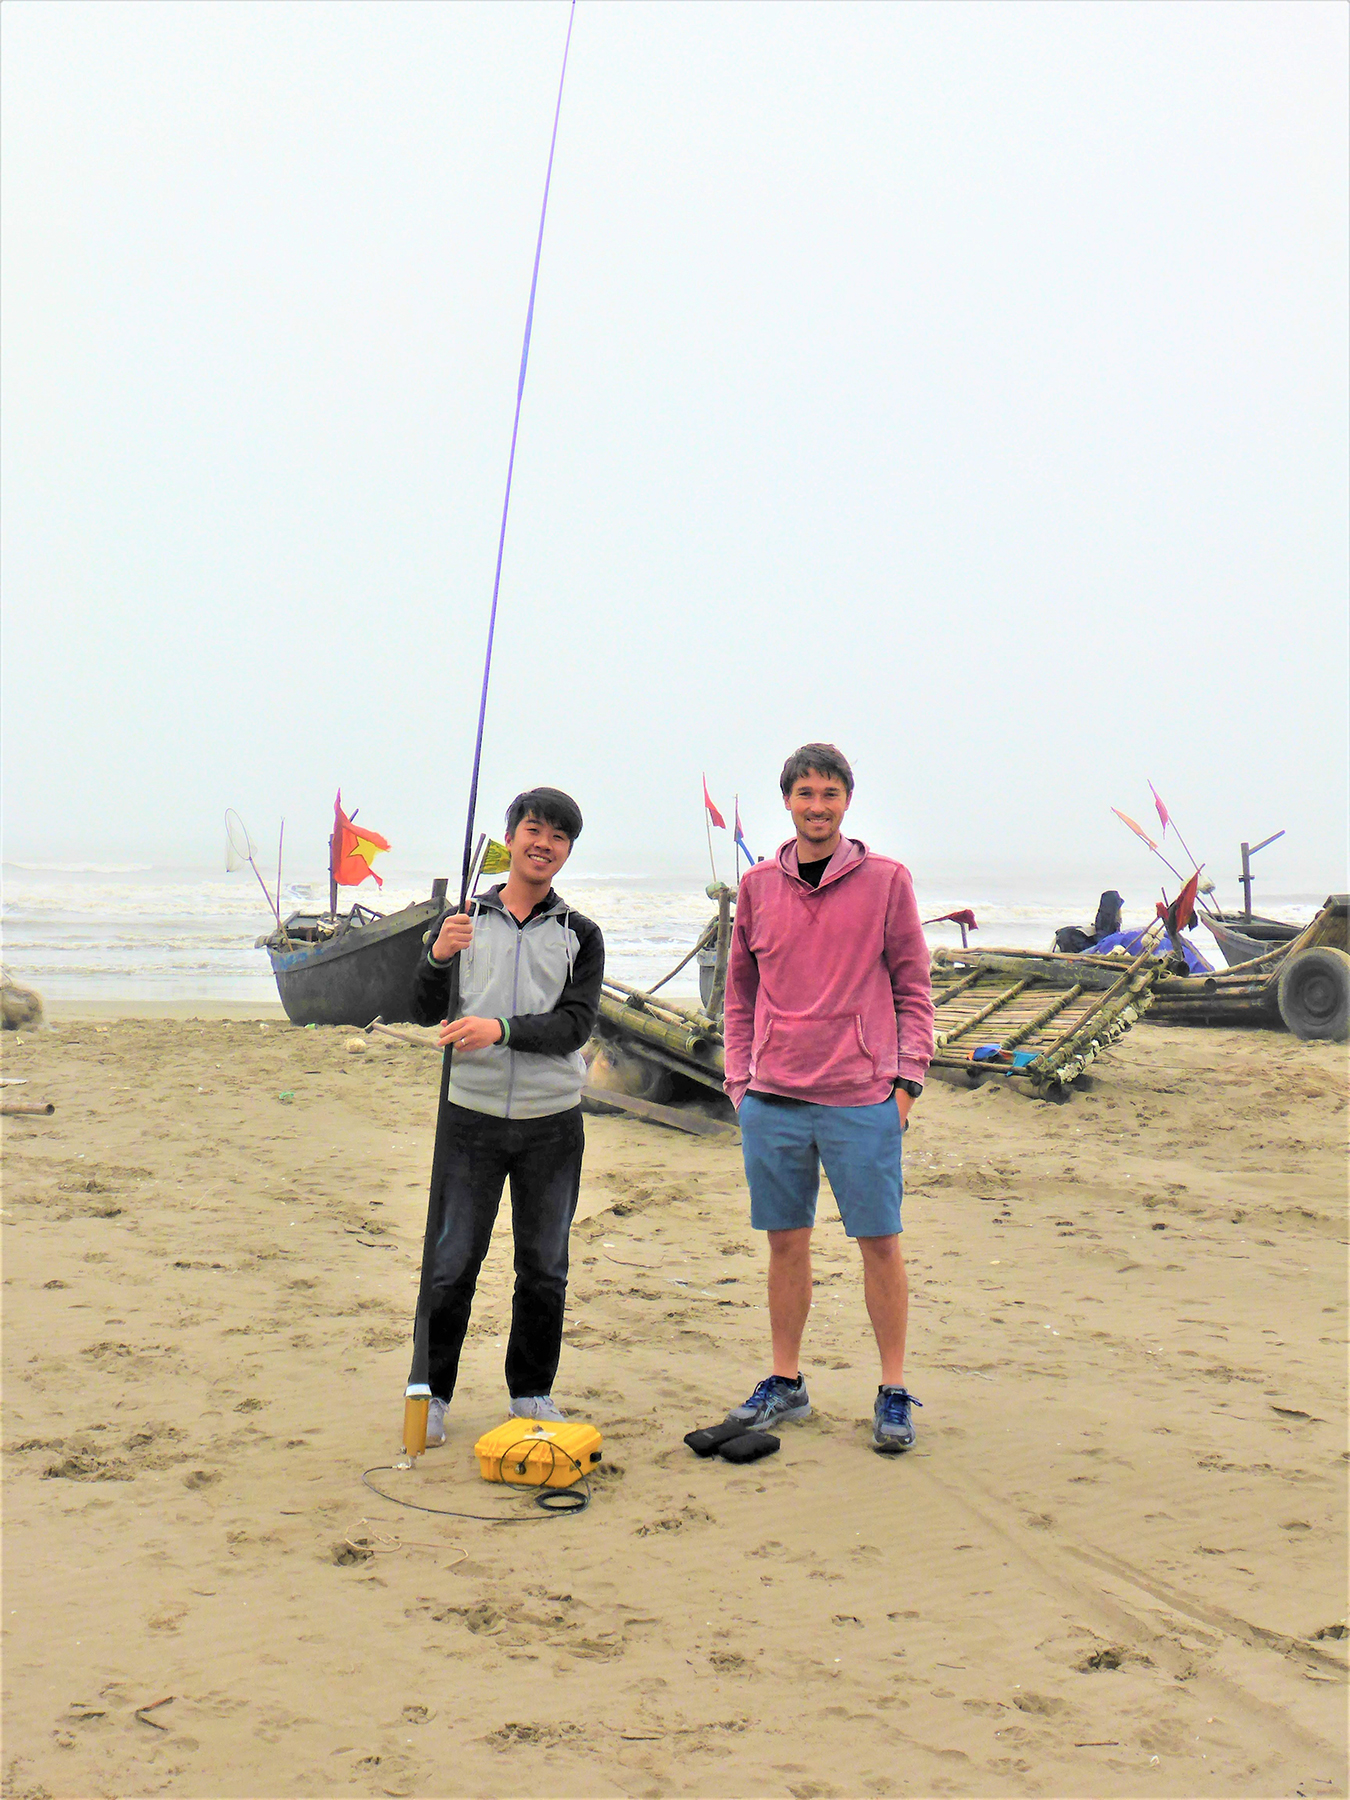
The capacity-building efforts of this program also support science, technology, engineering, and math (STEM) education, which is still in its infancy in Vietnam. A long-term goal of the program is to collaborate directly with Vietnamese scientists and their students to both foster oceanographic science and encourage future generations of Vietnamese students and researchers to remain in the field. A reflection on the value of this strategic approach is the historic US–Vietnamese Naga hydrographic surveys that were conducted from 1959–1961 and that are still favorably looked upon by as one of the stimuli for Vietnamese marine science in the decades that followed. The technology-focused observational program in the Gulf of Tonkin planned for the second phase of our cooperative program is bound to inspire students who might not otherwise have access to emerging oceanographic tools used in the program (Figure S5).
CONCLUSIONS
The unique framework developed for cooperation between US academic and Vietnamese government institutions facilitated a collaborative study designed to bridge the scientific gaps in previous regional studies that often ignored the role of riverine input into the Gulf of Tonkin region. Numerical results confirm that flows originating from the Red River significantly influence the circulation of the western region of the Gulf of Tonkin and need to be considered when assessing seasonal dynamics. A synthesis of first results from a numerical model, satellite imagery, HF radar derived surface currents, and monthly coastal hydrography surveys was used to assess the seasonal dynamics of the western portion of the Gulf of Tonkin. Observations show consistent seasonal intrusion of Red River waters from August to May that peaks from September to November. The location of the fresher water mass primarily depends on the seasonally reversing monsoon winds that block downcoast advection during the summer monsoon season (i.e., southwesterly wind direction). In addition to seasonal riverine forcing, episodic forcing from storm events was found to play an important role in higher frequency dynamics of the region. The responses of the Gulf of Tonkin to storm-driven events and the complex processes generated from the interaction of the Red River coastal current with the western boundary current will be the focus of the second phase of the US-Vietnamese collaborative program.