Introduction
The dramatic decline in Arctic sea ice cover over the past several decades is one of the most striking impacts of our warming climate and goes hand-in-hand with substantial changes in the length and timing of the summer melt season. Sea ice has tended to melt earlier in summer and re-form later in autumn (Stroeve et al., 2014; Stroeve and Notz, 2018). As we approach the time when an ice-free Arctic summer is expected, the fraction of the ice pack undergoing autumn freeze-up is increasing (Druckenmiller et al., 2021). While just over 50% of the ice pack was seasonal ice in 1980, over 70% of the ice pack has been seasonal in recent years (when defined as the difference between the minimum and maximum extent, relative to the maximum ice extent; see Figure 1). Once the Arctic has an ice-free summer, 100% of the ice will be seasonal. This is likely by 2070 even under a moderate emissions scenario (Jahn et al., 2016), and earlier under a higher-emissions scenario (Docquier and Koenigk, 2021); an assessment based on the observational record predicts it will occur by 2050 (Stroeve and Notz, 2018).
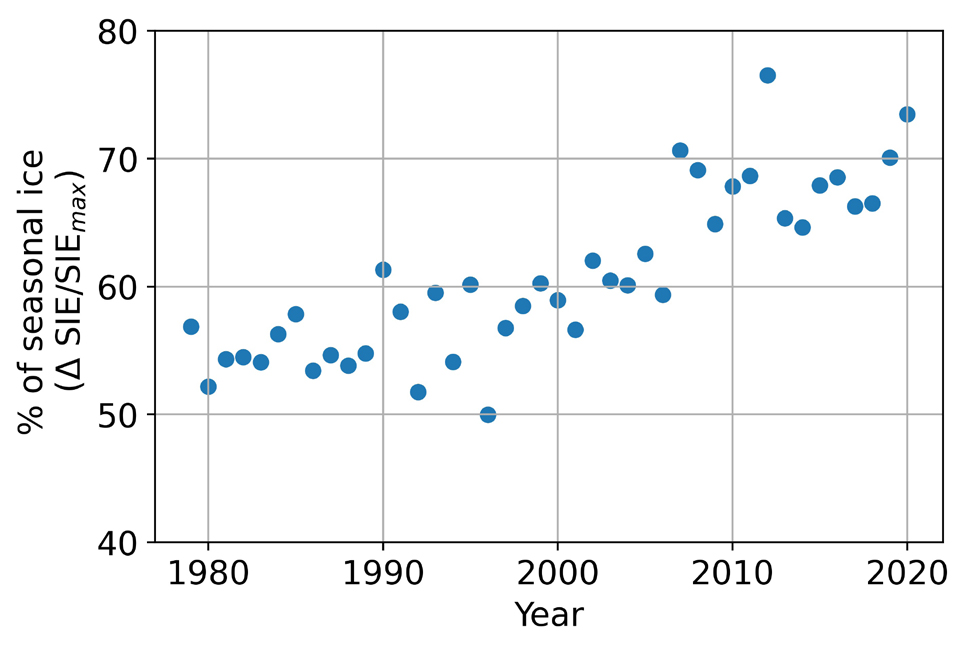
FIGURE 1. Percentage of Arctic sea ice extent (SIE) that is seasonal ice, defined as the difference between the minimum and maximum extent scaled by the maximum extent (∆SIE/SIEmax), over the satellite record. Data from the National Snow and Ice Data Center (NSIDC) via https://doi.org/10.7265/N5GT5K3K. > High res figure
|
This article focuses on the freeze-up that occurs each autumn, along with its spring and summer preconditions (Steele et al., 2015). The freeze-up process includes complex air-ice-ocean feedback mechanisms at multiple scales that make it difficult to accurately predict future Arctic scenarios (e.g., Wang and Overland, 2015). Out of these complexities, one simple rule is clear: sea surface temperatures (SSTs) must cool to the freezing point before sea ice can form. The paper thus begins with an overview of pan-Arctic trends in sea ice and sea surface temperatures from satellite data, and then explores processes specific to the western Arctic, where substantial changes have motivated recent in situ observations. Following the western Arctic focus, the remaining sections of the paper discuss the broader impacts of delayed freeze-up and identify key topics for future research.
Sea Ice Trends
The open water season is lengthening, with freeze-up occurring later in the autumn (Stroeve et al., 2014). From 1979 to 2010, the timing of ice advance as observed by satellite was delayed more than one month (Stammerjohn et al., 2012). There is high correlation (R2 ≈ 0.8) between earlier sea ice retreat (and hence greater ocean heat uptake during summer) and later sea ice advance. The timing varies based on the threshold of sea ice cover used to consider the ocean ice-covered. Peng et al. (2018) report a trend in the freeze-up, where sea ice crosses 80% concentration, that is stronger than the trend in sea ice onset, where sea ice crosses 15% concentration. The average freeze-up shift in that study is 6.5 days later each decade, computed over 1979 to 2017. In Figure 2c, we plot the linear trend of the Arctic freeze-up date, defined as the date when the NOAA/NSIDC Climate Data Record of Passive Microwave Sea Ice Concentration (Meier et al., 2021) exceeds 80%. Trends are only calculated for cells in which there are at least 10 valid freeze-up dates over the record (i.e., sea ice concentration must go below 80% during the summer and above 80% during the winter). Models can allow us to explore different definitions of freeze-up beyond sea ice concentration, such as SST, sea ice volume changes, and rates of congelation or frazil ice growth. The trend in delay is clear and significant regardless of what metric is chosen (Smith and Jahn, 2019), underscoring the robustness of the signal.

FIGURE 2. Date of sea ice freeze-up (a) averaged over 1979–1988 and (b) 2011–2020, and (c) the trend (days/yr) over 1979–2020. Freeze-up is defined as when sea ice concentration from the NOAA/NSIDC Climate Data Record of Passive Microwave Sea Ice Concentration (Meier et al., 2021) exceeds 80%. > High res figure
|
Freeze onset dates are likely to continue to shift later. Under the high-emissions RCP8.5 future scenario, the Community Earth System Model (CESM) global climate model large ensemble suggests that the delay will more than double by the end of the twenty-first century (Smith and Jahn, 2019). This suggests an additional 2.5-month delay in average pan-Arctic freeze onset by 2099 is possible. Though model predictions are dramatic, the actual delay may be even more severe, given the historical under-prediction of sea ice loss by climate models (Notz and Stroeve, 2016). As discussed below, observed and future changes in the timing of Arctic sea ice freeze-up are mostly a forced response to atmospheric and ocean warming, but feedbacks such as preconditioning due to early melt onset and local ocean-ice-atmosphere interactions likely also play a role.
Figure 2 shows substantial regional variability in the magnitude of the delay. Due to the geometry of the Arctic Ocean, the trends for delay in ice advance are even stronger in coastal zones of a particular area (Onarheim et al., 2018). For instance, in the Beaufort-Chukchi region, the ice advance along the coast portion has trended 1.2 days later per year through 2014, compared to 0.4 days later per year over the entire domain (Thomson et al., 2016).
Model studies show that the trend in freeze onset defined thermodynamically is stronger in open water areas than in those that remain partially ice covered (Smith and Jahn, 2019), suggesting the importance of feedbacks from solar ocean warming in driving these trends (Stammerjohn et al., 2012). In many coastal and fast ice regions, freeze-up timing is well predicted by melt onset timing, suggesting primarily thermodynamic factors (Stroeve et al., 2016). Freeze-up timing is also affected by mechanical dynamics, and thus storms make freeze-up progression less predictable (Polyakov et al., 2022).
Sea Surface Temperature Trends
Figure 3a–c shows increased sea surface temperatures (SSTs) across most of the Arctic, which have been widely reported (Steele et al., 2008) and that are clearly related to changes in solar absorption (Steele et al., 2010). While SST is a useful metric for tracking oceanic changes, it is important to note that SST does not necessarily represent the heat content of the upper ocean, which is far more important to the freeze-up process. Open-water summer SSTs averaged over 2010–2019 are 1°–2°C warmer at the seasonal maxima than they were in the 1980s, with the greatest changes seen south of 75°N. A widespread warming trend exceeding 0.1°C yr–1 is seen outside of the central Arctic Ocean and eastern Beaufort Sea (Figure 3c). In addition to warming, the timing of the annual peak SST (Figure 3d–f) has shifted significantly later in the year throughout much of the western Arctic. The warmest SSTs now occur in late August or early September, in comparison to the 1980s when SSTs peaked in late July (Figure 3d–f). In the Kara and Barents Seas, trends in annual peak SST are generally not significant. There are slight negative trends near the ice edge, which are an artifact of spatial averaging. The overall signal is an Arctic that is warmer in the autumn, with less and later sea ice as a direct result.
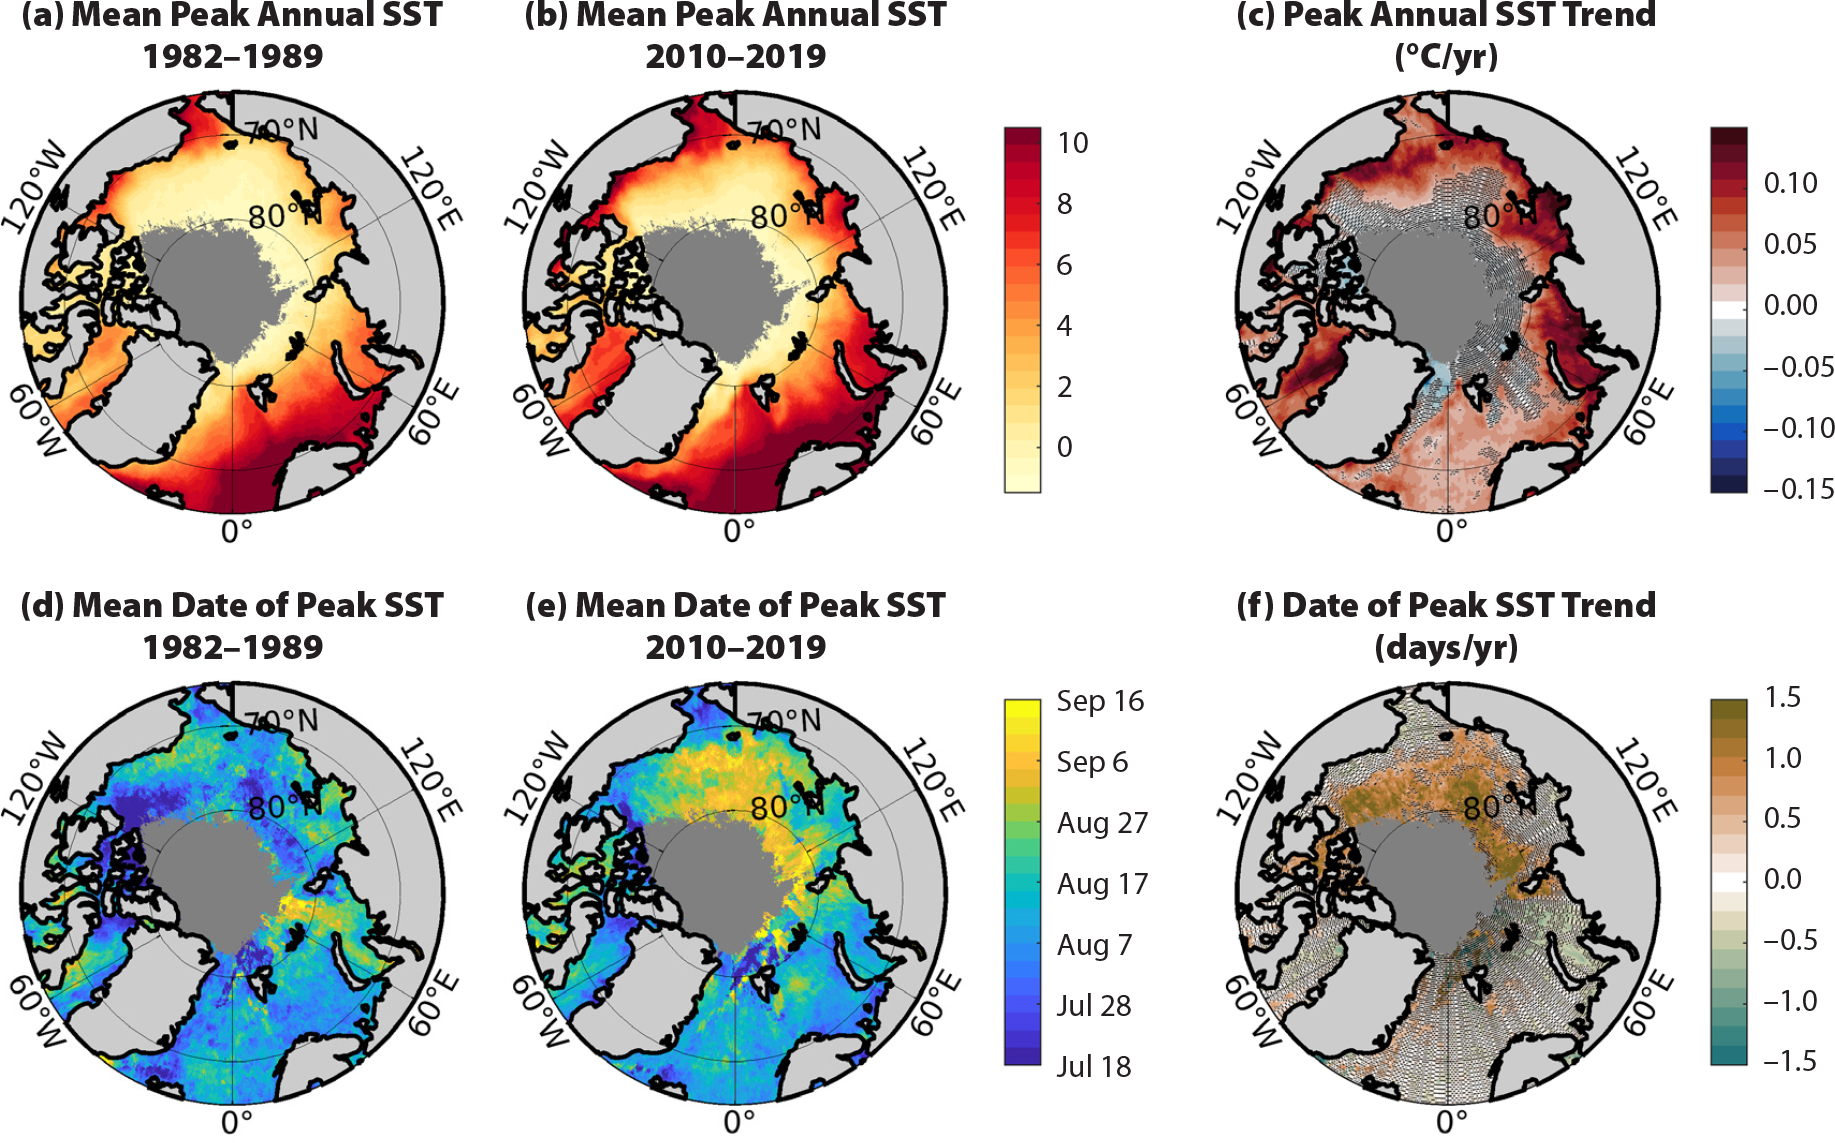
FIGURE 3. (top) peak annual sea surface temperature (SST) averaged over (a) 1982–1989 and (b) 2010–2019, and (c) the trend over the 1982–2020 time period. (bottom) Date of peak annual SST averaged over (d) 1982–1989 and (e) 2010–2019, and (f) the trend over the 1982–2020 time period. Data are from the NOAA High-resolution Blended Analysis of Daily SST (OISST) 0.25° product from 1982 to 2020. SST data with sea ice concentration (from the NOAA/NSIDC product) greater than 80% are masked prior to processing. Grid points for which fewer than 75% of years have sufficient ice-free data to compute a trend are masked in dark gray, and those for which trend is not significant at the 95% level are stippled. > High res figure
|
Freeze-up Processes in the Western Arctic
We now focus on the western Arctic and describe the dynamic and thermodynamic processes related to observed trends (Figure 4). In the western Arctic (Beaufort, Chukchi, and East Siberian Seas), trends in sea ice and SST are driven by inflow from the Pacific and by local heating; distinct water masses are important here (Nakanowatari et al., 2022). In the eastern Arctic marginal seas (e.g., Barents, Kara, and Laptev Seas), the key processes driving changes in SST and sea ice are quite different, including storm-driven upward transport of Atlantic Water heat and Atlantification, plus turbulent mixing above the continental slopes bordering Svalbard and Siberia. Eastern Arctic processes, which are beyond the scope of this paper, are discussed by Polyakov et al. (2017).
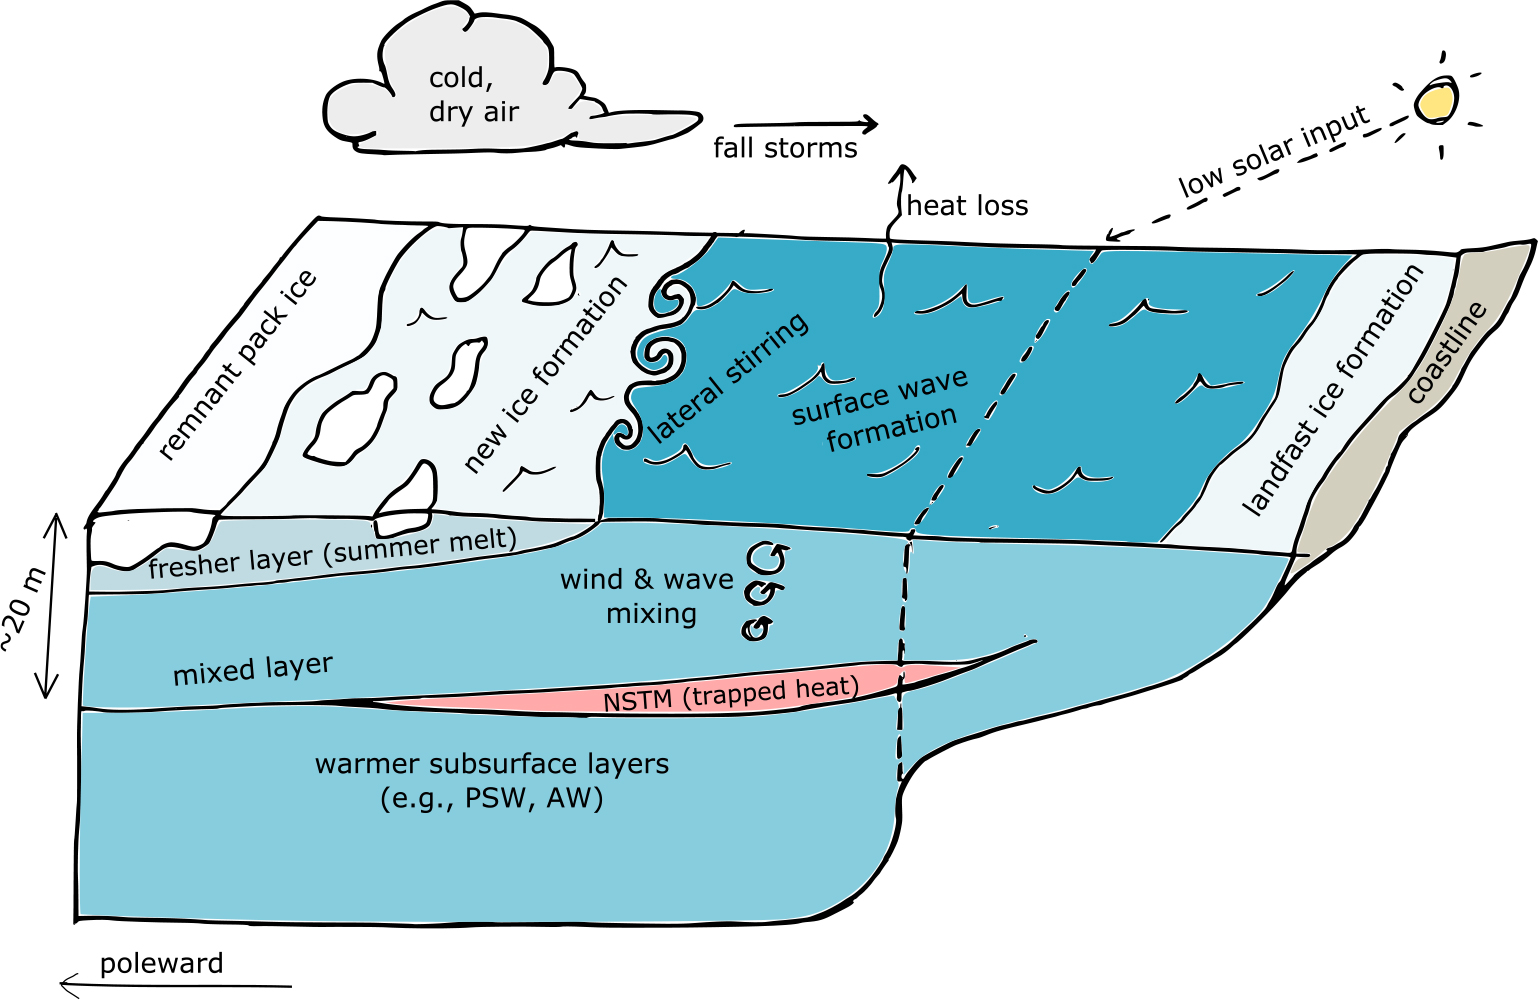
FIGURE 4. Schematic of key autumn freeze-up processes in the western Arctic. Storms generate wind and waves, driving heat flux out of the ocean that exceeds heat input from the sun, resulting in sea surface cooling and sea ice formation. Wind- and wave-generated mixing may also release heat trapped in the near-surface temperature maximum (NSTM), delaying freeze-up locally. In contrast, enhanced stratification from summer ice melt has the potential to sequester heat in the NSTM and hasten freeze-up. > High res figure
|
The cumulative decadal shifts in the western Arctic are illustrated by focusing on the month of October, the month that freeze-up has typically occurred and therefore the month in which long-term shifts in freeze-up are most clearly seen. Using the ERA5 reanalysis product, Figure 5 shows averages of October sea ice concentration, SST, and significant wave height from two decades: 1980–1989 and 2010–2019. The reduction in autumn ice cover is striking, as are the increases in SST and significant wave height. The relationship between SST and ice cover is thought to be both a cause and an effect, via the well-known ice-albedo feedback mechanism (Perovich et al., 2007). The increase in significant wave height is mostly a result of change in ice cover, which increases open-water fetch distances (Thomson and Rogers, 2014) and thereby increases wave heights, even in the absence of increasing winds (Thomson et al., 2016). Figure 5 suggests that the components of the air-ice-ocean system have combined to result in these seasonal shifts, each of which are explored in the following sections.
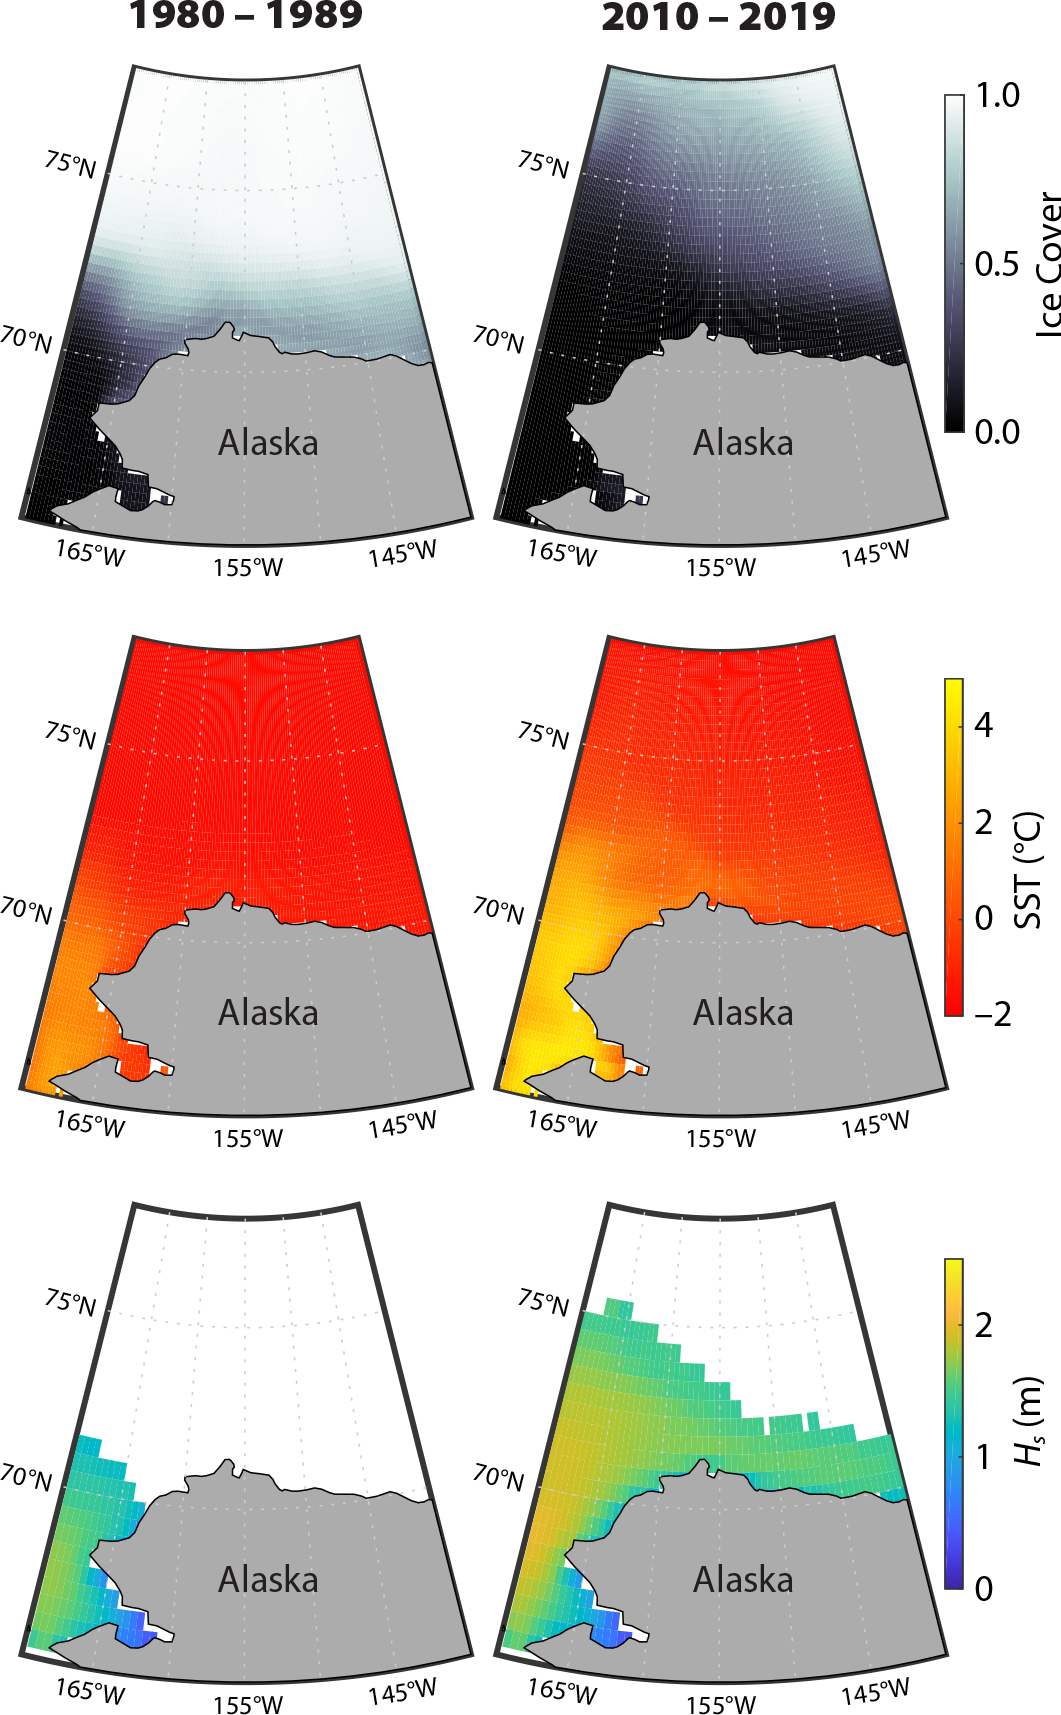
FIGURE 5. Average conditions for the month of October in the western Arctic from 1980–1989 (left) and 2010–2019 (right). Rows show sea ice concentration (top panel), sea surface temperature (SST, middle panel), and significant wave height (HS, bottom panel) from the ERA5 reanalysis project, downloaded from https://cds.climate.copernicus.eu/. > High res figure
|
Heat Fluxes
Figure 4 shows the key processes in the autumn ice advance. The overall driver of ice formation is the loss of heat from the ocean to the atmosphere when large-scale atmospheric patterns bring cold air over warmer, open-water regions. As the input of solar heat decreases throughout the autumn, there are no external sources of heat to compensate for the loss to the atmosphere. There are, however, reservoirs of heat stored in the ocean. These reservoirs, discussed in more detail below, can reside below the surface because salinity controls stratification in most of the Arctic. Mixing controls the delivery of this stored heat to the ice-ocean interface, and thus its impact on ice formation. Upper ocean mixing is a complex interaction between processes that include direct forcing by surface winds and waves, lateral stirring by small-scale eddies and filaments, frontal dynamics, and internal ocean dynamics that generate vertical mixing, all of which are modulated by the strong near-surface stratification commonly found in this region (e.g., Brenner et al., 2020). As the freeze-up shifts later into the autumn, open water now coincides with stormier conditions and stronger upper ocean mixing (e.g., Smith et al., 2018).
Quantification of the processes in Figure 4 typically applies a surface heat budget, in which the rate of change in heat at the ocean surface is expressed in fluxes:
Qnet = Qsw + Qlw + Qsensible + Qlatent + Qsub. (1)
Positive values represent heat gain by the ocean and negative values represent heat loss. In the autumn, the input (gain) from the net shortwave radiative term, Qsw, diminishes, and the overall net, Qnet, generally becomes negative (loss). The longwave radiative term, Qlw, is itself a net term that can change sign depending on cloud conditions and sea surface temperature. The rate of sensible heat lost to the atmosphere, Qsensible, is controlled by the air-water temperature difference. The rate of latent heat lost to the atmosphere, Qlatent, is also a function of the temperature difference, along with the relative humidity of the air. Cold and dry air masses originating over the perennial ice pack are thus excellent sinks of heat when they pass over open water. The sensible and latent terms also depend strongly on wind stress, and estimation of these terms is thus further complicated by uncertainties in the atmospheric drag coefficient in partial ice cover (Andreas et al., 2010; Persson et al., 2018). A heuristic final term represents a rate of subsurface ocean heat (mostly from the near-surface temperature maximum, or NSTM; see later section on Upper Ocean Heat) mixing up to the surface, Qsub, which represents a heat gain to the surface but a heat loss from the NSTM.
The flux terms in the surface heat budget (Equation 1) are typically calculated from observations using the COARE (Coupled Ocean-Atmosphere Response Experiment) algorithm; see Fairall et al., 1996, 2003). This algorithm uses bulk average observations to estimate terms that are primarily turbulence driven, such as Qsensible and Qlatent, and thus are rarely measured directly. Obtaining accurate estimates of these terms (and thus Qnet) in the Arctic remains a key challenge for both observational and modeling efforts.
The total net rate Qnet controls how fast the ocean surface cools in autumn, and, upon reaching a seawater freezing temperature of approximately −1.8°C, the rate of ice growth. The delay of autumn freeze-up is likely driven by a combination of adjustments to Qsensible and Qlatent, along with increases in Qsub. The delay is also related to the simple truth that warmer initial sea surface temperatures must lose more heat (i.e., more sustained Qnet < 0) before reaching freezing temperature.
Atmospheric Forcing
Weather patterns are essential to autumn sea ice formation, especially in the western Arctic. Cold, dry air originating over sea ice can cause enormous sensible and latent heat loss from nearby open water regions (Persson et al., 2018). Thus, new ice growth is typically adjacent to the ice pack, and the progradation of the marginal ice zone is one common version of autumn freeze-up. Localized feedback mechanisms, such as low-level atmospheric jets that form along the ice edge (Guest et al., 2018), increase sensible and latent heat fluxes and potentially enhance vertical mixing.
Arctic air temperatures are increasing at rates about twice that of global warming (e.g., Serreze et al., 2009; Bekryaev et al., 2010; Dai et al., 2019). The effect on heat fluxes is significant. In areas with newly open water, there is much greater exchange between the ocean and the atmosphere (because the air-water temperature differences are larger). In areas that already had open water, the sensible heat losses are reduced. More specifically, the Arctic amplification observed in the warming trend is strongest in autumn and winter (Serreze and Barry, 2011; Dai et al., 2019). The reduction in cold air in autumn and the reduced rates of heat loss from the open ocean to the atmosphere are clear drivers for the delay of autumn freeze-up.
Atmospheric forcing also indirectly affects autumn freeze-up. Patterns in surface winds drive ocean circulation, which in turn affect the distribution of ocean temperatures. This can be particularly important at regional scales. For example, an episodic shift in atmospheric circulation over the Bering Sea in 2018 increased the transport of warm water into the Chukchi Sea and delayed freeze-up that year (Kodaira et al., 2020). Wind-driven advection of sea ice also affects patterns of melt and freeze-up. Both these indirect and the direct mechanisms connect climate-scale atmospheric patterns to seasonal ice extent (Cai et al., 2021).
Autumn weather in the western Arctic is quite active, with cyclones forming and passing regularly through the region (Pichugin et al., 2019). Several studies have suggested that Arctic cyclones cause sea ice retreat in summer/autumn, as in the Great Arctic Cyclone of 2012 (Simmonds and Keay, 2012). However, recent work shows more nuanced effects, in which Arctic cyclones decrease ice in the eastern sector of the storm (where the air is warm and moist) and increase it in the storm’s western sector (where the air is cold and dry; Clancy et al., 2021). The same work argues for equal importance of dynamic (i.e., motion) and thermodynamic (i.e., heat) effects on sea ice from Arctic cyclones. Looking to the future, there are clear linkages between the loss of ice and the large-scale atmospheric patterns (Moore et al., 2018; Ballinger et al., 2021; Valkonen et al., 2021). We can thus expect the atmosphere to continue to enhance delays in autumn freeze-up.
Upper Ocean Heat
Upper ocean heat content and the processes that deliver heat to the ice-ocean boundary layer modulate the timing and location of sea ice formation. Autumn freeze-up proceeds as waning shortwave radiation and colder air temperatures drive increased heat flux from the ocean surface layer into the atmosphere. During summer, solar input (Qsw + Qlw) is the dominant source of heat to the upper ocean (e.g., Maykut, 1982; Maykut and McPhee, 1995; Shaw et al., 2009). Once the solar input fades in autumn, cooling at the ocean surface is assured.
Strong surface layer freshening (McPhee et al., 1998; Solomon et al., 2021) has accompanied increased mixed layer temperatures in recent decades (Peralta-Ferriz and Woodgate, 2015), and is associated with changes in river runoff, precipitation, and sea ice melt or export (Haine et al., 2015). In the western Arctic, increasingly fresh inflow through the Bering Strait likely also plays a role (Woodgate and Peralta-Ferriz, 2021). At the cold temperatures (<5°C) typical of the Arctic upper ocean, seawater density is controlled primarily by salinity. Surface layer freshening thus strengthens the cold halocline, reinforcing the strong stratification that can isolate warmer waters below the mixed layer from the ice-ocean boundary layer above, enhancing surface cooling and promoting sea ice growth. This process can be patchy, with significant spatial variability (e.g., MacKinnon et al., 2021)
After the late-summer decrease in solar heat input each year, subsurface reservoirs of warm water, which are isolated from the ice-ocean boundary layer by the colder and fresher waters above, become the primary source of heat to the ice-ocean boundary layer. Atlantic waters that enter through Fram Strait and the Barents Sea circulate throughout the Arctic and represent the largest source of heat, though in the western Arctic these are too deep to provide much heat to the surface layer. The western Arctic typically exhibits two shallower, and thus more accessible, reservoirs of relatively warm waters. The shallowest, most accessible reservoir of heat is the NSTM (Jackson et al., 2010, 2011), which is typically found around 20 m to 30 m depth and is formed seasonally from surface waters that have been warmed by solar radiation and then capped by fresher, colder, more buoyant waters associated with sea ice melt (e.g., McPhee et al., 1998; Perovich et al., 2008). The NSTM provides short-term storage for summertime heating that is shallow enough to be released to the ice-ocean boundary layer by vertical mixing later in the autumn (e.g., Smith et al., 2018).
Pacific Summer Water (PSW) provides a second reservoir of heat in the western Arctic that is both larger and deeper (>40 m) than the NSTM. In summer, Pacific waters enter the Arctic through the Bering Strait (Woodgate, 2018), warming as they flow over the Chukchi Sea Shelf before they subduct below the fresher, more buoyant surface waters of the Beaufort Gyre (Timmermans et al., 2014). Subsurface eddies (Spall et al., 2008; Fine et al., 2018) and filaments (MacKinnon et al., 2021) inject these warm waters into the interior halocline. PSW is found throughout the Canada Basin (Timmermans et al., 2014) and has been associated with episodes of anomalous sea ice retreat over the Chukchi Sea and the southern Canada Basin (Shimada et al., 2006; Woodgate et al., 2010). Even in autumn, when cold air increases sensible heat loss, the PSW does not cool much before it subducts (and becomes isolated from the atmosphere). Thus, PSW is a source of heat to the region that arrives via a lateral process, but the effects of this heat are limited by vertical processes and may not have large basin-wide impacts on short (sub-seasonal) timescales. The PSW reservoir sits between 40 m and 100 m depth, within the cold halocline. Upper ocean stratification and diapycnal mixing exert strong control on the ability of PSW to supply heat to the ice-ocean boundary layer. In addition to the persistent water mass, pockets of anomalous PSW heat can persist for months to years within eddies moving through the region at the base of the mixed layer (Fine et al., 2018).
Lateral processes may also play an important role in the delivery and distribution of stored oceanic heat, especially along the marginal ice zone (MIZ; Manucharyan and Thompson, 2017). Energetic submesoscale turbulence can generate strong lateral stirring of heat and sea ice, as well as divergences with upwelling that can carry warm water to the surface locally. These are further enhanced by local winds and ice motion, which alter the otherwise persistent lateral gradients (Brenner et al., 2020). These processes can drive rapid restratification (e.g., Boccaletti et al., 2007; Thomas et al., 2008; Timmermans et al., 2012) and likely modulate NSTM formation throughout summer and autumn. In some cases, fresh surface layers from ice melt may have sufficient stratification to inhibit mixing and thereby hasten sea ice formation by preconditioning the surface (Crews et al., 2022). This is an active area of research, with a large field campaign planned for autumn 2022 to sample stratification and surface fluxes near the autumn ice edge (https://salinity.oceansciences.org/sassie.htm).
Observations of an Autumn Ice Edge
In situ observations near the ice edge in the Beaufort Sea on September 30, 2020, illustrate many of the key processes that delay or accelerate ice formation during the initiation of freeze-up in the western Arctic. These observations are applied for estimating Qnet using the COARE algorithm and for demonstrating the net balance that cools the ocean surface in autumn. The data presented here were collected opportunistically as part of a transit leg during the 2020 mooring recovery cruise for the Coastal Ocean Dynamics in the Arctic (CODA) program (http://www.apl.uw.edu/CODA). The observations span a marginal ice zone formed by remnant ice that had persisted in the southern Beaufort Sea for the entire summer of 2020. The overall minimum ice extent occurred on September 15, so these observations were made during the early stages of that year’s large-scale freeze-up.
The observations were collected in an ice-following reference frame, spanning open water to nearly complete ice cover. Drifting buoys were used to establish the ice-following reference frame, which aids in diagnosing the evolution of temperature and salinity as purely temporal. Previous studies have used this approach to reduce the complications of interpreting changes that occur as ice advects through a spatial field (Smith et al., 2018; Brenner et al., 2020). Here, four Surface Wave Instrument Float with Tracking (SWIFT; see Thomson, 2012, for description of the platform) buoys were deployed to freely drift for one day, while R/V Sikuliaq followed the drift and collected temperature and salinity profiles. Figure 6 shows the region of the sampling, along with an image of a SWIFT drifter in the ice. The practical salinity scale is used throughout (IOC, SCOR, and IAPSO, 2010).
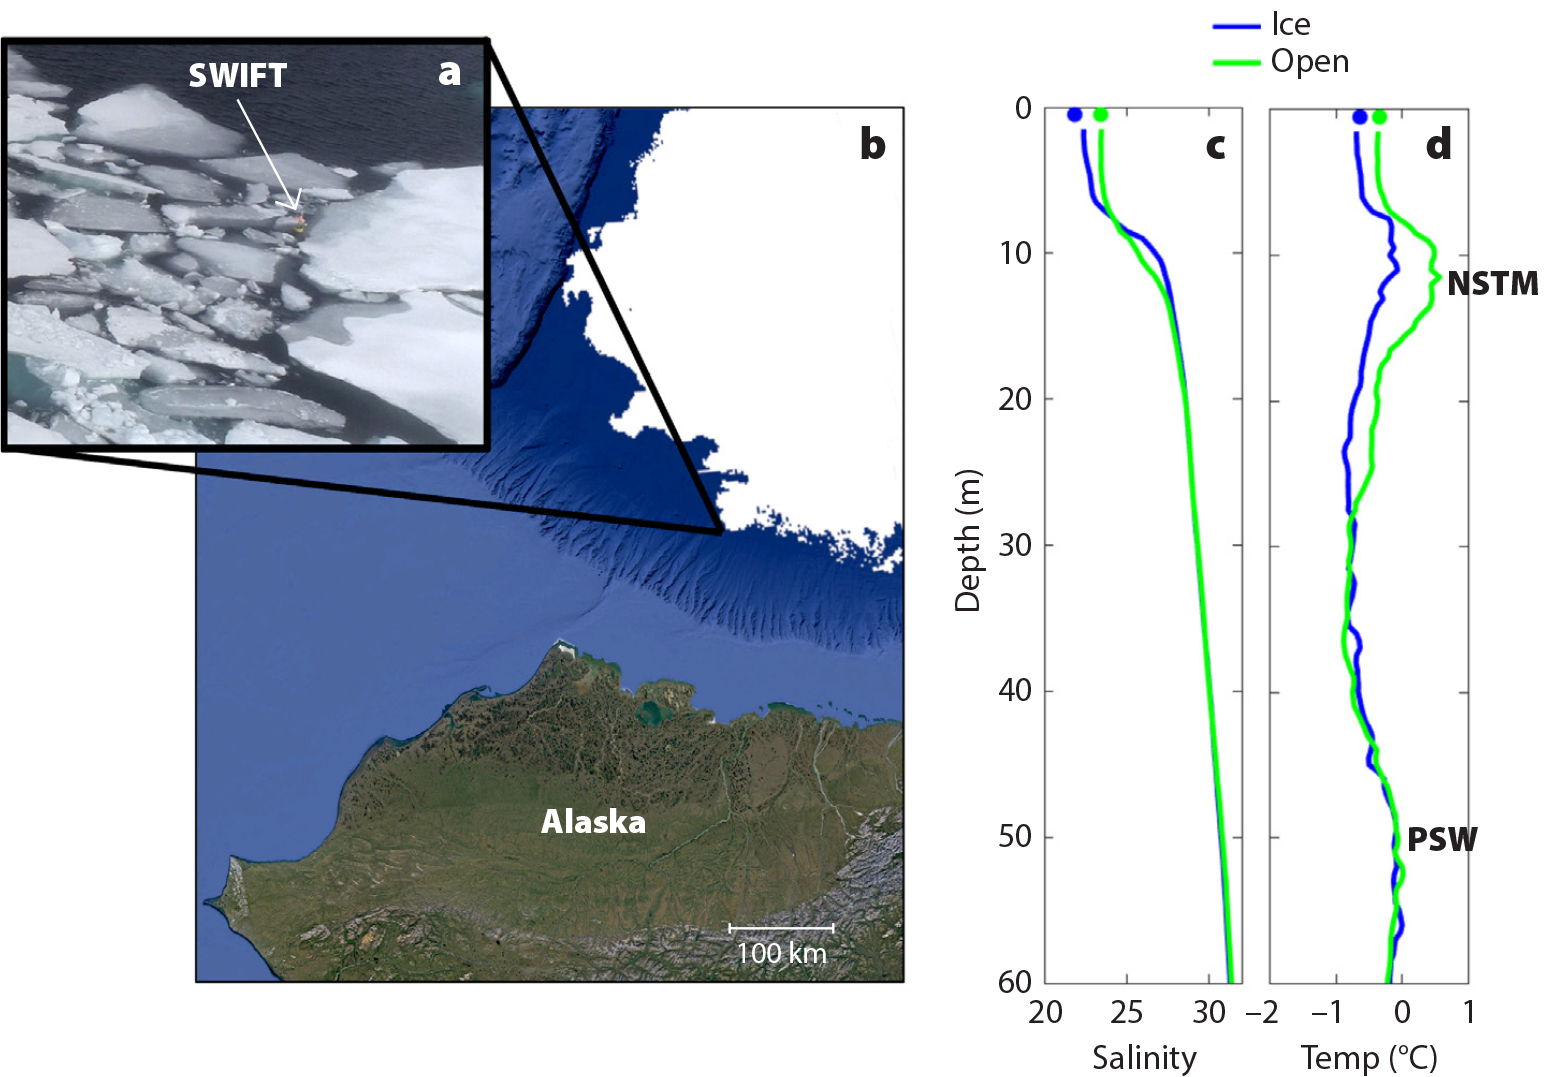
FIGURE 6. Data collection in the marginal ice zone of the Beaufort Sea on September 30, 2020. (a) Aerial image of the ice edge, in which a SWIFT drifter was sampling. Image credit: Alex de Klerk (b) Map showing ice cover (white) with sampling location. (c) Salinity profiles. (d) Temperature profiles. The surface points shown at the top of the profiles were measured by the SWIFT drifters, and the profiles were collected by shipboard CTD casting with a lateral separation of 6 km. PSW = Pacific Summer Water. NSTM = Near-surface temperature maximum. Ice cover from NSIDC via https://doi.org/10.7265/N5GT5K3K. > High res figure
|
The right panels of Figure 6 show the average salinity and temperature profiles collected in the ice and in open water, along with surface values from the SWIFTs. Although only separated by 6 km, the profiles in Figure 6 are notably different and demonstrate the preconditioning that influences freeze-up timing. As is typical for the MIZ, the surface waters in the ice are cold and fresh, relative to open water. However, even in broken ice, the SST is well above the nominal seawater freezing point of 1.8°C. Thus, heat loss Qnet must continue to occur before the MIZ refreezes into solid ice cover. The broken ice here is still melting, albeit slowly, until the freezing temperature is reached. The subsurface waters are the more notable part of this data set. The profile in open water has a strong NSTM around 10 m, relative to the weaker signal for the profile in the ice. It is expected that this NSTM resulted from the solar heating accumulated throughout the summer followed by surface cooling in the early autumn and possibly advected meltwater. Within the ice, the NSTM is thinner, weaker, and shallower because the higher albedo of partial ice cover has minimized the accumulation of solar heating during the summer.
The NSTM in open water is a reservoir of heat that can be released by ocean mixing (becoming Qsub) to create large changes in Qnet that can delay the freeze-up by days and even weeks. Given the same atmospheric forcing, the area of broken ice is likely to refreeze much faster than the open water 6 km away. This would be true even without the difference in the surface temperatures, because the total integrated heat of the NSTM will provide a Qsub that controls Qnet in open water. Applying a seawater heat capacity of 3,850 J kg−1 C−1 to the temperature profiles in Figure 6, the open water profile has 4.2 × 10⁷ J m−2 more heat than the profile in the ice. It would take 4.4 days of continuous heat loss at Qnet = –100 W m−2 for the open water profile to arrive at the same heat content as the profile in the ice (assuming no change in the ice profile). Lacking observations of the evolution of these profiles, we can only speculate that the actual heat loss is much more complicated, as Qnet varies over both profiles and some difference between them persists for weeks or more.
The speculated evolution toward freezing in this example becomes more quantitative upon estimating the heat fluxes (Equation 1) on the day the profiles were collected. Using the COARE algorithm (Fairall et al., 1996, 2003), the primary inputs are: air and water temperatures, relative humidity, wind speed, and radiation. The observed air temperature (–2°C) is always lower than the water temperature, leading to a steady loss of heat at the surface that is large in open water due to the stronger air-sea temperature gradient (Qsensible ~–50 Wm–2). During daylight hours, the peak incoming shortwave radiation (Qsw up to +150 W m–2) exceeds this sensible heat loss and there is a brief net gain of heat in open water. The brief positive daytime surface flux is the lingering signal of the summer heating that originally formed the NSTM. This only occurs over open water; the albedo over the broken ice is much higher, and the net flux remains negative there. This brief example is representative of the early autumn ice edge, where spatial gradients modulate the heat fluxes as water temperatures evolve toward the freezing point. Recent work of Crews et al. (2022) uses autonomous systems to observe the full evolution of a similar region and provides a more comprehensive example.
Finally, we note the presence of PSW as secondary temperature maxima around 50 m in both profiles. As this is the result of inflow from Bering Strait, it is much more uniform across the region and does not have the kilometer-scale variation of the NSTM at the ice edge. Although the PSW does have a significant amount of total heat, it is generally too deep to mix up to the surface and affect Qnet on subseasonal timescales.
Discussion
Feedbacks and Coupled Processes
Estimation of the heat fluxes that determine cooling and freeze-up is challenging. The COARE algorithm used to estimate fluxes in the prior section was originally developed for the tropics and has only sparse verification in the Arctic (Persson et al., 2018). The algorithm lacks explicit treatment of polar processes, such as heat loss from freezing spray (Blackmore and Lozowski, 1993) and changes to the atmospheric drag coefficient based on ice cover (Andreas et al., 2010). These processes need to be understood well enough that they can be formulated in robust parameterizations and then applied in predictive models.
The unsteady and heterogeneous nature of these coupled processes makes parameterization particularly challenging. The atmospheric drag coefficient that controls the flux of momentum from the atmosphere to the ocean (and/or sea ice) is sensitive to the stability of the lower atmosphere, which can change rapidly near the ice edge (Guest et al., 2018). Similarly, the ice drag coefficient that controls the flux of momentum from sea ice to the ocean below is sensitive to ice fraction and geometry (Tsamados et al., 2014; Brenner et al., 2021). Changes to momentum flux affect mixing and, thereby, fluxes of heat.
As discussed, prior melting in the marginal ice zone has a stabilizing effect, via salinity stratification, that can trap heat in the NSTM. Whether this heat can be mixed to the surface (and thus adjust Qnet) depends on the momentum flux through the stratified surface layer. Models require accurate drag coefficients to predict this process, and those drag coefficients evolve as well (i.e., depend on ice concentration, wind speed, atmospheric stability). Coupling air-ice-ocean models is becoming routine (Bromwich et al., 2018), but the uncertainty related to momentum and heat flux coefficients remains significant (Martin et al., 2016).
Surface waves have not been traditionally considered a key part of the coupled Arctic air-ice-ocean system, but surface wave activity in the Arctic is increasing (Wang et al., 2015; Stopa et al., 2016; Thomson et al., 2016) as a direct result of sea ice reduction (Thomson and Rogers, 2014). Not only are the open water fetch distances greater, but it is now more likely for open water to persist well into the autumn, when storms increase in frequency and severity. Even in partial ice cover, wave growth is a function of fetch and is increasing (Smith and Thomson, 2016; Gemmrich et al., 2018). The possible feedbacks between the waves and the ice are numerous, and the large-scale implications remain an active area of research.
Recent modeling efforts include two-way coupling of wave-ice evolution (Williams et al., 2017), in which waves can alter the prognostic floe size distribution of sea ice and sea ice attenuates waves across the whole Arctic (Roach et al., 2019). Such mechanisms would tend to exacerbate ice loss by providing more lateral melting of broken floes. Other processes, such as enhanced upward mixing of ocean heat caused by Langmuir turbulence, have also been shown to cause ice loss (Smith et al., 2018). Conversely, waves can enhance ice growth in the formation of pancake ice (Roach et al., 2018), which has become a more prevalent ice type in the Arctic in recent years (Thomson et al., 2018; Nose et al., 2020).
Impacts of Delayed Freeze-up
The dramatic delay in the autumn return of sea ice across the Arctic has numerous impacts beyond purely geophysical processes. Changes to Arctic coastal environments, to ecosystems, and to human use patterns provide a few examples.
One of the most notable impacts of more open water in the autumn is an increased wave climate. Figure 7 uses the ERA5 reanalysis product to demonstrate the increase in wave activity across the western Arctic. For the domain shown in Figure 5, the sum of the wave energy throughout the month of October is increasing. There is also significant interannual variability, including the remarkable persistence of open water in 1998 (Maslanik et al., 1999). The overall signal is a transition from an October that was nearly devoid of waves in the 1980s to one that is now very active. It is clear that this is a consequence of the delay in autumn freeze-up, which a few decades ago was nearly complete by the beginning of October (Figure 5).
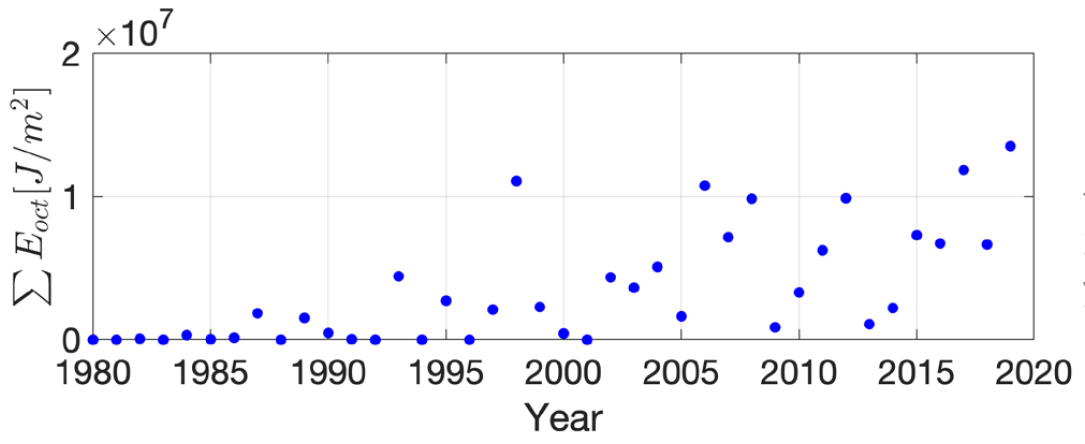
FIGURE 7. Cumulative wave energy in the western Arctic (region defined in Figure 5) from each October 1979–2020, based on ERA5 reanalysis data. > High res figure
|
The systematic delay of the autumn freeze-up means that Arctic coasts are exposed to more open ocean storms, which cause erosion and flooding (Overeem et al., 2011). The risk to permafrost coastlines is particularly severe, with Alaskan coastlines identified as highly vulnerable and already manifesting shoreline retreat rates of several meters per year (Irrgang et al., 2022). The pan-Arctic shoreline loss is 0.5 m yr–1 (Lantuit et al., 2012), and the northern Alaska rate is 1.4 m yr–1 (Gibbs et al., 2015, 2019). The presence of landfast ice does provide protection for the coasts (specifically from wave-driven processes), but that protection is preferentially in the spring (Hŏseková et al., 2021). In the autumn, newly forming ice along the coast is generally less effective in protecting the coast from wave-driven processes (Hŏseková et al., 2020).
Rolph et al. (2018) examine the freeze-up trends of three Alaskan Arctic coastal communities and find delays of approximately one month in the date of freeze-up for communities exposed to the open ocean. Additionally, there has been an increase in the number of “false freeze-up” events, which suggests an increase in the length of time during which communities are left without reliable ocean transport, as the ocean is neither suitable for boating nor frozen enough for on-ice travel. Various studies indicate that this problem will increase in the coming years (e.g., Casas-Prat and Wang, 2020).
In addition to changes in subsistence hunting and harvesting near the coasts, there are changes to human use patterns farther offshore. Interest in northern sea routes for commercial shipping has increased in recent years (Showstack, 2013), as have security concerns (US Navy, 2014, 2019). Already, there are estimates of conditions for commercial shipping in an ice-free Arctic (Nose et al., 2018). It is reasonable to expect that there will be more ship traffic as a direct consequence of a longer open-water season and less ice overall.
There are also changes to the Arctic ecosystem associated with delays in autumn freeze-up, including the northward shift of habitats and delays in migration (Baker et al., 2020). For example, recent work shows that polar cod, an essential part of the Arctic food web, are preferentially found beneath newly forming sea ice in autumn (Flores et al., 2020). Later ice thus means later polar cod, as well as the possibility of late autumn phytoplankton blooms (Ardyna et al., 2014). The long-term fate of larger animals, such as polar bears, is also clearly tied to sea ice trends (Regehr et al., 2016). For the Indigenous communities with ongoing subsistence practices, these ecosystem impacts are human impacts too. See Huntington et al. (2022) for a more complete description of the changes and challenges faced by local communities.
Conclusions
The autumn ice advance in the Arctic is happening later and later in the year, as part of a larger shift in the annual cycle of a warming planet. The trend is clear, even though many aspects of the relevant processes are still to be revealed. The seasonal ice advance is not a linear march southward as solar radiation declines. Rather, it is the evolution of a system controlled by atmospheric forcing, ocean memory, and multiple feedback mechanisms on both local and larger scales.
For the western Arctic Ocean (Canada Basin), the present state of knowledge about processes affecting delayed autumn freeze-up can be summarized as follows:
- There is an increased accumulation of ocean heat during summer months as a result of warming air temperatures and solar radiation.
- Ocean mixing events (i.e., storms) release subsurface heat in the autumn and thereby delay freeze-up.
- Strong lateral gradients and instabilities present at the evolving ice edge modulate the mixing events.
- The ocean can be preconditioned to refreeze by the presence of remnant sea ice.
- There is strong coupling at the atmosphere-ocean-ice boundary, including possible feedback mechanisms related to surface wave action.
It is highly certain that the delay in freeze-up will continue and grow, yet there is more work to be done in understanding the coupled processes that drive both freeze-up and its delay. To advance the state of knowledge, and to improve model predictive skill, we identify several needs for future work, including:
- Understand the drivers and impacts of near-surface (0–5 m) stratification during freeze-up.
- Determine the importance of lateral shear and associated mixing near the evolving ice edge.
- Develop a polar-specific version of the COARE algorithm to estimate bulk air-sea fluxes in the presence of sea ice, including improved parameterizations (e.g., drag coefficients) for air-sea exchanges of heat and momentum rather than coupling.
- Refine fully coupled atmosphere-ocean-ice models that include possible feedback mechanisms with surface wave activity.
Addressing these needs will require distributed observations of autumn freeze-up across the Arctic, especially sustained observations at or near the ocean surface. Autonomous platforms offer a promising approach to collecting data near the surface interface with minimal disturbances, but they present challenges in endurance and navigation (Meinig et al., 2015; Lee and Thomson, 2017; Zhang et al., 2019; Grare et al., 2021). Despite numerous recent and ongoing field efforts, there remains a gap in the observations needed to calibrate and validate heat flux estimates. These recommendations seek both to improve the accuracy of predictive models and to improve fundamental understanding of the Arctic system.
Acknowledgments
JT was supported by NASA grant NSSC21K0832, MMS by NSF OPP-1724467 and OPP-1724748, KD by NASA grant NNX17AK04G, and CL by ONR grant N000141612377. Emily Eidam provided CTD profiles from the CODA 2020 ice edge sampling collected from R/V Sikuliaq. Alex de Klerk collected the aerial image of the SWIFT drifter. Lucia Hŏseková calculated the fluxes from the CODA 2020 ice edge data. Two anonymous reviews helped to focus and improve the paper.

