Introduction
Argo is an international, near-global array of profiling floats (Roemmich et al., 2019) that has revolutionized observational physical oceanography and climate science (Johnson et al., 2022). Its public real-time data are contributed by many nations and used for a wide range of purposes, including weather forecasting. Regional pilot arrays that were initiated at the turn of the millennium grew to a sparse global array of about 900 floats in 2005 and on to ~3,900 floats today. Initially, only temperature and salinity profiles from the surface to a target depth of 2 km at nominally 10-day × 3° × 3° spacing were collected by the Core Argo mission. In subsequent years, that Core mission was expanded to include full-depth profiling—Deep Argo—and floats measuring additional biogeochemical parameters—BGC Argo. These three missions collectively are known as One Argo, a multidisciplinary, real-time, global ocean observing array (Owens et al., 2022). The NOAA Pacific Marine Environmental Laboratory (PMEL) has been involved with Argo implementation from the start. This article reviews major contributions of the PMEL Argo team, as well as goals and future plans.
Scientific Data Quality Control Contributions
At Argo’s inception, scientists were concerned that biofouling would be a substantial source of bias error in salinity data reported from Argo floats; even a thin coating on a conductivity cell can result in reported salinities that are considerably fresher than actual values. At the outset of Argo, the nascent PMEL Argo team (see online Supplementary Materials) took on the task of assessing and correcting this potential bias by building a software system that would map historical salinity data on potential temperature surfaces to float locations and recommend adjustments, with uncertainties, for Argo float data (Wong et al., 2003). This software was adopted internationally and has served as the backbone of scientific delayed-mode quality control (DMQC) for Argo, with subsequent improvements (Owens and Wong, 2009; Cabanes et al., 2016). The biofouling problem was smaller than initially feared, likely owing to an anti-fouling system in the widely used Sea-Bird SBE 41 CTD (conductivity-temperature-depth instrument). However, sometimes that anti-foulant initially coats the conductivity cell, requiring salinity adjustments. And while many CTD salinity calibrations are stable within the accuracy target of ±0.01 g kg–1, others require algorithm-recommended adjustments, either fresh or salty.
Scientists running observing systems look to optimizing them to increase the amount and quality of data collected. For example, during scientific investigations, the PMEL Argo team noticed that a few points at the base of the mixed layer were gravitationally unstable owing to anomalously fresh salinity values, especially when the float had risen through a very strong thermocline. This artifact results from the thermal inertia of the float’s conductivity cell (Johnson et al., 2007). If the conductivity cell is not at the same temperature as the water, it exchanges heat with the water as it moves through it, and going from cold to warm, as is the usual case for sampling during ascent, decreases the measured conductivity. Thus, a mismatch between the measured temperature and the temperature in the cell causes anomalously low salinity values to be reported while (and shortly after) transiting from cold to warmer waters. We estimated the cell correction coefficients, wrote code to make the correction, and this improvement was adopted by the international Argo community.
Core Argo Contributions
The PMEL Argo team spun up float capability in 2001 and 2002 with an array of 22 Argo equivalent floats deployed in the deep Bering Sea to monitor temperature and salinity variability. These were APEX floats fabricated and carefully tested by the Argo group at the University of Washington, with parts purchased from Webb Research (now Teledyne Webb Research).
The PMEL Argo team became a full-fledged provider of Core Argo floats in 2004, and deployed the first PMEL Argo float, an APEX model from Webb Research, in early 2004 (see online Supplementary Materials). We purchased fully assembled and ballasted “deployment ready” floats, opened them to replace their alkaline battery packs with much longer-lasting lithium packs, inspected them, tested subsystems, made simple repairs as needed, and returned some floats to the manufacturer for more complex repairs. We also built laboratory software that logged every communication with each float from the time it arrived in the laboratory until it was deployed, a record that has been invaluable in detecting multiple issues with float subsystems, including CTDs. This procedure resulted in field performance of PMEL floats that far exceeded that of groups using the same floats without testing (e.g., an 8.2-year average survival rate for PMEL APEX floats versus a 4.4-year average for the entire international APEX fleet, including PMEL floats). It also allowed us to provide feedback to the manufacturers that could be used to improve float performance for all customers. In subsequent years, we have procured Sea-Bird Scientific Navis floats and have recently purchased S2A and ALTO floats from MRV Systems.
To date, the PMEL Argo team has deployed over 1,440 Argo floats around the globe, concentrating on the Pacific Ocean, especially the tropics, with ~500 active as of March 30, 2023 (Figure 1a). That amounts to about one-eighth of the Argo array, typical of the fraction of the Argo array that we have been responsible for over the past decade (Figure 1c). All PMEL-contributed Argo array profiles, almost 20,000 annually in recent years, are subject to scientific delayed-mode quality control by our team.
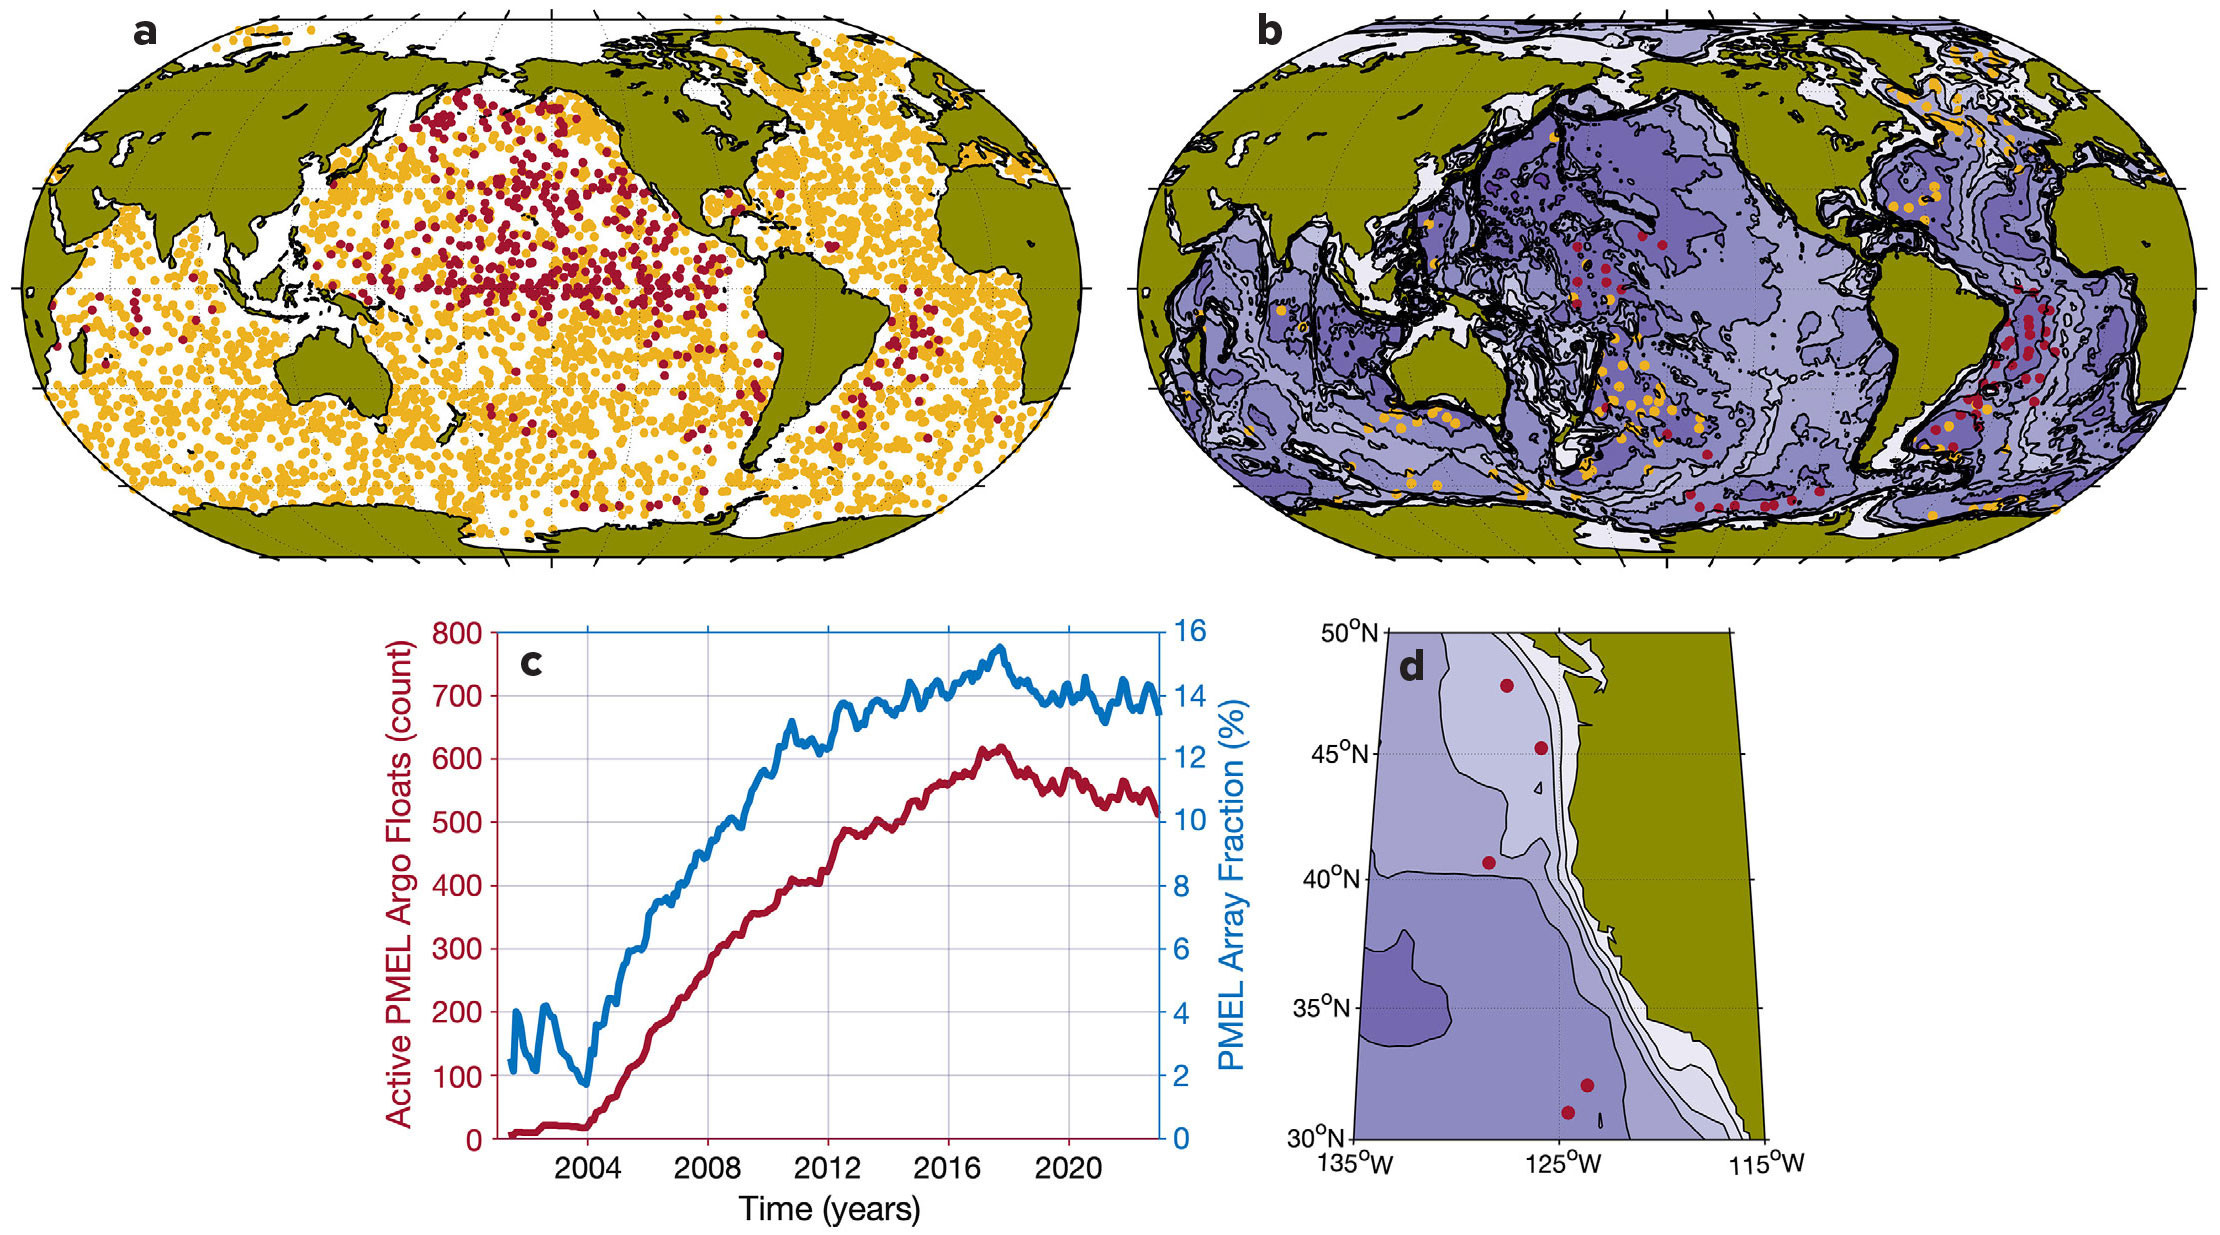
FIGURE 1. (a) Global Argo array positions as of March 30, 2023, (yellow dots) and PMEL float positions (red dots) according to OceanOPS. (b) Deep Argo float positions as of March 30, 2023, with bathymetry contoured at 1,000 m intervals (increasingly purple with increasing depth). (c) Active Argo float profile counts for PMEL (red line, left axis) and the percentage of the full array they comprised (blue line, right axis) from 2000 to 2022. (d) Active PMEL Biogeochemical (BGC) Argo float positions as of March 30, 2023 (red dots) with bathymetry contours. > High res figure
|
Deep Argo Spin-up
Deep Argo aims to establish a global array of floats (e.g., Johnson et al., 2015) that profile from the surface to the seafloor (or to 6,000 dbar if the seafloor is deeper than that). In April 2016, PMEL entered a four-year “Jump Starting Deep Argo” project with the Paul G. Allen Family Foundation (PGAFF). The foundation purchased 33 Deep SOLO floats from MRV Systems, providing incentive for that manufacturer to spin-up fabrication of those floats, and then donated them to PMEL for deployment. PGAFF also provided ship time on R/V Petrel to implement a new Brazil Basin Deep Argo regional pilot array (Figure 1b), which complemented other Deep Argo regional pilot arrays downstream of deep and bottom water formation regions in the Southwest Pacific, the Southeast Indian, and the North Atlantic Oceans. In May 2019, we deployed the first Brazil Basin Deep Argo float from a ship-of-opportunity, and by January 2021 the Brazil Basin Deep Argo Pilot Array was fully deployed. In addition to the PGAFF-donated floats, we have deployed another 23 Deep Argo floats with NOAA funding to extend the South Atlantic pilot array southward into the Argentine Basin, to augment and expand the Southwest Pacific Basin Deep Argo Pilot array, and to initiate a new Deep Argo Array in the Eastern Pacific sector of the Southern Ocean (Figure 1b).
Biogeochemical Argo Spin-up
In FY2019, PMEL was granted NOAA Oceans Portfolio funding to begin a BGC Argo pilot array in the California Current Large Marine Ecosystem (Figure 1d). The Geophysical Fluid Dynamics Laboratory undertook sampling and deployment modeling studies to help inform array design, and from FY2019 through FY2021, five BGC APEX floats were deployed. These floats were supplied by project partners at the University of Washington and Monterey Bay Aquarium Research Institute and are equipped with sensors that measure temperature, salinity, pressure, dissolved oxygen, pH, nitrate, optical backscatter, and chlorophyll fluorescence. In FY2022, we deployed two Sea-Bird Scientific Navis BGCi+pH floats equipped with sensors for the same parameter suite, bringing the pilot array to seven BGC floats, six of which are currently active.
Scientific Analyses
Since 2019, over 500 manuscripts using Argo data have been published annually in refereed scientific journals. PMEL publications using Argo data number well over 60, with topics ranging from planetary wave signatures and dynamics through warming of bottom waters to Earth’s energy imbalance and sea level rise. For example, author Johnson served as a lead author of the “Observations: Ocean” chapter (Rhein et al., 2013) of the Fifth Assessment Report by Working Group One to the Intergovernmental Panel on Climate Change, where Argo data played key roles in assessing ocean heat uptake, salinity changes, and sea level rise. In addition, for every year since 2006 we have used Argo data to assess global ocean heat content and salinity distributions and their relations to climate in the “Global Oceans” chapter of the annual “State of the Climate” report (e.g., Johnson and Lumpkin, 2022). Johnson has also served as an editor of that chapter for six years and counting.
Our early analyses focused on regional oceanography in areas where early Core Argo pilot arrays were deployed (before going global). We used data from the first PMEL Argo array in the Bering Sea to improve estimates of the Bering Slope Current (Johnson et al., 2004), to study interannual variations in the ventilation of the Bering Sea (Wirts and Johnson, 2005), and to diagnose variations in flow through the Bering Strait (Aagaard et al., 2006). Later, when a longer time history and basin-wide coverage allowed estimates, we studied currents and interannual upper ocean temperature and salinity variability in the Bering Sea (Johnson and Stabeno, 2017) and the Alaskan Stream (Logan and Johnson, 2017). We also compared Argo data to historical shipboard data to look at water mass variations, for example, to study multidecadal trends in Antarctic Intermediate Water (Schmidtko and Johnson, 2012).
As the array became near-global, and had been implemented long enough that monthly maps of temperature and salinity were feasible (Roemmich and Gilson, 2009), we began to use float-derived profiles and the monthly maps to investigate the structure and dynamics of features such as equatorial deep jets (Youngs and Johnson, 2015) and deep-reaching Rossby Waves, both off-equatorial (Johnson, 2011) and equatorial (Zanowski et al., 2019). We also illuminated subsurface (Johnson and Birnbaum, 2016) and global (Johnson and Birnbaum, 2017) responses to the El Niño-Southern Oscillation as the Argo time series grew longer.
PMEL efforts have advanced scientific understanding of ocean warming using Argo data—a vital contribution because the ocean accounts for about 90% of the total warming in Earth’s climate system (e.g., Rhein et al., 2013). We have contributed to analyses of sea level budgets (Cazenave et al., 2018), specifically the contribution of thermal expansion owing to ocean warming. Argo data have remarkably improved the accuracy of the rate of ocean warming (Johnson et al., 2016). We have shown that Argo and top-of-the-atmosphere satellite measurements of incoming and outgoing radiation agree on a near-doubling in Earth’s warming rate over the last 15 years (Loeb et al., 2021). We have also shown how, as the data accumulate, we can detect statistically significant ocean warming trends over an increasingly large fraction of the upper ocean (Johnson and Lyman, 2020). Using Argo data, we have investigated the upper ocean signatures of marine heatwaves in the North Pacific Ocean, showing how their deep penetration and associated salinity changes contribute to their persistence (Scannell et al., 2020).
Using CTD data from recent Deep Argo regional pilot arrays in concert with CTD data from historical hydrographic sections, we have demonstrated the usefulness of Deep Argo data in quantifying decadal warming trends in Antarctic Bottom Water in the Southwest Pacific Basin (Johnson et al., 2019), the Brazil Basin (Johnson et al., 2020), and the Argentine Basin (Johnson, 2022) with much more certainty than analyses using CTD data from repeat hydrographic sections alone (Purkey and Johnson, 2010).
The PMEL Argo team has also developed physical oceanographic climatologies. MIMOC is a widely used monthly mean seasonal cycle climatology (Schmidtko et al., 2013) that melds maps made on isopycnal surfaces in the subsurface ocean with surface mixed layer maps. GOSML is statistical mixed-layer climatology (Johnson and Lyman, 2022) that includes values at the 5th, 50th, and 95th depth percentiles for each month, because mixed layer statistics are non-normal, and investigators are often interested in the deepest (or sometimes shallowest) values.
Our analyses of data from the BGC Argo pilot array led to the development of two gap-filled, monthly-resolved data products that use machine learning techniques and insights about observing net primary productivity in an ecologically significant coastal upwelling region. RFR-CCS is a carbon dioxide gas partial pressure (pCO2) data product for surface waters of the California Current Large Marine Ecosystem that spans 1998 through 2020 (Sharp et al., 2022). GOBAI-O2 is a near-global dissolved oxygen concentration data product for surface waters down to 2,000 m over 58 depth levels that spans 2004 through 2022 (Sharp et al., 2022). The pCO2 product was developed following the identification of large global discrepancies between existing, widely used data products (Laruelle et al., 2017; Landschutzer et al., 2020) and observations from the BGC Argo pilot array and regional moorings. The dissolved oxygen product was developed to provide the first global, three-dimensional, monthly-time-evolving view of ocean oxygen, leveraging high-quality observations from profiling floats and ship-based surveys.
Community Engagement
In FY 2023, The PMEL Argo team launched its Adopt-A-Float Program (https://www.pmel.noaa.gov/gobop/aaf) to make meaningful connections with local high schools, grow an informed citizenry, and interest students in ocean science and technology. The program, conducted in coordination with NOAA’s Atlantic Oceanographic and Meteorological Laboratory in Miami, Florida, is modeled after successful, similar programs in the United States and France. It allows local high school and technical school classrooms to adopt a Core, Deep, or BGC float slated for upcoming deployment, name the float, and submit a logo to be associated with the float. PMEL-affiliated scientists and students visit the classroom, share information about ocean science and the international Argo Program, conduct hands-on demonstrations of oceanographic concepts, and teach the students how to monitor their float online after deployment.
To facilitate easy access, processing, and visualization of all Argo data, including BGC Argo data stored in synthetic profile files on servers at the Global Data Assembly Centers, the PMEL Argo team collaborated with scientists at other institutions to develop and release the OneArgo-Mat (Frenzel et al., 2022) and One Argo-R (Cornec et al., 2022) toolboxes, named after the One Argo mission (Owens et al., 2022). The toolboxes are freely available on the PMEL GitHub page and have been advertised widely to broaden the community of Argo data users.
Looking Forward: Challenges and Opportunities
The PMEL Argo team is committed to the “One Argo” strategy of an integrated array for Core, Deep, and BGC missions (Roemmich et al., 2019). We are presently deploying both Deep and BGC floats in regional pilot arrays. Our Deep Argo float deployments have been in the western South Atlantic and South Pacific Oceans, where Antarctic Bottom Water is warming close to its source. Our BGC deployments have been off the west coast of North America in the California Current Large Marine Ecosystem, which has distinct biological provinces, an economically important ecosystem, and heightened vulnerability to ocean acidification and deoxygenation due to upwelling. The Deep Argo mission, when globally implemented, will allow exploration of changing deep ocean waters that are historically extremely undersampled. The BGC mission, when fully implemented, will revolutionize the study of ocean biogeochemistry similar to the way that Core Argo array revolutionized large-scale physical oceanography in the upper ocean.
However, there are multiple challenges. First, funding is required to procure sufficient floats to implement these arrays. Second, as that funding ramps up, we will need both laboratory infrastructure and human resources in place. Deep and BGC Argo floats are larger and more complex than Core Argo floats and require more space than our current lab accommodates. Going from three parameters on Core and Deep floats to nine or ten on BGC floats will greatly increase the complexity of quality controlling the data. Coordinating deployments for a One Argo array that spans the globe with Core, Deep, and BGC floats all (relatively) evenly distributed presents a challenge for the entire international Argo community. It may require more use of charter vessels, including sailboats, which have already been essential in maintaining the Core array. Maintaining and improving float and sensor performance is another challenge for the entire international Argo community.
The remarkable scientific progress achieved with Core Argo over the last two decades would have been very difficult to predict at its outset. Our understanding of and ability to monitor changes in deep ocean circulation, temperature, and salinity will certainly improve substantially as a global Deep Argo array is fully implemented. Similarly, a global BGC Argo array will provide insights into ocean carbon and nutrient cycling, deoxygenation, productivity at the base of the food chain, and ecosystems, including living marine resources.
One recent focus at PMEL has been the use of machine learning to exploit the synergies between the in situ temperature and salinity profiles from Argo and global highly resolved satellite measurements of sea surface height and sea surface temperature (Lyman and Johnson, 2023, see Figure 2b). This effort has substantially improved our ability to quantify the amount of heat absorbed by the ocean. It is also a promising avenue for improving the resolution of maps of subsurface salinity beyond those using Argo data alone. We are also applying these techniques to mapping ocean oxygen (Sharp et al., 2022, see Figure 2a), the most prolific of the BGC parameters measured to date in order to provide new insight into the regional distribution of ocean oxygen values, which are generally declining with time when globally integrated. We anticipate integrating and improving our present physical and oxygen climatologies, and then extending this work to other BGC parameters, with regular updates.
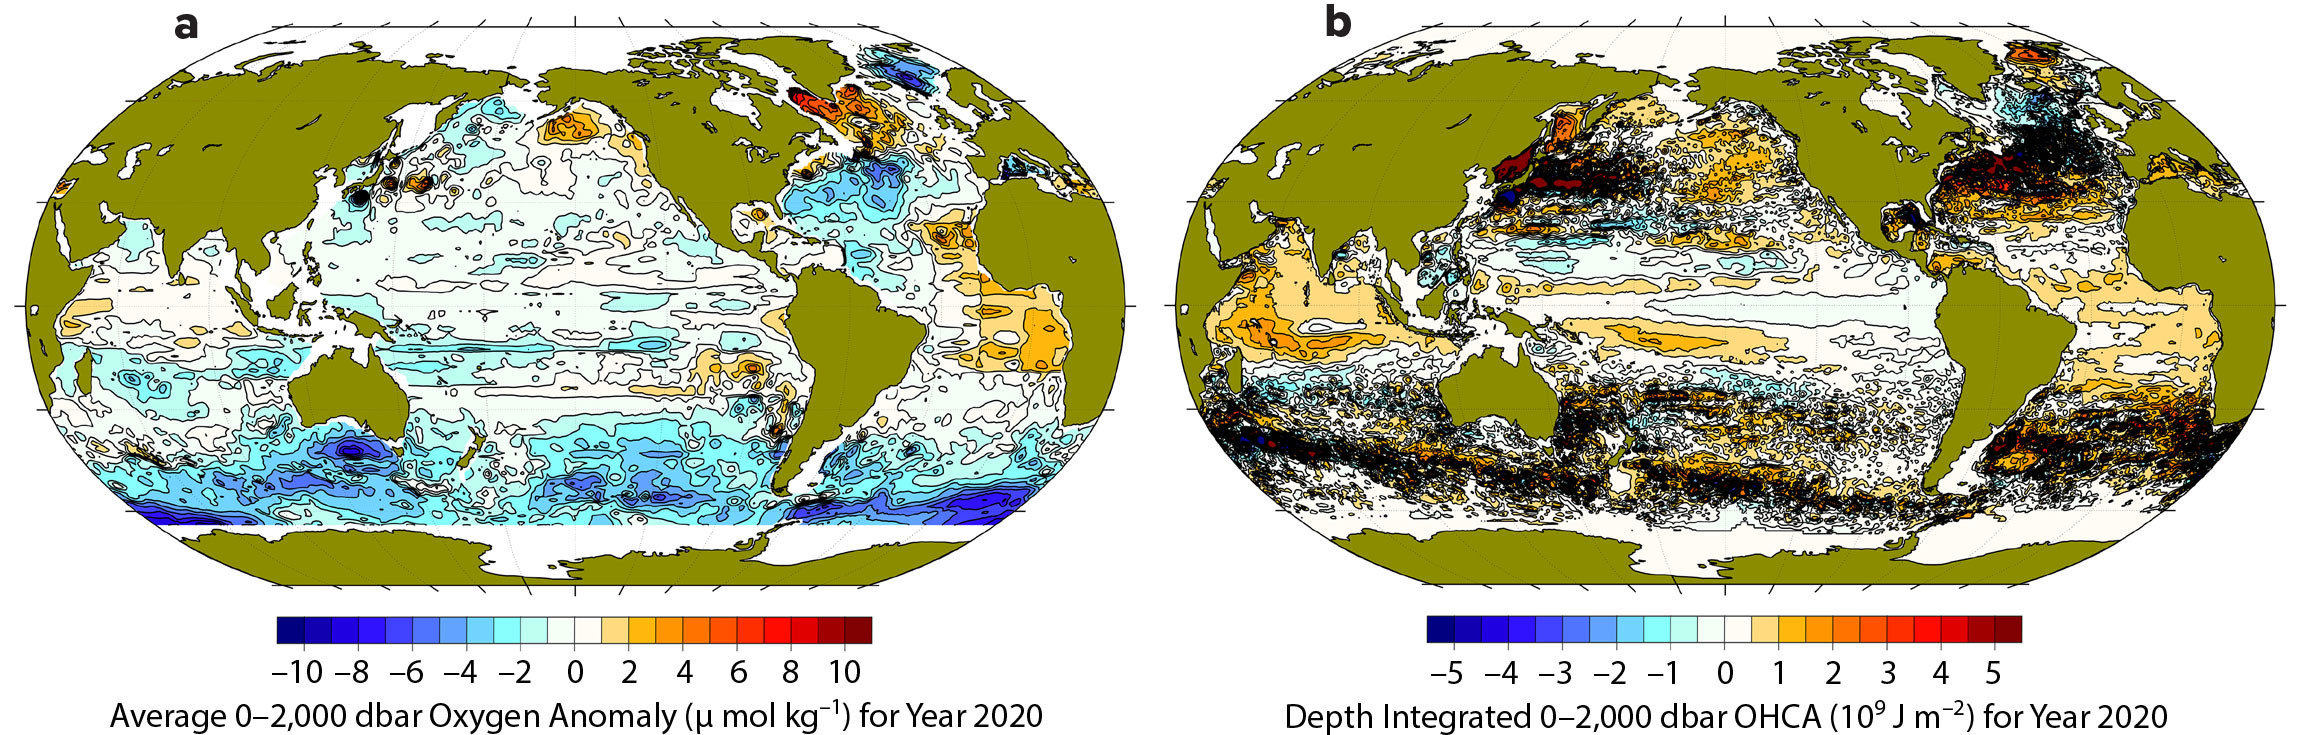
FIGURE 2. (a) Map of 0 to 2,000 m depth-averaged oxygen anomaly (color contours in μmol kg–1) in 2020 relative to a 2004–2021 mean (Sharp et al., 2023). (b) Map of 0–2,000 m ocean heat content anomaly (OHCA, color contours in 109 J m–2) in 2020 relative to a 1993–2021 mean (Lyman and Johnson, 2023). > High res figure
|
Acknowledgments
GCJ and AJF are supported by NOAA PMEL and the NOAA Global Ocean Monitoring and Observation Program. This is PMEL Contribution Number 5461. The authors have no financial or other conflicting interests regarding this paper. We thank the reviewers for helpful comments that improved the manuscript.