Full Text
The Ocean Twilight Zone
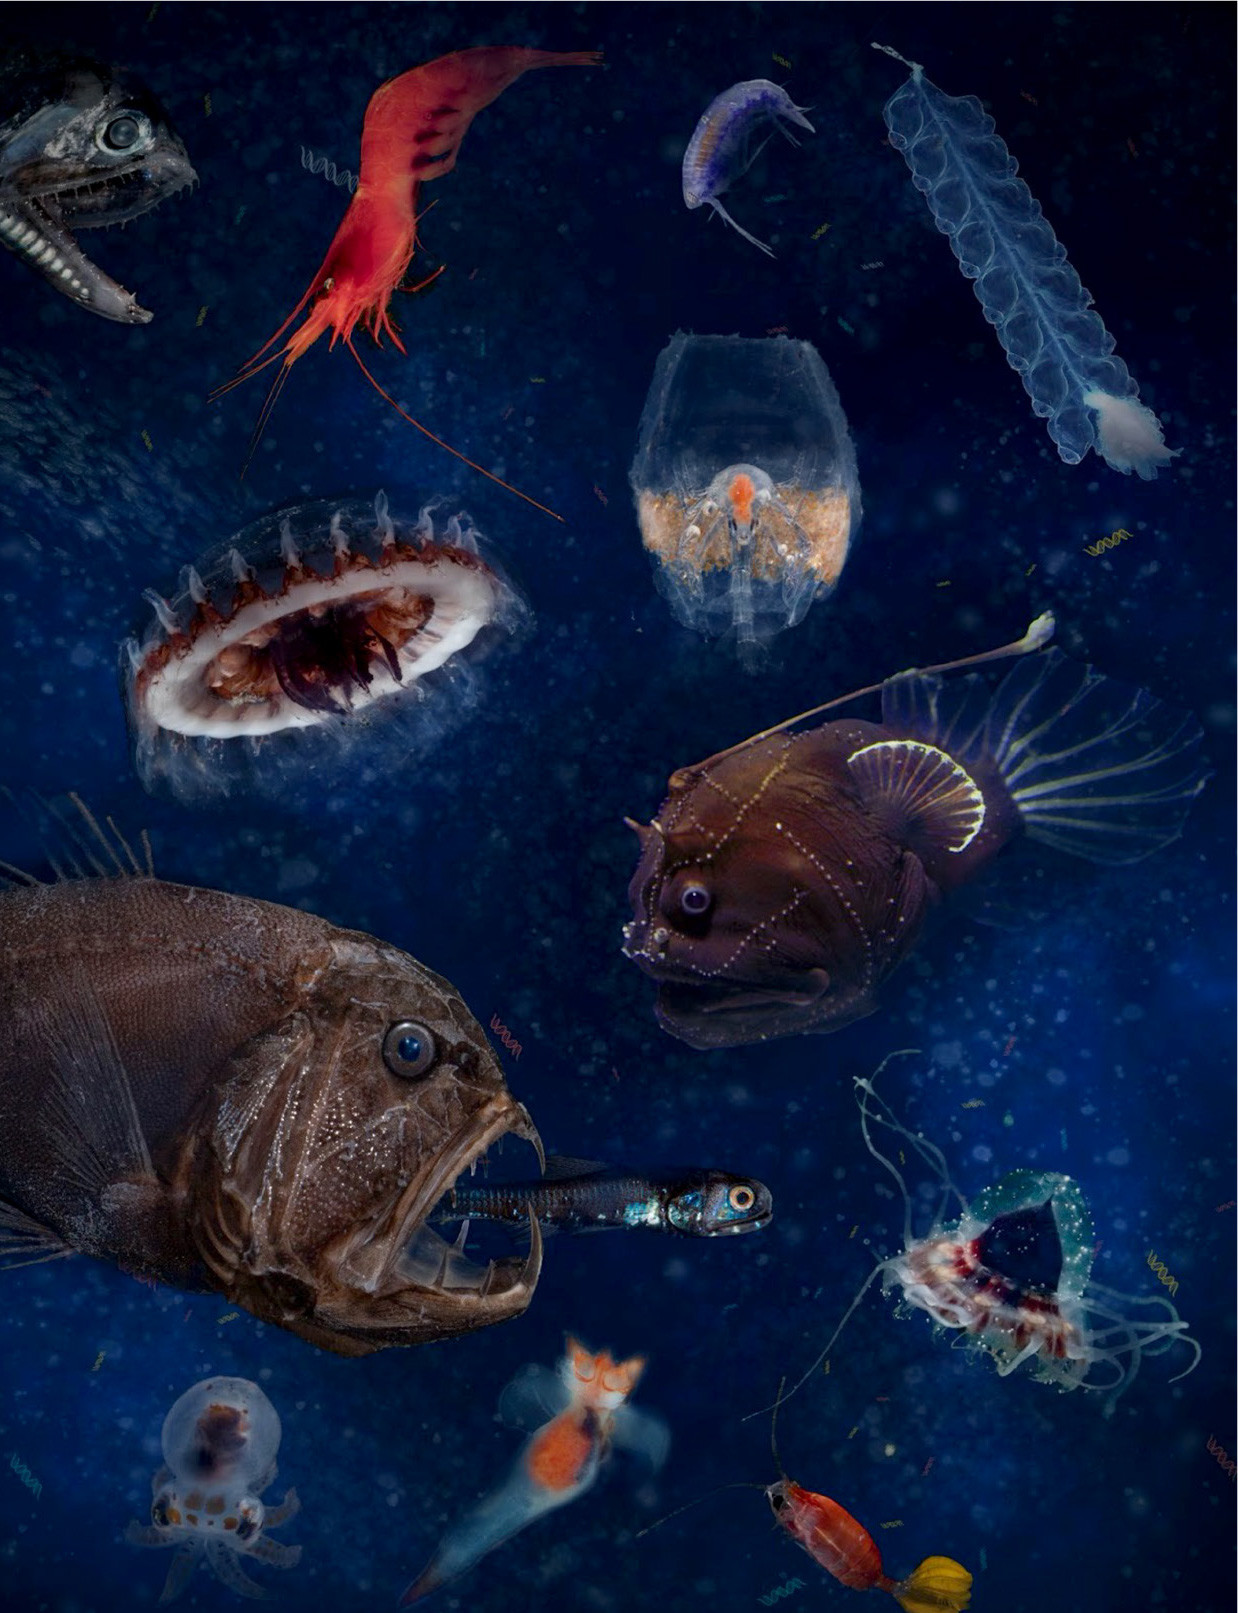
The ocean’s vast twilight, or mesopelagic, zone (200–1,000 m depth) harbors immense biomass consisting of myriad poorly known and unique animal species whose quantity and diversity are likely considerably underestimated. As they facilitate the movement of carbon from surface waters to the deep sea through feeding and migratory behaviors, ocean twilight zone (OTZ) animals are vital to regulating Earth’s climate (Ducklow et al., 2001). However, anthropogenic threats, such as climate change, ocean acidification, pollution, and overfishing pose an imminent threat to OTZ animals. Long-term spatially and temporally intensive observations are essential to our understanding of biodiversity in the OTZ, to resolving global carbon cycles, and to monitoring ocean health. Environmental DNA (eDNA) analysis, which involves studying the trace genetic signatures of organisms (Figure 1), is a promising approach to filling this urgent need. eDNA can be sampled and diagnostic genetic markers (“barcodes”) can be sequenced in order to detect the animals inhabiting a given water parcel. Other laboratory protocols (e.g., quantitative PCR, or “qPCR” and “digital droplet PCR”) can be applied to facilitate quantitative assessments of specific target species (Eble et al., 2020). In seagoing oceanographic research, eDNA assessment is transitioning from being considered an experimental approach to becoming an established routine that can be scaled up to match ocean observing needs.
|
|
Technological Needs for OTZ eDNA Analyses
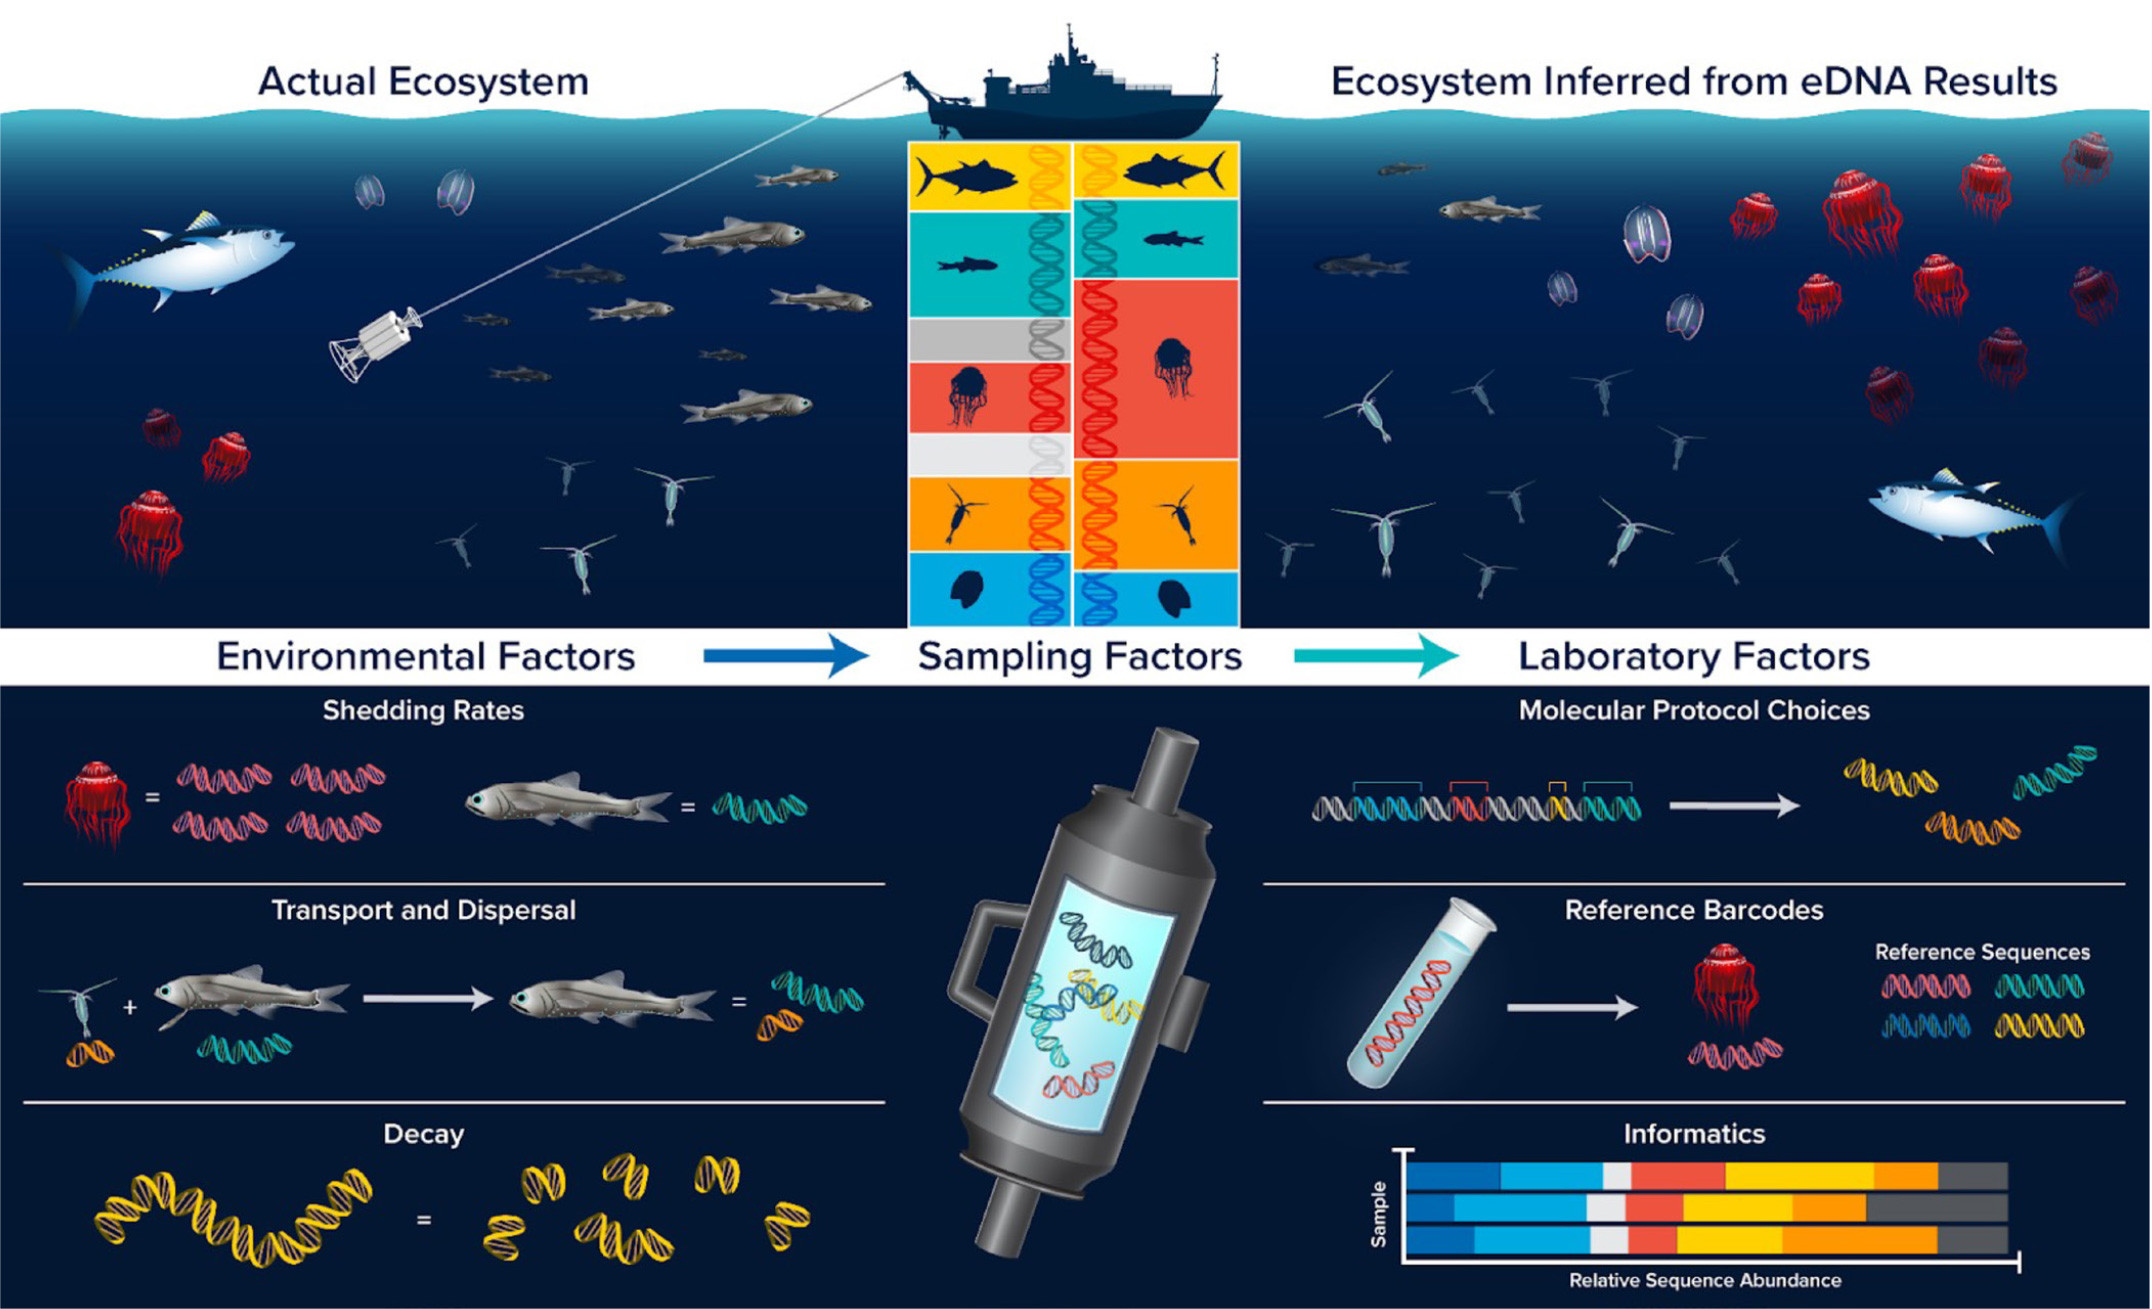
As eDNA analyses are incorporated into mid- and deep-water oceanographic research and observing platforms, new technologies and an improved understanding of eDNA distributions and their relationships to animal distributions and sampling methods are required. Each step of the eDNA analysis process, from experimental design and sample collection to data analysis, impacts the final result (Figure 2). Of the different steps that could introduce bias (Eble et al., 2020; Shelton et al., 2022), sampling approaches and strategies are particularly underexplored (Govindarajan et al., 2022).
|
|
The OTZ has unique attributes requiring special considerations for sampling. This habitat is massive in size, difficult to access, and has heterogeneously distributed biomass. Traditional sampling requires extensive seagoing effort and expensive instrumentation. Notably, a substantial fraction of OTZ animal biota undertakes daily vertical migrations—moving up to surface waters to feed at night and back down to depth during the day. This process, considered the largest migration of biomass on our planet, greatly facilitates carbon transfer to the deep sea. Understanding the relationships between diel vertical migration, the biological carbon pump, and Earth’s climate requires OTZ biodiversity observations at a scale and scope beyond what traditional methods like net tows can offer.
For eDNA analyses to fill this critical need, the following questions must be addressed. How do we effectively and representatively sample such a vast environment? What sampling strategies and spatiotemporal scales best represent mesopelagic biodiversity distributions and phenomena? In a setting where both the animals and the surrounding water move horizontally and vertically, how can we know if eDNA signals represent biodiversity signatures of the sampling location or elsewhere? Answers to these questions are vital to guiding the development of technologies that will fulfill ocean observing needs.
Niskin Bottle eDNA Sampling
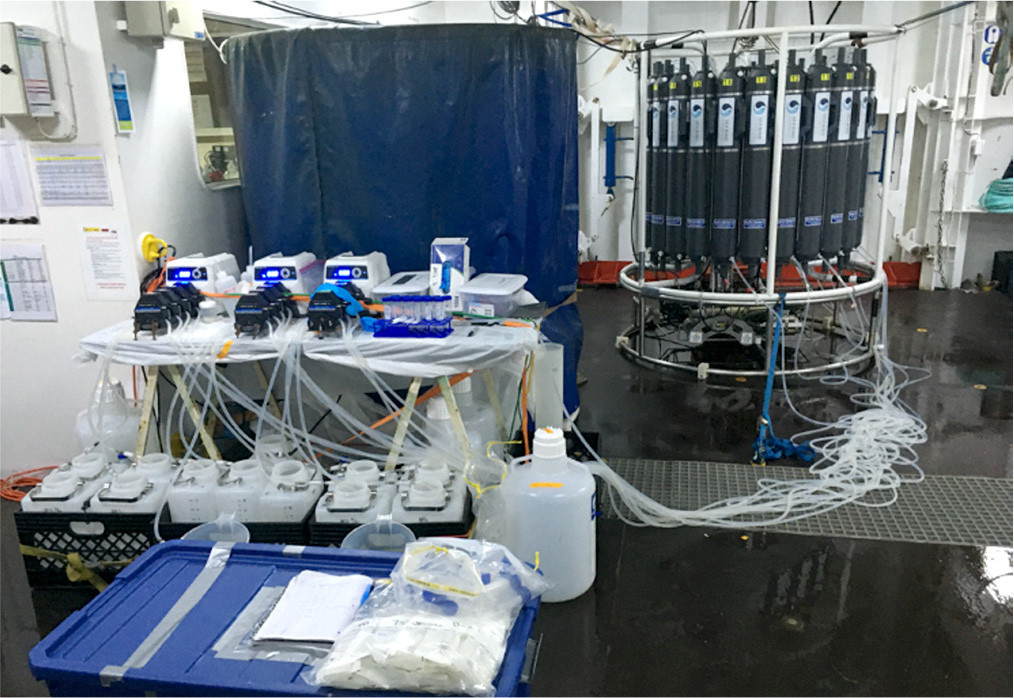
A primary impediment to the expansion of eDNA biodiversity assessments into mid- and deep-ocean observing programs is the lack of adequate sampling capability. Most seawater samples are collected via Niskin bottles mounted to oceanographic instruments. Niskin bottles are most commonly deployed on CTD rosettes, although they can also be deployed on submersibles. eDNA sample volumes are typically between 1 liter and 5 liters and are often limited by the size of the Niskin bottle and by other competing needs for seawater (e.g., nutrient and biogeochemical analyses). There are only a modest number of bottles per deployment (typically between 8 and 24), limiting the number of target depths sampled during a given deployment. The number of independent samples becomes smaller if two- or three-fold sample replicates are taken. Water collected by the bottles is filtered onboard the ship to capture the eDNA once the CTD rosette is recovered, usually with peristaltic or vacuum pumps (Figure 3). The filtration process is labor intensive. For example, peristaltic pumps connected to commonly used encapsulated Sterivex filters (Millipore Sigma) have a flow rate of around 100 milliliters per minute (manufacturer’s documentation) resulting in about 50 minutes of filtering time for a 5-liter water sample. Multiple bottles must be filtered simultaneously, potentially providing opportunities for handling errors and contamination.
|
|
Autonomous eDNA Samplers and Sampling Platforms
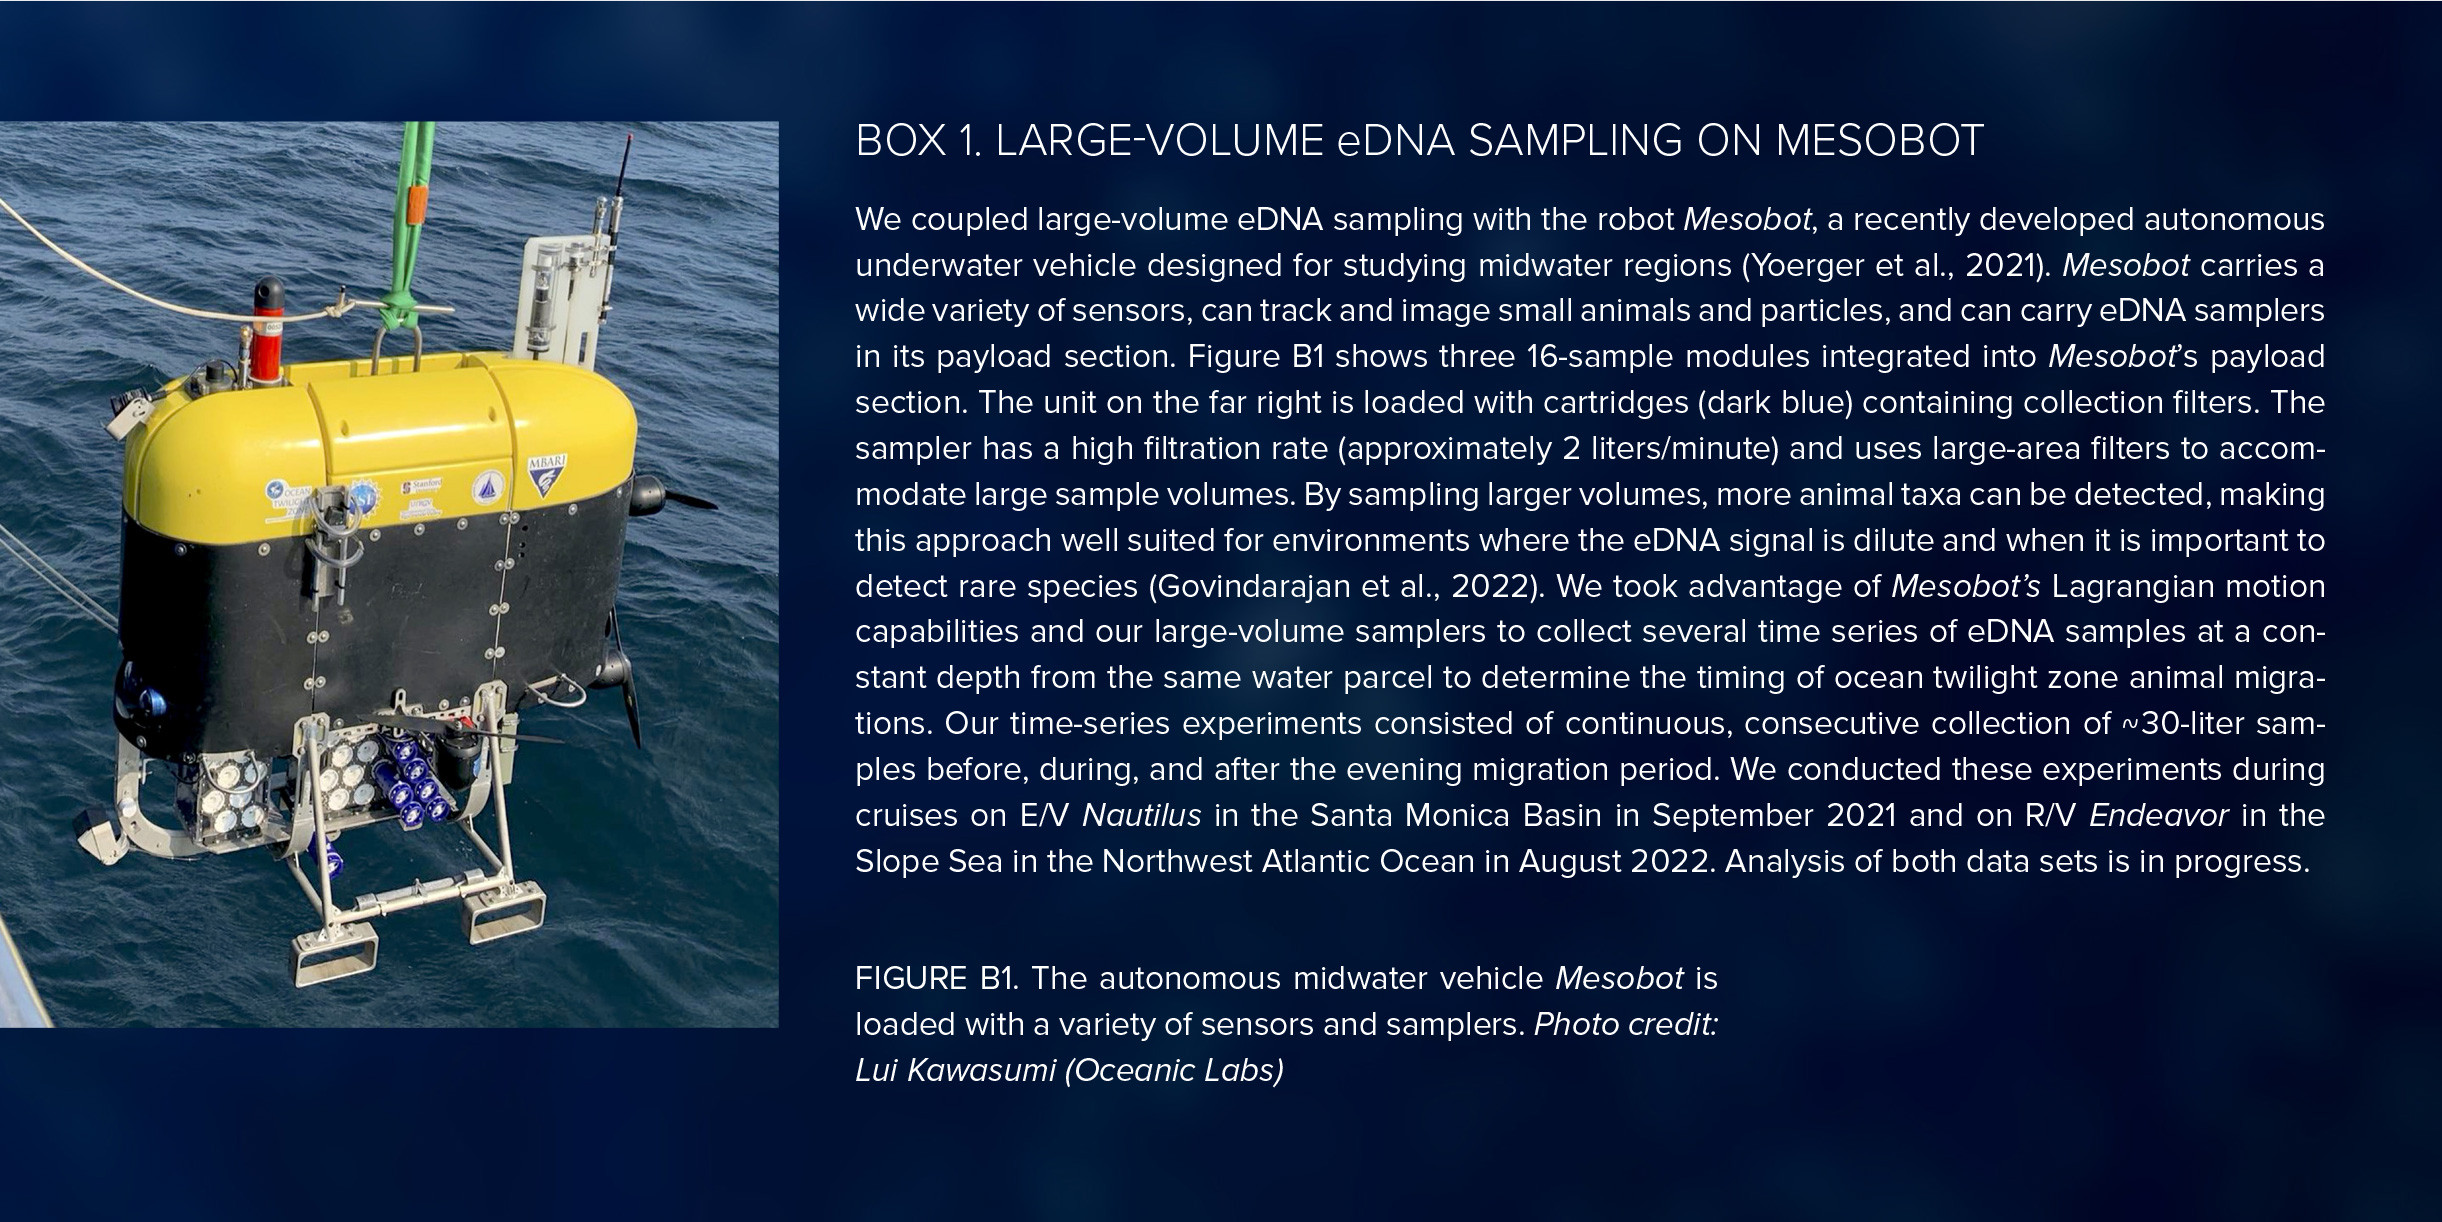
Autonomous sampling with in situ filtration is an alternative approach for sample collection. In situ filtration offers numerous advantages, including reduced labor, fewer opportunities for contamination, larger sample volumes, and fewer experimental design constraints (Yamahara et al., 2019; Govindarajan et al., 2022; Truelove et al., 2022). Autonomous samplers must be mounted on platforms that access the target environment, such as autonomous underwater vehicles (AUVs), remotely operated vehicles (ROVs), or towed instruments. For example, the Environmental Sample Processor (ESP) has been incorporated into a long-range AUV (Yamahara et al., 2019; Truelove et al., 2022) and can take up to 50 eDNA samples, filtering seawater at a rate of about 1 liter per hour. In a different approach, a large-volume eDNA sampler that could take 12 samples was mounted on the midwater robot Mesobot to filter seawater at a rate of about 2 liters per minute (Govindarajan et al., 2022). A newer version of the large-volume sampler can take up to 16 samples and can be daisy-chained with additional sampler units for greater collection capacity (recent work by authors Adams, Govindarajan, and Yoerger, and Lui Kawasumi of Oceanic Labs) and deployed on both Mesobot (Box 1) and the towed acoustic and imaging instrument Deep-See (Box 2).
|
|
|
|
Sampling Strategies
Standard CTD-mounted Niskin bottle sampling strategies typically involve a vertical profile with samples collected at targeted depths. Water is collected instantaneously at a point when the designated bottle is triggered. Animals are patchily distributed and often found in layers, and real-time acoustic backscatter data from an echosounder can be used to guide the selection of sampling depths by identifying concentrations of biomass (Govindarajan et al., 2021). Niskin bottles may be mounted on other platforms, such as ROVs or AUVs, permitting greater sampling flexibility (Everett and Park, 2018).
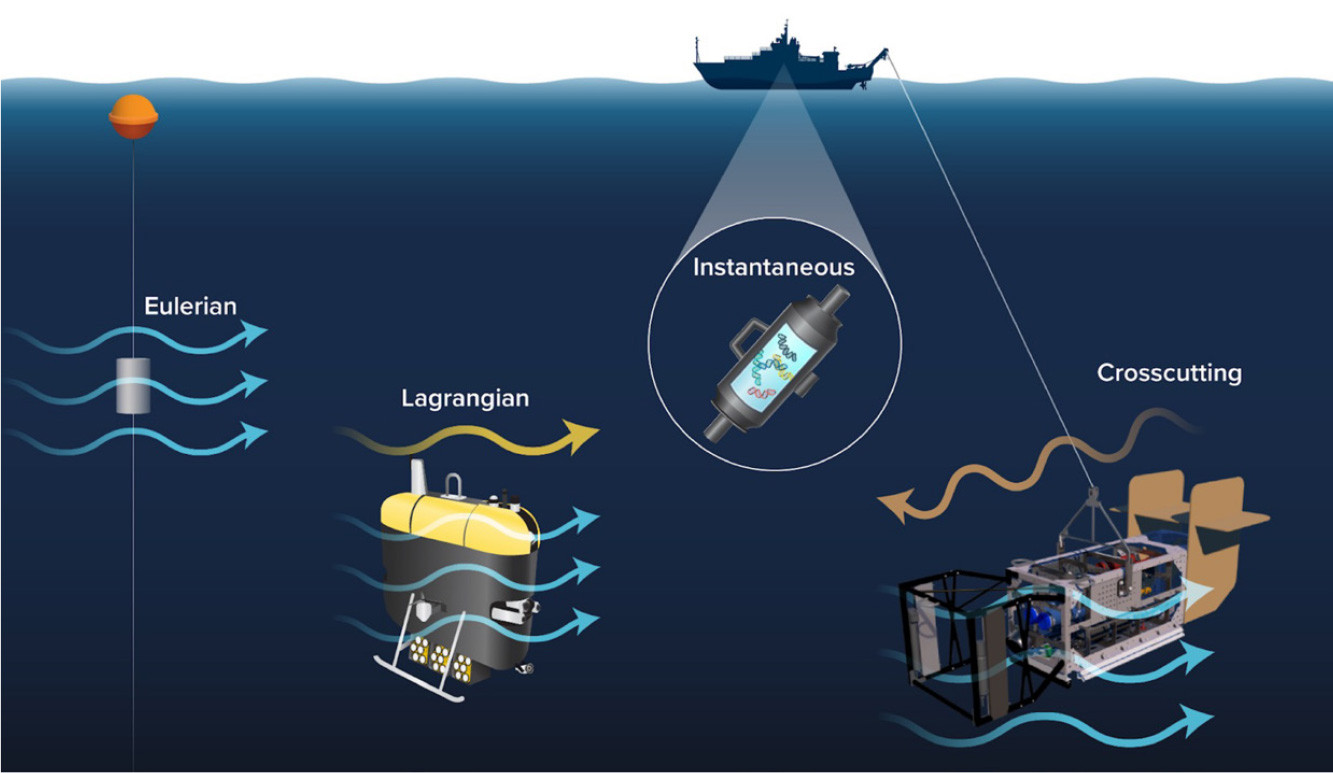
In contrast to instantaneous Niskin bottle sampling, samplers with in situ filtration filter continuously over a period of time (Figure 4). Sampling is “Lagrangian” if the sampler collects samples as it moves along with the water parcel. Mesobot, designed to track organisms and particles (Yoerger et al., 2021), can act as a Lagrangian sampling platform (Box 1). In contrast, non-Lagrangian sampling is integrative. For example, “Eulerian” sampling is a type of non-Lagrangian, integrative sampling where the sampler is at a fixed location (e.g., from a mooring or a stationary vessel), filtering as the water flows past. Sampling is also integrative if the sampler is mounted on non-Lagrangian mobile platforms, such as some AUVs and towed instruments like Deep-See (Box 2). These platforms may traverse water parcels over the duration of sampling, resulting in “crosscutting” spatially and temporally integrated samples. This is the case with powered autonomous vehicles that must maintain forward motion to stay in control while surveying. These often move in a “sawtooth” pattern (e.g., Govindarajan et al., 2015), although the integration can be minimized by containing the vehicle movements within the moving flow. For example, the vehicle can travel forward while turning continuously in tight circles (Truelove et al., 2022). As a result, the vehicle remains with a water mass of known size, rendering it effectively Lagrangian. Integrative sampling also occurs with Deep-See, which, as a towed instrument, moves with the ship, potentially against the prevailing flow and traversing water parcels (Box 2). It is important to recognize that as these approaches (instantaneous, Lagrangian, and non-Lagrangian) may be sampling different entities, they may not be directly comparable.
|
|
Filtration Time and Sample Volume
The OTZ environment is immense, and the animals that live there (and their eDNA traces) are patchily distributed. Current eDNA sampling strategies may not yield representative results as they may not match the appropriate temporal and spatial scales of eDNA variation. Field observations have demonstrated that eDNA concentrations decrease with depth and that there can be high variability in the types and proportions of taxa found in sampling replicates (Easson et al., 2020; Govindarajan et al., 2022). These observations indicate that typical sample volumes (1 to 5 liters) are not aligned with eDNA distributions and that sampling strategies used in shallow and coastal environments may need to be increased for mid- and deep-ocean waters. Autonomous sampling can facilitate the filtration of larger sample volumes. To obtain these larger volumes while minimizing unwanted spatial and temporal sample integration, higher sampler filtration rates are needed (Govindarajan et al., 2022). Ideally, a sample should be taken within the confines of the target water parcel. However, the size of the target parcel is usually undefined or unknown, given the lack of knowledge about eDNA distributions. Determining optimal sample volume, the number of replicates, and the spatial and temporal sampling frequencies will require further advances in sampling technology, including developing low-cost samplers that can be intensively deployed over large areas.
Co-Collection of eDNA with Net Tow and Acoustic Sensor Data
eDNA sampling is complementary to other sampling and sensing methods. Traditional net tows and trawls collect physical specimens, which can provide insights into life histories and ecology (e.g., life stage-specific distributions and dietary analyses) of OTZ animals. The Multiple Opening/Closing Environmental Sensing System (MOCNESS) is composed of a series of nets that can take vertically discrete samples (generally integrative over tens or hundreds of meters) and is useful for assessing phenomena such as diel vertical migration. As eDNA-based biodiversity assessments are adopted, several studies have compared eDNA-based biodiversity estimates with those from net or trawls, including the MOCNESS (e.g., Govindarajan et al., 2021). These studies typically find that both methods recover many of the same animal taxa, while also recovering taxa unique to each method. It is important to note that these are “apples to oranges” comparisons that fundamentally measure different entities (organisms vs eDNA) and the volume of water parcels that they are sampling. Net tows are integrative over time and space (i.e., integrative sampling from a mobile, non-Lagrangian platform)—but at a much larger scale than integrative eDNA sampling. Net tows sample very large volumes, covering hundreds or thousands of meters over the course of an hour or more, and sampling orders of magnitude more water (Govindarajan et al., 2021). As such, eDNA and net tow comparisons should be viewed as complementary, not as “calibrations” of each other.
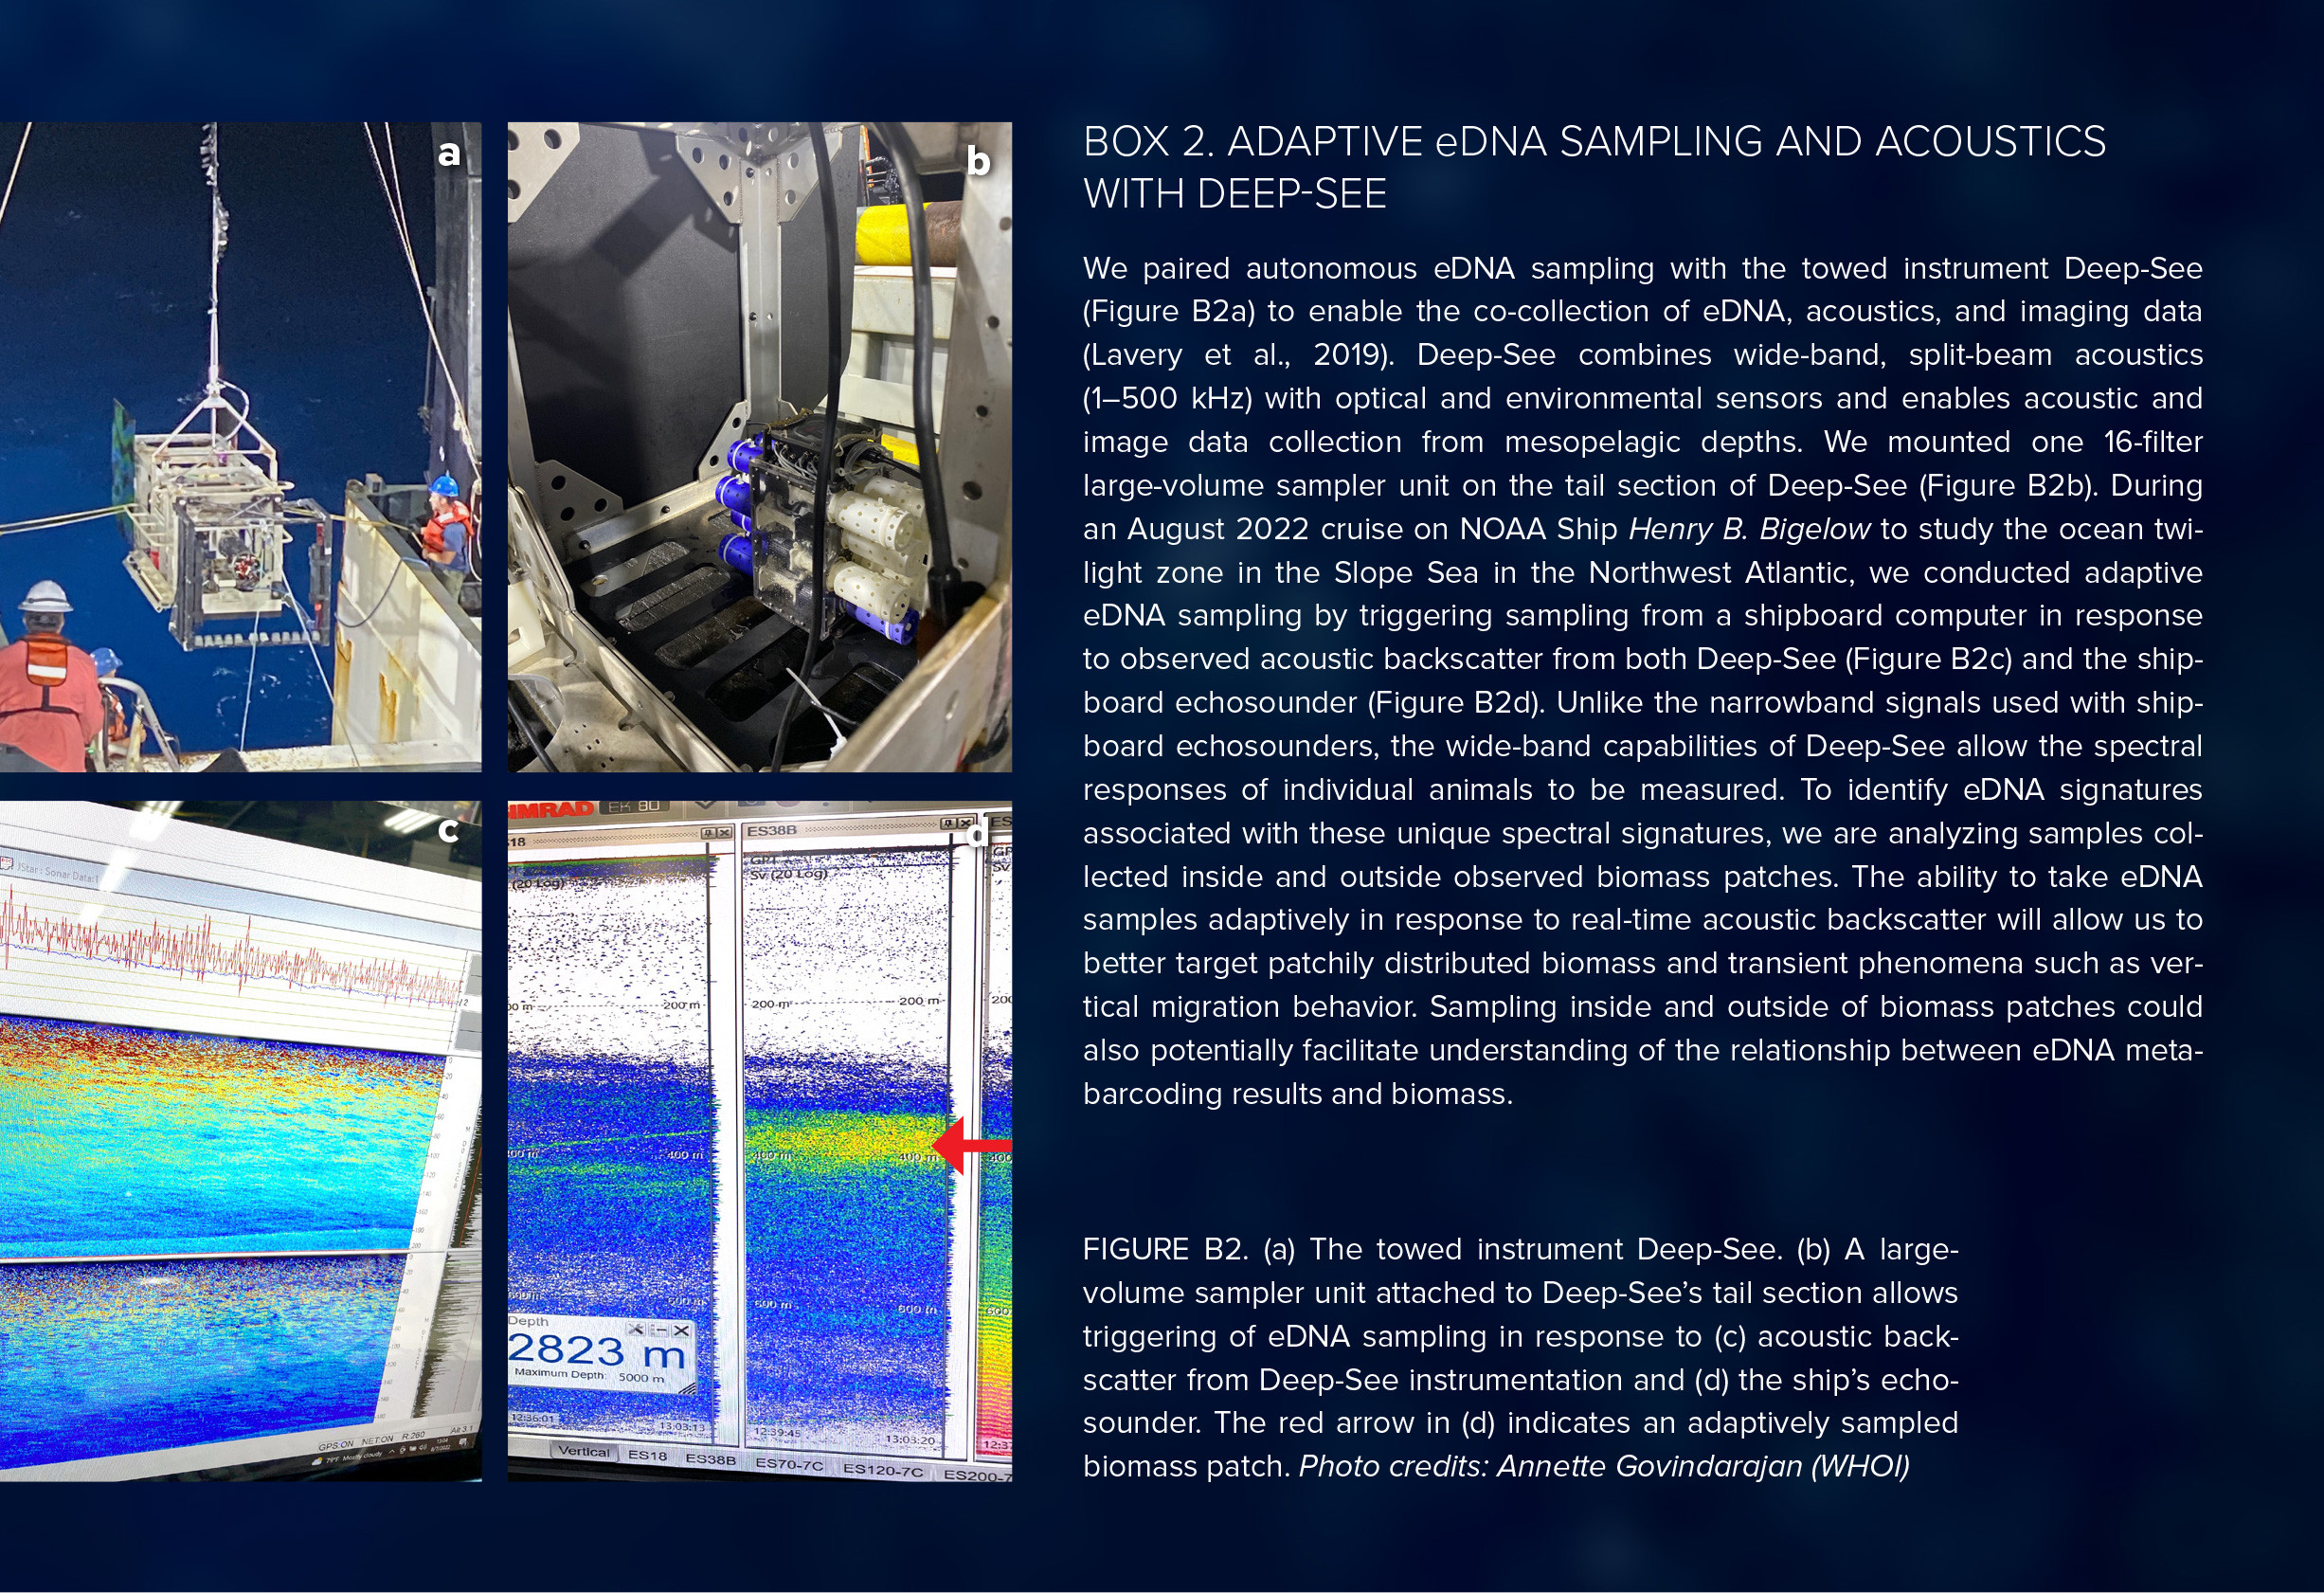
Data collected with echosounders, which measure acoustic backscattering from OTZ animals, can be used to estimate distribution and biomass and are also complementary to eDNA sampling. Both data types are especially valuable for the OTZ, where migrating biomass can be identified from the movements of sound-scattering layers. Typically, shipboard echosounders for OTZ studies operate at frequencies of 18 kHz and 38 kHz. Real-time observations of acoustic backscatter can be used to guide eDNA sampling (Zhang et al., 2020; Govindarajan et al., 2021; Box 2). Conversely, eDNA data can potentially provide taxonomic resolution for interpretation of acoustic signals, which at these frequencies are typically dominated by animals with gas-bearing structures such as fish with swim bladders and siphonophores (Lavery et al., 2007), and may identify the broader animal communities associated with these signals. Traditionally, depth-stratified net tows have been used for this purpose. However, net tows may integrate across acoustic layers, and animals such as active swimmers and delicate gelatinous species are undersampled. eDNA can potentially provide more spatially precise information about species occurrence relative to the observed acoustic backscatter.
Interpreting eDNA Signals
An essential issue for eDNA observing is the ability to interpret a signal appropriately. eDNA is collected from a dynamic fluid medium, and it is important to understand whether the resulting genetic signatures reflect the biodiversity from the sampling location or elsewhere. This is critical for stand-alone assessments and when the eDNA data are meant to inform co-collected data (e.g., acoustics). Laboratory studies on eDNA persistence are especially valuable for understanding the fate of eDNA and, consequently, the origin of eDNA signals. The rate at which eDNA decays (which affects how long the signal can be detected) is primarily controlled by temperature (Allan et al., 2020; McCartin et al., 2022). Thus, the cold temperatures of the OTZ and deeper waters likely result in greater eDNA persistence and signal transport than do the warmer waters of coastal systems. However, further investigation is needed into other factors that may influence eDNA persistence, such as the state of the eDNA (i.e., intracellular vs. disassociated), the rate of microbial degradation, interactive effects among the microbial community, and abiotic conditions (e.g., Jo and Minamoto, 2021).
A particular challenge for interpreting eDNA results from the OTZ is the vertical migration behavior of many mesopelagic species. The regular, daily transit of these animals between surface waters and depth may result in their genetic traces being left throughout the water column, making it difficult to ascertain their sources. Allan et al. (2021) conducted a modeling study using realistic parameters for a temperate system to address this issue. They found that eDNA signatures remain close to their depth of origin despite the potential for movement. This finding supports the use of eDNA to study vertical phenomena in the mesopelagic, including identifying which taxa migrate (Canals et al., 2021) and the timing of their migrations. Because vertical variation of eDNA signals induced by diel vertical migration persists over time (Allan et al., 2021), eDNA measured along a vertical profile could also be used to estimate the percentage of mesopelagic species that undergo diel vertical migration. A related challenge for interpreting eDNA results stems from the ocean’s heterogeneous flow field, which could differentially impact the transport of eDNA. Understanding the spatial distribution of the source animals in areas of strong flow variations would require robust knowledge of temporal and spatial variability in the region (e.g., Andruszkiewicz et al., 2019, in a coastal environment).
Future Directions and Next Steps
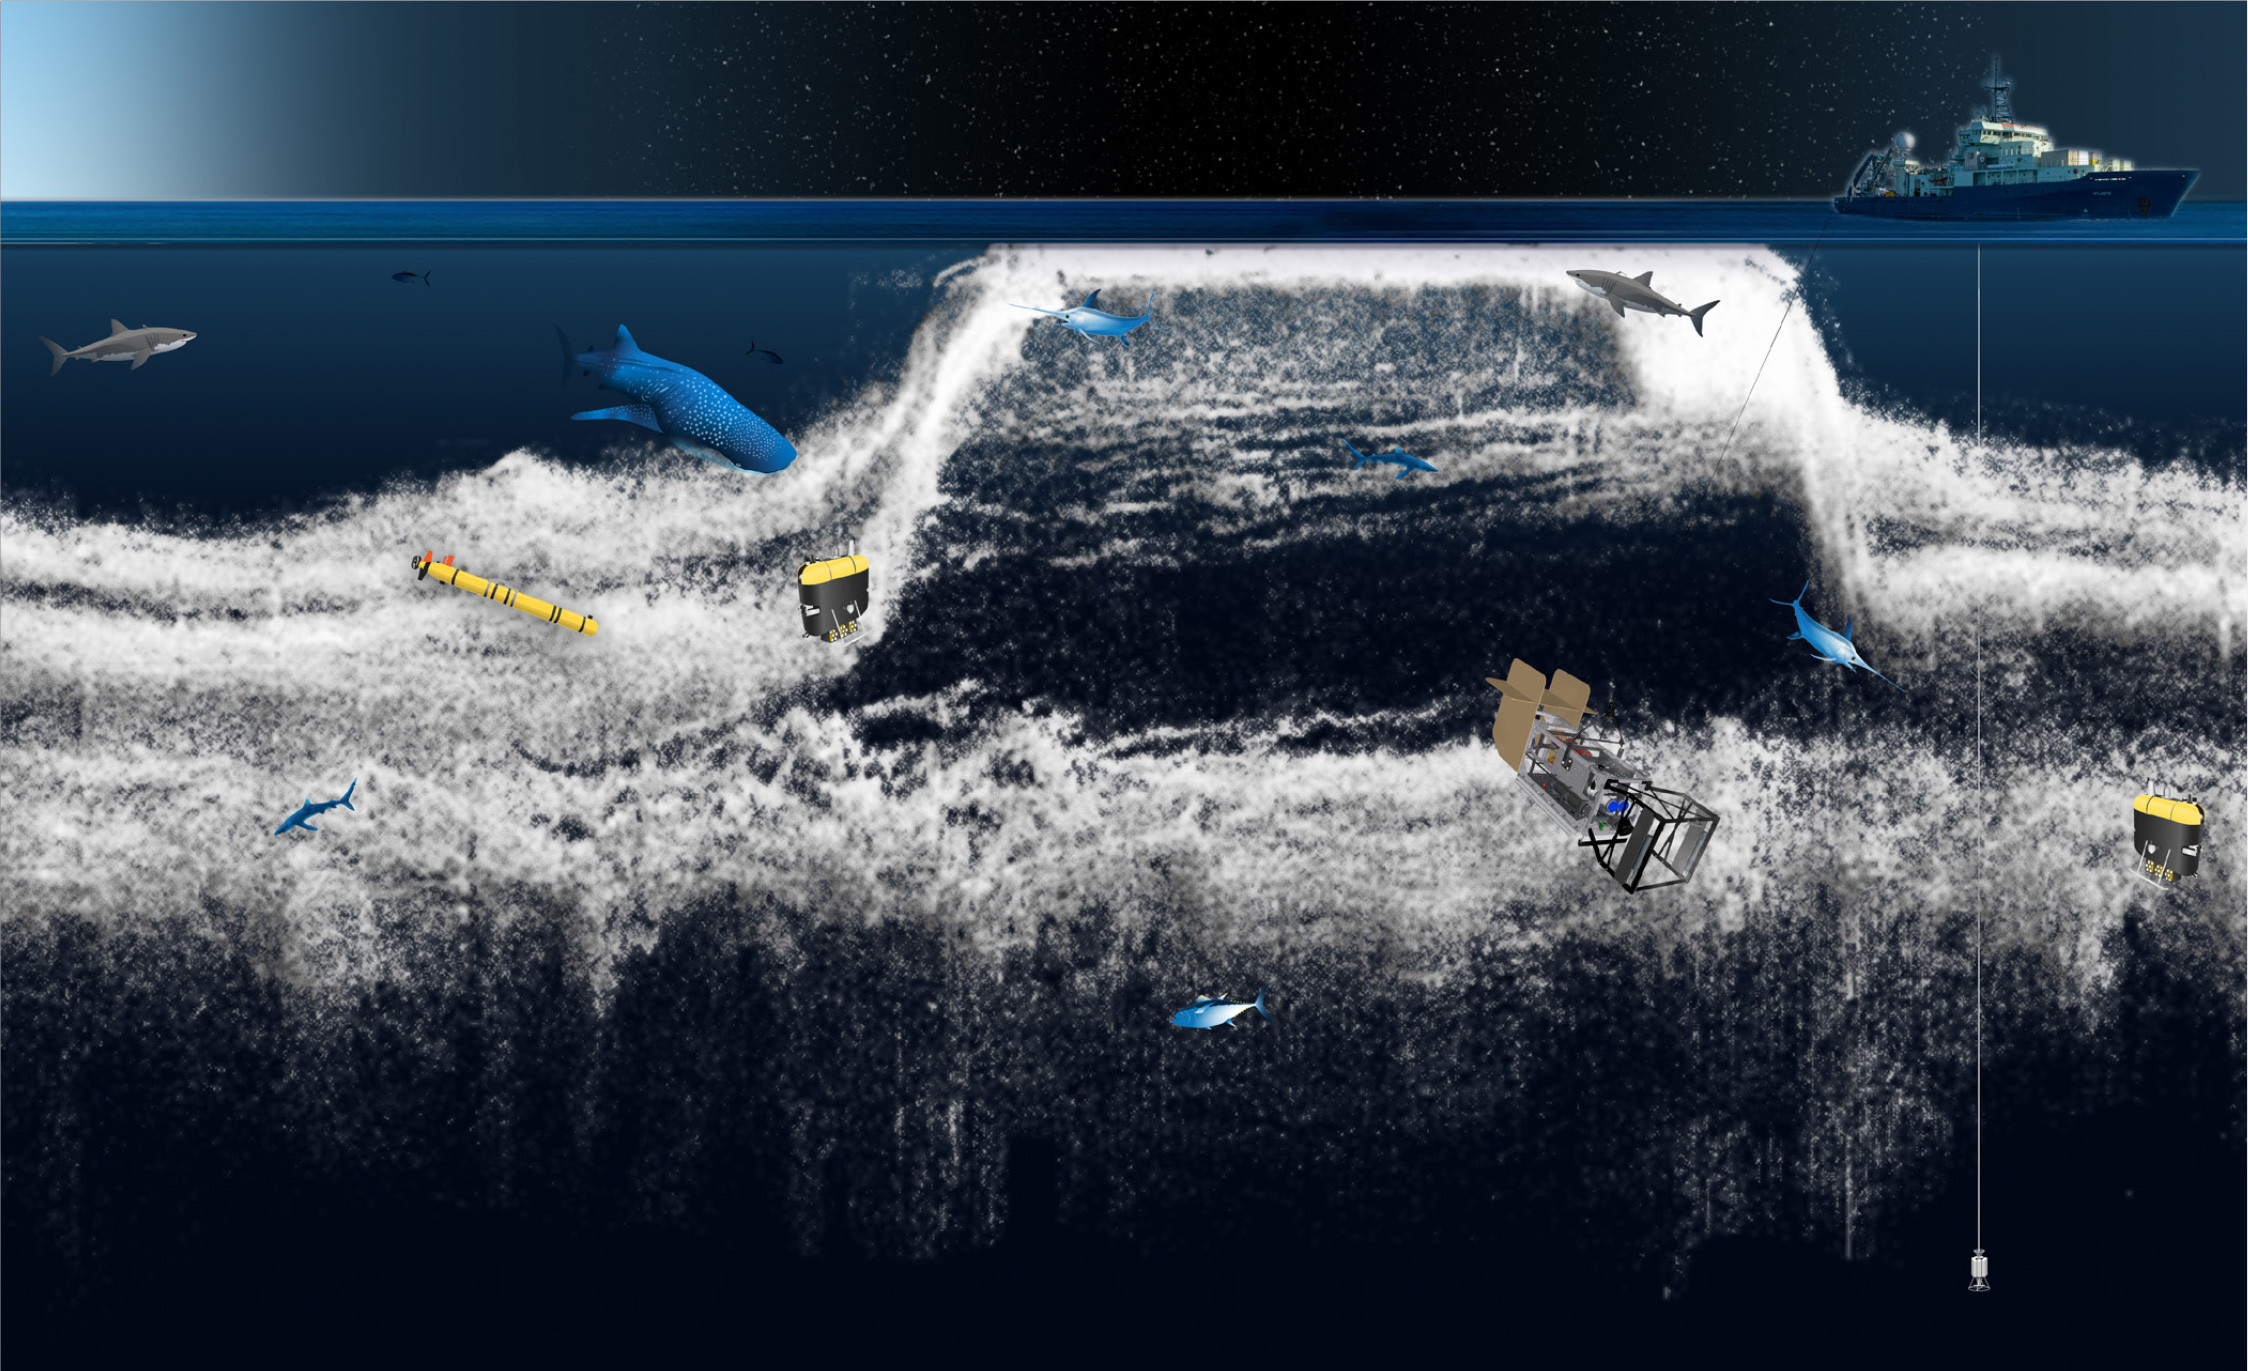
Environmental DNA analyses are ushering in a new era for biodiversity observations and ecological research in the OTZ. Developing and adopting new sampling technologies is crucial to documenting the impacts of climate change and other anthropogenic stressors. Sampling is fundamental for biodiversity assessments, and sampling technologies must expand from ship-based approaches to routine sampling that employs underwater vehicles and instrumentation ranging from AUVs to ROVs and towed instruments tailored to specific goals. We expect development of eDNA sampler types with different advantages and constraints, integrated into diverse platforms with a variety of sensors and geared toward specific analyses and research questions (Figure 5).
|
|
As sampling technologies develop, it is important to simultaneously pursue a better understanding of how eDNA is distributed in the ocean. This understanding is necessary both to guide the development of sampling technologies and to shape sample collection strategies. Computational modeling studies that consider the influence of oceanographic environments (e.g., temperature and flows) and incorporate eDNA shedding, persistence, transport, and dispersal are critical for linking measured eDNA signatures with their sources and for inferring species distributions and biomasses. They should be coupled with lab and field experiments for calibration, data analysis, and designing representative and effective field sampling strategies. For inferring biomass of multiple species (e.g., quantitative metabarcoding), incorporating an understanding of PCR dynamics into overall data interpretation will be especially important (Shelton et al., 2022). More research is needed to determine appropriate spatial and temporal sampling scales, which may depend on regional ocean currents; the biology of the target organisms; and specific research questions. In most, if not all, cases, we will need to vastly scale up our sampling efforts to enable spatiotemporally resolved data and obtain the replication required for statistical analyses. These steps are crucial for drawing scientific conclusions and translating eDNA observations into actionable conservation and policy insights.