Full Text
As the interest in marine or ocean-based carbon dioxide removal (mCDR) increases, so does the need for more spatially resolved measurement, reporting, and verification (MRV) of the CO2 sequestered (and for understanding the impacts of these environmental manipulation experiments). The mCDR/MRV community can borrow technology from the past decade’s exponential growth of interest in ocean acidification and monitoring. However, available sensors are insufficient to meet the growing demand for spatially resolved mCDR due to technological complexities, availability, and cost. For instance, in a recent review, there were few commercially available autonomous solutions for pH and pCO2 monitoring and none for total alkalinity or total dissolved inorganic carbon), and the majority of the pH and pCO2 sensors and analyzers cost well above $10,000. Proper MRV of mCDR requires high spatiotemporal resolution monitoring of the inorganic carbon system. Here we describe our efforts toward a low-cost CO2 flux or ∆pCO2 (the difference between air and water partial pressure of CO2) monitoring system intended for use in distributed sensor arrays in coastal, estuarine, and blue carbon research and in mCDR approaches.
Most aquatic pCO2 instrumentation is based on either non-dispersive infrared (NDIR) gas analysis or spectrophotometry. These systems typically incorporate expensive NDIR or spectrophotometric instrumentation (>$5,000) and frequently also utilize onboard calibration gas standards, resulting in large and costly solutions. Several recent studies (e.g., Wall, 2014; Hunt et al., 2017) have utilized lower-cost NDIRs that are typically sold for indoor air quality monitoring applications, but these analyzers tend to suffer from sensor drift, as they were not intended to meet climate-quality monitoring objectives. Other biogeochemical instrumentation overcomes limitations in accuracy and stability via the inclusion of onboard standards and/or calibration/validation to well-known values, such as deep dissolved oxygen or pH, or atmospheric oxygen.
To meet the need for a lower-cost and sufficiently stable pCO2 analyzer for deployments in dynamic coastal and estuarine environments and in distributed sensor arrays in mCDR manipulations, we have developed the SEACOW: Sensor for the Exchange of Atmospheric CO2 with Water. SEACOW replaces more expensive NDIR sensors common in state-of-the-art ∆pCO2 analyzers (e.g., Friederich et al., 1995) with the $99 Senseair K30 NDIR sensor. Cycling between atmospheric and aquatic pCO2 measurements enables the calculation of CO2 flux via the equation
F = kK0(pCO2,water – pCO2,air), (1)
where F is the CO2 flux from air to water, k is the gas transfer velocity, and K0 is CO2 solubility (see Wanninkhof et al., 2009, for further details). We note that the estimation of k is itself an active area of research, both in the open ocean and especially in more bathymetrically and hydrodynamically complex water bodies (Ho et al., 2018). Many aquatic pCO2 analyzers assume an atmospheric CO2 concentration for flux calculations (often based on Mauna Loa records or a nominal value of 400 µatm). The perfectly mixed atmosphere assumption may suffice in open ocean environments but is insufficient in dynamic wetland and urban environments where atmospheric CO2 is more variable (Northcott et al., 2019) and needs to be directly measured for accurate CO2 flux calculation. Furthermore, our focus on ∆pCO2 allows for drift in sensor offset that is subtracted out of both pCO2 terms in Equation 1.
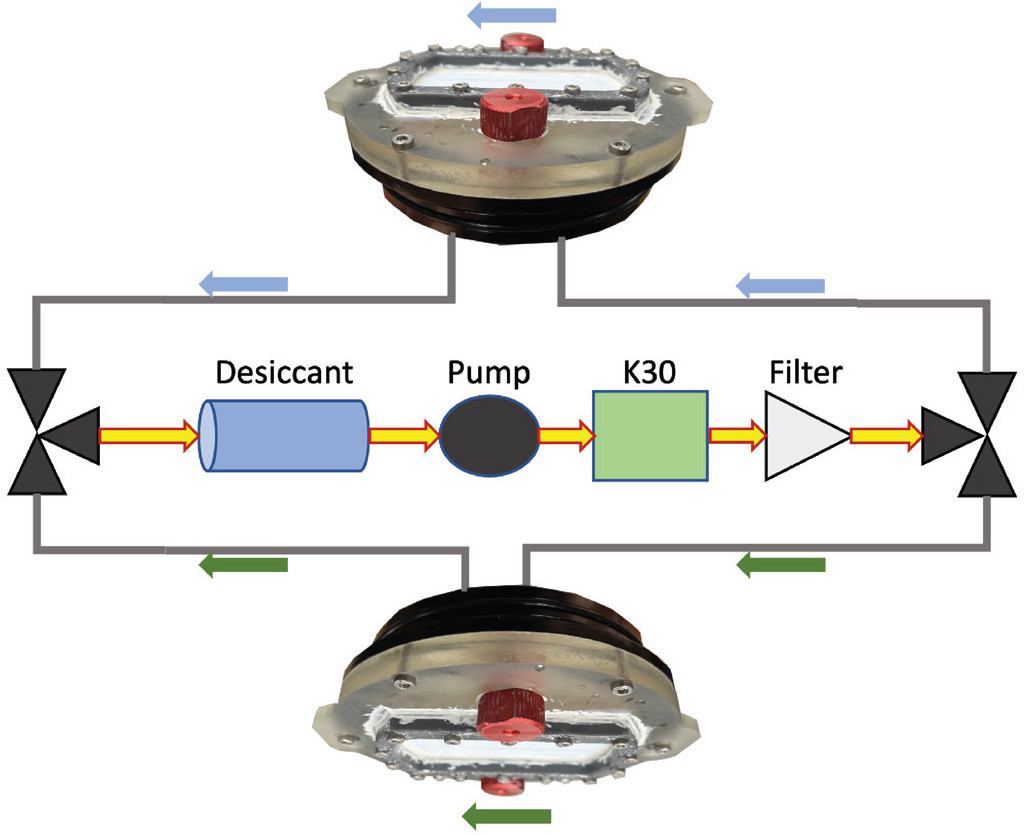
SEACOW comprises two semi-independent sampling loops with a single shared K30 CO2 sensor (Figure 1). When valves select the air-side loop, SEACOW’s internal sample air stream flows through a serpentine track in a custom 3D-printed endcap into which CO2 permeates across a PTFE membrane from the surrounding air. The sample air then circulates through a common air pump, a desiccant tube (intended to minimize interferences due to water vapor in the NDIR), and a custom 3Dl-printed, air-sample housing (containing a K30 CO2 sensor and a BME 280 pressure/humidity sensor), and then back through the air-side endcap. When the water side is selected, the valves switch so the air sample flows through a submerged endcap with an identical serpentine track, then through the common pump, desiccant, and sensor housing. SEACOW utilizes a Particle Boron microcontroller with an LTE cellular modem for integration into real-time sensor networks.
|
|
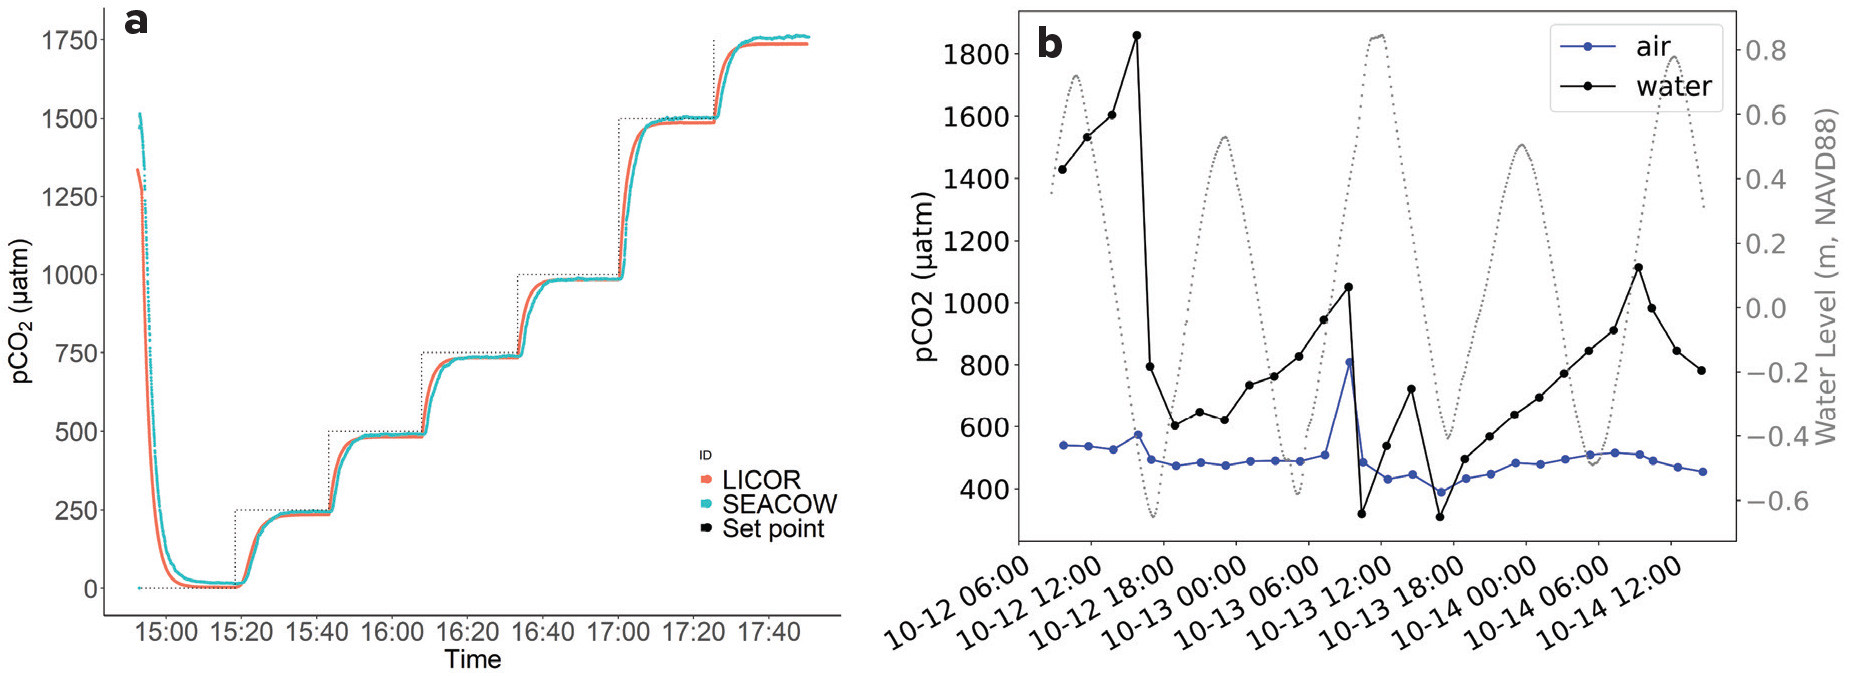
Preliminary testing has demonstrated SEACOW’s capabilities in laboratory and field settings (Figure 2). A laboratory evaluation of SEACOW’s range, accuracy, and response time compares favorably with a LI-COR 850 gas analyzer inside a custom-designed test chamber. Air-side response time (τ63) is 1.6 min while water-side response time is close to an hour. The longer water-side response time is a surmountable issue due to the fact that natural changes in pCO2 are slow (allowing the instrument to “keep up” with changes) and through fitting the following first-order rate equation to extrapolate to the final value, p2, following Wall (2014):
p(t) = (p2 – p1) × (1 – e–t/τ ) + p1, (2)
|
|
where p(t), p2, and p1 are partial pressures at arbitrary time t (i.e., instantaneous sensor recordings), at the end of the step change (i.e., the “true” final value), and the beginning of the step change (the initial value), respectively, and τ is the response time. We apply Equation 2 (solving for p2 to extrapolate to a final value for each measurement) to 54 hours of field data when SEACOW was fixed to the floating dock at the University of North Carolina Wilmington (UNCW) Center for Marine Science in North Carolina, USA. This initial field test demonstrates SEACOW’s ability to track tidal/diel fluctuations in ∆pCO2.
We also acknowledge that there are alternative solutions for monitoring aquatic CO2 flux beyond the ∆pCO2 method described here. These include, for example, eddy covariance and chamber techniques (see “Available methods to quantify water-air gas exchange” in Rosentreter, 2022) and can also include low-cost technologies (e.g., Bastviken et al., 2015). However, SEACOW presents a uniquely powerful solution that can be deployed at scale for high-resolution and high-quality monitoring of CO2 fluxes within sensor networks with minimal operator interaction. A combination of a distributed array of SEACOW instruments with a single, pricier, and perhaps more accurate pCO2 instrument could yield a valuable spatially resolved air–water CO2 flux data set at a price point not otherwise currently attainable.


