Introduction
Historically, coastal environments have been characterized primarily based on geomorphological characteristics and hydrodynamic forcing features (e.g., Inman and Nordstrom, 1971; Davies, 1980; Boyd et al., 1992; Cooper and McLaughlin, 1998; Harris et al., 2002; FGDC, 2012; Thom et al., 2018; and Davis and Fitzgerald, 2020). Coastal classifications are used in risk assessments (NEA and UNEP-WCMC, 2019), ecosystems services assessments (Barbier et al., 2011), and conservation planning and marine protected area design (Neilson and Costello, 1999; Burke et al., 2000). Coastal environment classification is also useful for improving understanding of ecosystem distributions and conditions (FGDC, 2012; Gagné et al., 2020).
Although classifications and maps are necessary for these applications, there is a lack of standardized, high resolution, and globally comprehensive data describing the global distribution of coastal ecosystems (Burke et al., 2000; Estes et al., 2018). To address the problem of a general lack of globally comprehensive geospatial data on terrestrial, freshwater, and coastal and marine ecosystem distributions, the Group on Earth Observations (GEO) commissioned the development of a high spatial resolution geospatial characterization of global ecosystems (Task T1 in the GEO Ecosystems 2020–2022 Implementation Plan: https://earthobservations.org/documents/gwp20_22/GEO-ECO.pdf). The work has resulted in several standardized global ecosystem data layers, including Ecological Land Units (ELUs; Sayre et al., 2014), World Terrestrial Ecosystems (WTEs; Sayre et al., 2020), true three-dimensional oceanic pelagic Ecological Marine Units (EMUs; Sayre et al., 2017), and now global coastal segment units (CSUs; Sayre et al., 2021). Specifically, the CSUs describe land- and water-side ecological settings using the Coastal and Marine Ecological Classification Standard (CMECS; FGDC, 2012).
Here, we use the CSU layers to characterize the coastal biophysical environments of the six US Marine Biodiversity Observation Network (MBON) sites and one MBON Pole to Pole of the Americas site in Argentina. We characterize coastal ecological settings using variables and class ranges from CMECS, a robust framework for marine ecosystem classification adopted as the US federal standard by the Federal Geographic Data Committee (FGDC, 2012). We summarize the basic global segmentation analysis and methodology for deriving the CSUs and discuss their intended applications.
Methodology
Our approach to classifying Earth’s coastlines, using CMECS variables and classes wherever possible, included five steps (Sayre et al., 2021):
- Partition an existing 30 m resolution Landsat-derived global shoreline vector (GSV) into 1 km lengths.
- Select variables to express the aggregate ecological setting of each segment, including properties of the adjacent water, the land, and the coastline itself.
- Attribute the segments with the values of the selected variables.
- Categorize attribute values into standardized classes using CMECS (FGDC, 2012).
- Determine the number and composition of resulting CSUs for each site.
A 30 m Global Shoreline Vector (GSV) was extracted from 2014 Landsat annual composite imagery (Sayre et al., 2019) and segmented into 4,005,842 1 km or shorter segments. Ten variables were selected to represent the aggregate ecological setting for the coastlines (Box 1).
The five water-side variables serve to characterize average, relatively long-term conditions of coastal waters. The “marine physical environment” variable is a composite measure of the temperature, salinity, and dissolved oxygen regimes, each with its own CMECS categories. The underlying data for this metric were derived from the global ecological marine units (EMUs; Sayre et al., 2017) data based on long-term averages of NOAA’s World Ocean Atlas data (https://www.ncei.noaa.gov/products/world-ocean-atlas).
The land-side variables represent determinants of biotic distributions (Bailey, 2009; Gagné et al., 2020). We used the World Climate Regions data (Sayre et al., 2020) derived from the WorldClim v. 2.0 climate data (Fick and Hijmans, 2017) for long-term average annual air temperature and precipitation. We also used the Global Lithology Map (GLiM; Hartmann and Moosdorf, 2012) and an erodibility index (Moosdorf et al., 2018) to describe relative susceptibility to erosion of the underlying lithological formations at the coastline.
For the coastline itself, we identified three properties as important influences on coastal ecology: sinuosity, slope, and river outflow. Sinuosity impacts land- (e.g., sediment deposition) and water-side (e.g., wave energy and exposure) processes (Bartley et al. 2001; Nyberg and Howell, 2016). The slope profile perpendicular to the coastline influences wave energy and exposure (John et al., 2017). River outflow influences patterns of sediment deposition, turbidity, and salinity (Osadchiev and Zavialov, 2019).
In most cases (seven of the 10 variables), the attribution was obtained from a global raster layer built for each variable. The value of the raster cell whose centerpoint was closest to the midpoint of the 1 km segment was then attributed to the segment midpoint. For the land slope profile, a 200 m perpendicular to each segment midpoint was created, and the elevation values at both ends of the perpendicular were used to calculate the slope. For sinuosity, a 10 km segment of coastline was used (10 segments) and the roughness index (RI) was calculated as the ratio of the length of the actual curvilinear coastline to the length of a straight line connecting the two ends of the segment. The RI value was then attributed to the segment midpoints of the 10 segments.
The river outflow index required identifying where rivers (~160,000) intersected the GSV and calculating the magnitude of the riverine discharge into the ocean. The index represents volumes of water discharging at river mouths and the spread of that water into the ocean, statistically modeled using a kernel density function. We modeled average annual capture of precipitation in catchment basins at a 1 km resolution and assumed that this approximated discharge. Assumptions included that: (1) precipitation is uniform across the basin, and (2) discharge equals precipitation. The water volume values were normalized to a unitless river outflow index between zero and one using the min-max scaling method, and subsequently grouped into low influence, medium influence, and high influence. The river outflow index is intended to represent a simple, relative measure of riverine influences along the coastline (Sayre et al., 2021).
Temporally, many values represent long-term (extent of archive) averages of annual means wherever possible: integrated marine environment variable – 57 years (1956-2013), chlorophyll variable – 24 years (1997–2020), tidal range variable – 20 years (1994–2014), wave height variable – 30 years (1979–2009), turbidity variable – 17 years (2002–2019), climate setting variable – 30 years (1970–2000), and river influence variable – 30 years (1970–2000). The remaining variables (erodibility, sinuosity, and slope profile) represent more enduring coastline characteristics and were not derived from time series data.
Results
The approximately 4 million coastal segments were classified into 81,000 unique CSUs. Figure 1 shows the set of attribute names, values, and classes returned from a query of a 1 km stretch of coastline from one of the Channel Islands in the Santa Barbara Channel MBON site. Figures 2–7 show the distributions and descriptive statistics of CSUs at the six US MBON sites (Figure 2, Arctic; Figure 3, Pacific Northwest; Figure 4, Central California; Figure 5, Santa Barbara Channel; Figure 6, Florida Keys; and Figure 7, Gulf of Maine), spanning a range of latitudes, longitudes, and physical environments. Figure 8 shows the CSU distributions and characteristics at one of the MBON Pole to Pole of the Americas sites, Golfo Nuevo, in Argentina. Finally, depicting the global distribution of the 81,000 CSUs is impractical due to the sheer number of the units and the inability to visually resolve them with standard color separation approaches. Figure 9 therefore shows a map of 16 groups of globally similar coastlines based on CSU composition and derived from statistical clustering (Sayre et al., 2021).
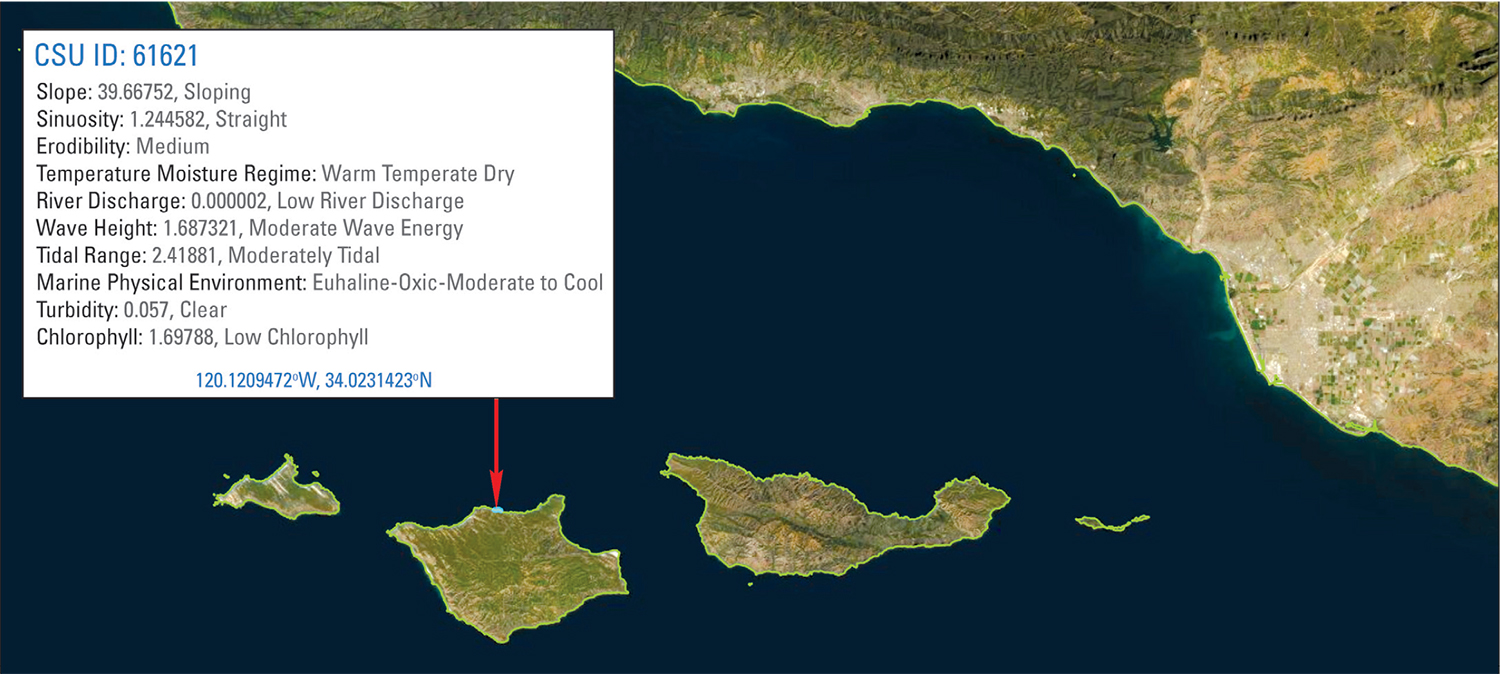
Figure 1. Results from a query of a single 1 km stretch of coastline in the Santa Barbara Channel US Marine Biodiversity Observation Network (MBON) site. The names of the 10 coastal ecological variables, as well as their values and classes at that location, are returned as a pop-up result from the query. The queried coastal segment unit (CSU) is classified as: sloping, straight, medium erodibility, warm temperate dry, low river discharge, moderate wave energy, moderately tidal, euhaline-oxic-moderate to cool, clear, and low chlorophyll. > High res figure
|
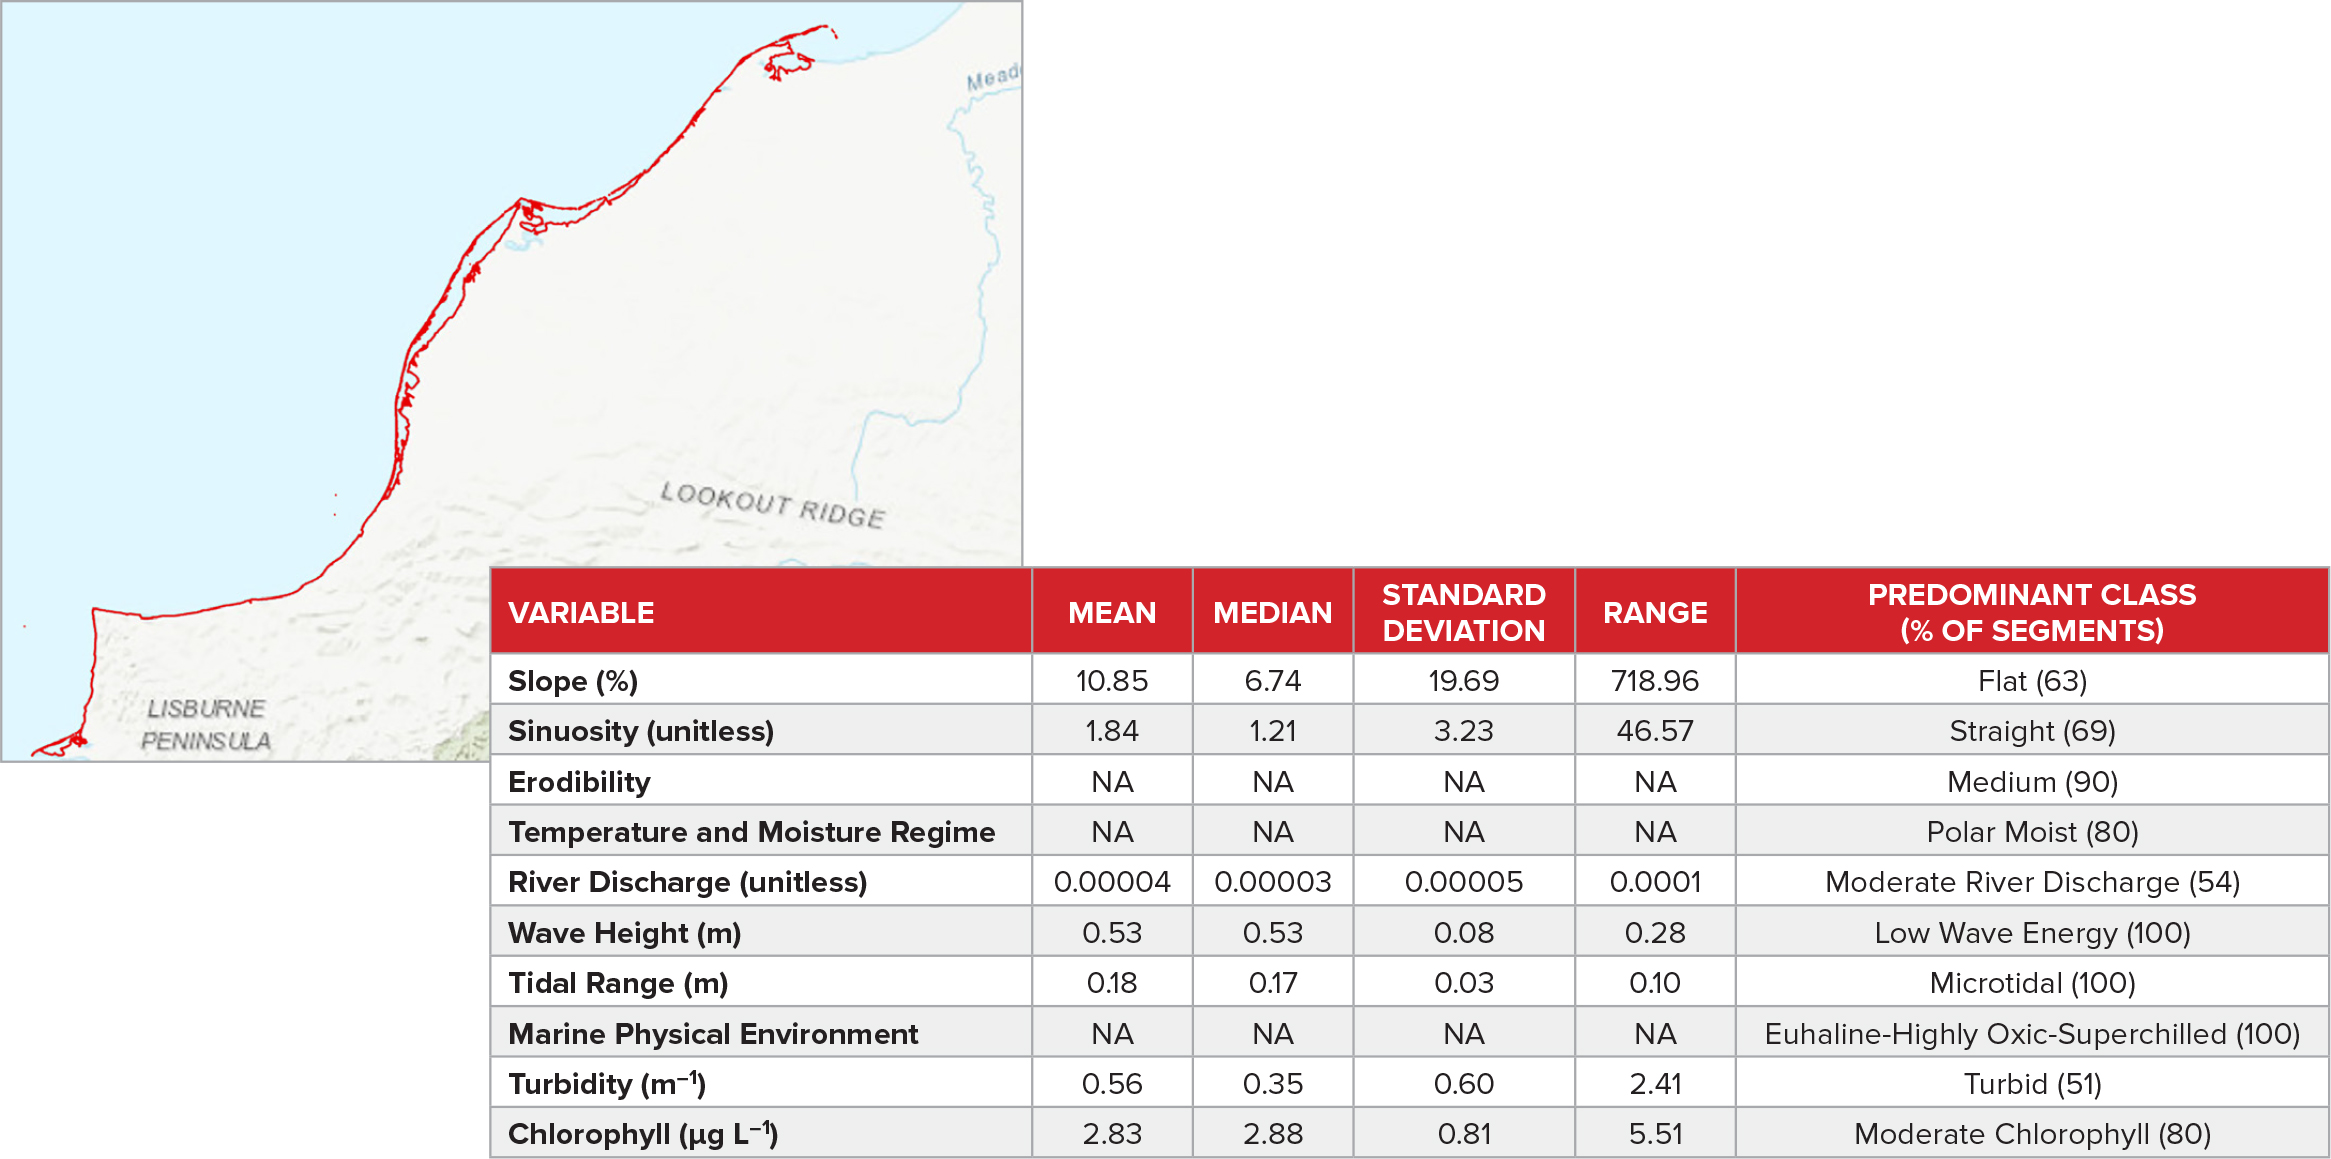
Figure 2. Coastline characteristics of the Arctic (Alaska) US MBON site. (top) Coastline segments (red) selected for site characterization (N = 4,858 segments). A barrier island is visible in the graphic. In addition to the Alaskan mainland, CSUs are identified for both the land-facing and sea-facing coastlines of the barrier island. (bottom) Descriptive statistics for the CSUs, including summary Coastal and Marine Ecological Classification Standard (CMECS) text descriptors of the 10 variables (last column). This site is characterized as: flat, straight, medium erodibility, polar moist, moderate river discharge, low wave energy, microtidal, euhaline-highly oxic-superchilled, turbid, moderate chlorophyll. NA = not applicable (categorical variable). > High res figure
|

Figure 3. Coastline characteristics of the Olympic Coast National Marine Sanctuary (Pacific Northwest US MBON site). (top) Coastline segments (red) selected for site characterization (N = 447 segments). (bottom) Descriptive statistics for the CSUs, including summary text descriptors of the ten variables (last column). This site is characterized as: flat, straight, medium erodibility, warm temperate moist, moderate river discharge, low wave energy, moderately tidal, euhaline-highly oxic-superchilled, moderately turbid, moderate chlorophyll. NA = not applicable (categorical variable). > High res figure
|
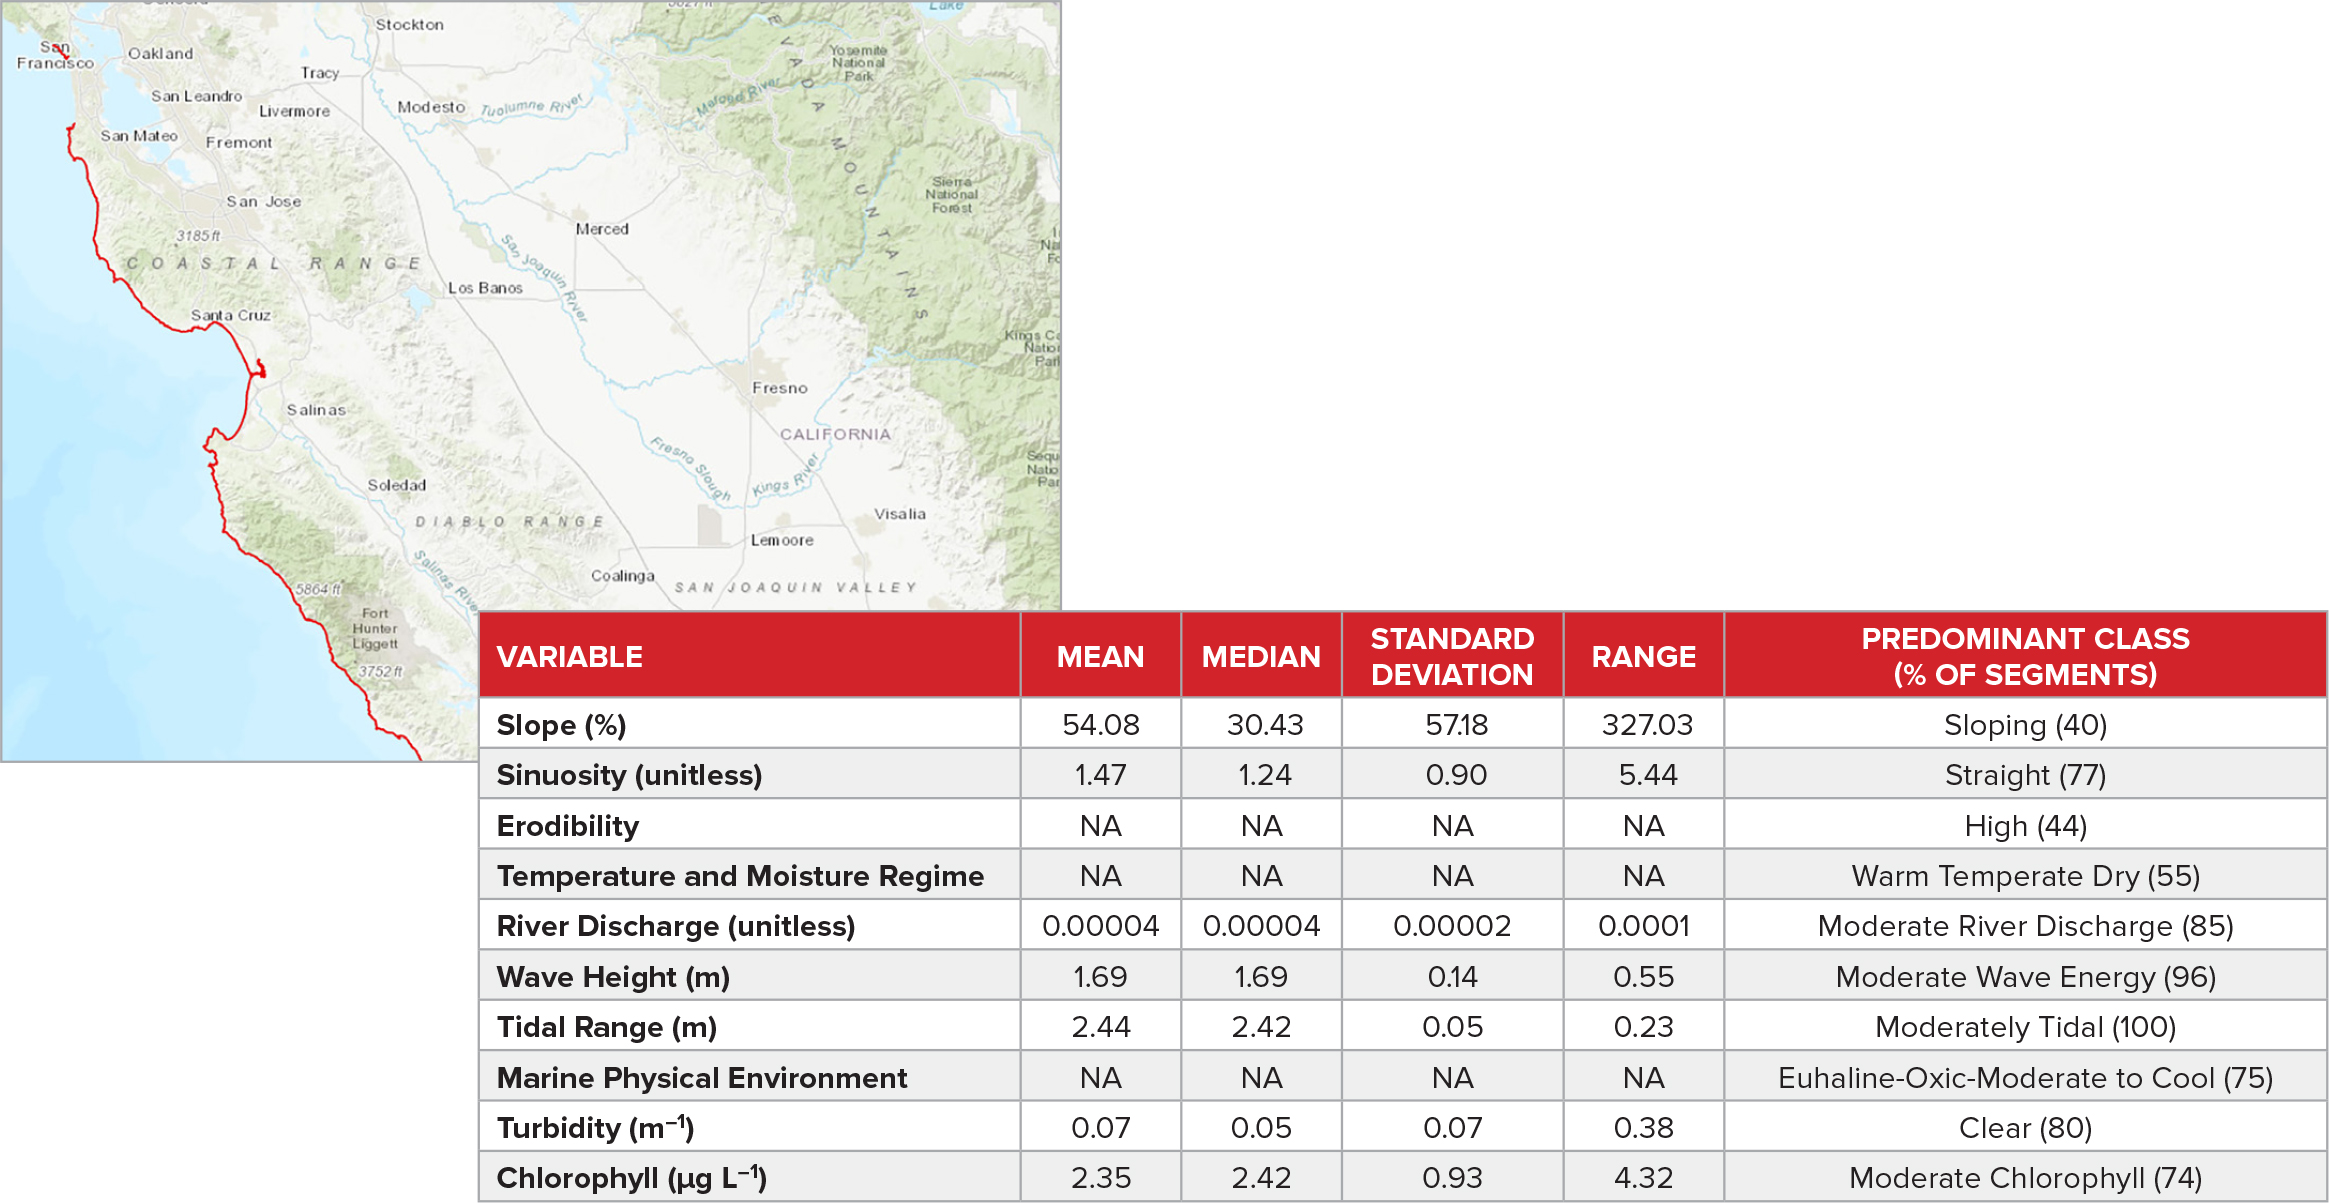
Figure 4. Coastline characteristics of the Monterey Bay National Marine Sanctuary (Central California US MBON site). (top) Coastline segments (red) selected for site characterization (N = 594 segments). (bottom) Descriptive statistics for the CSUs, including summary text descriptors of the 10 variables (last column). This site is characterized as: sloping, straight, high erodibility, warm temperate dry, moderate river discharge, moderate wave energy, moderately tidal, euhaline-oxic-moderate to cool, clear, moderate chlorophyll. NA = not applicable (categorical variable). > High res figure
|
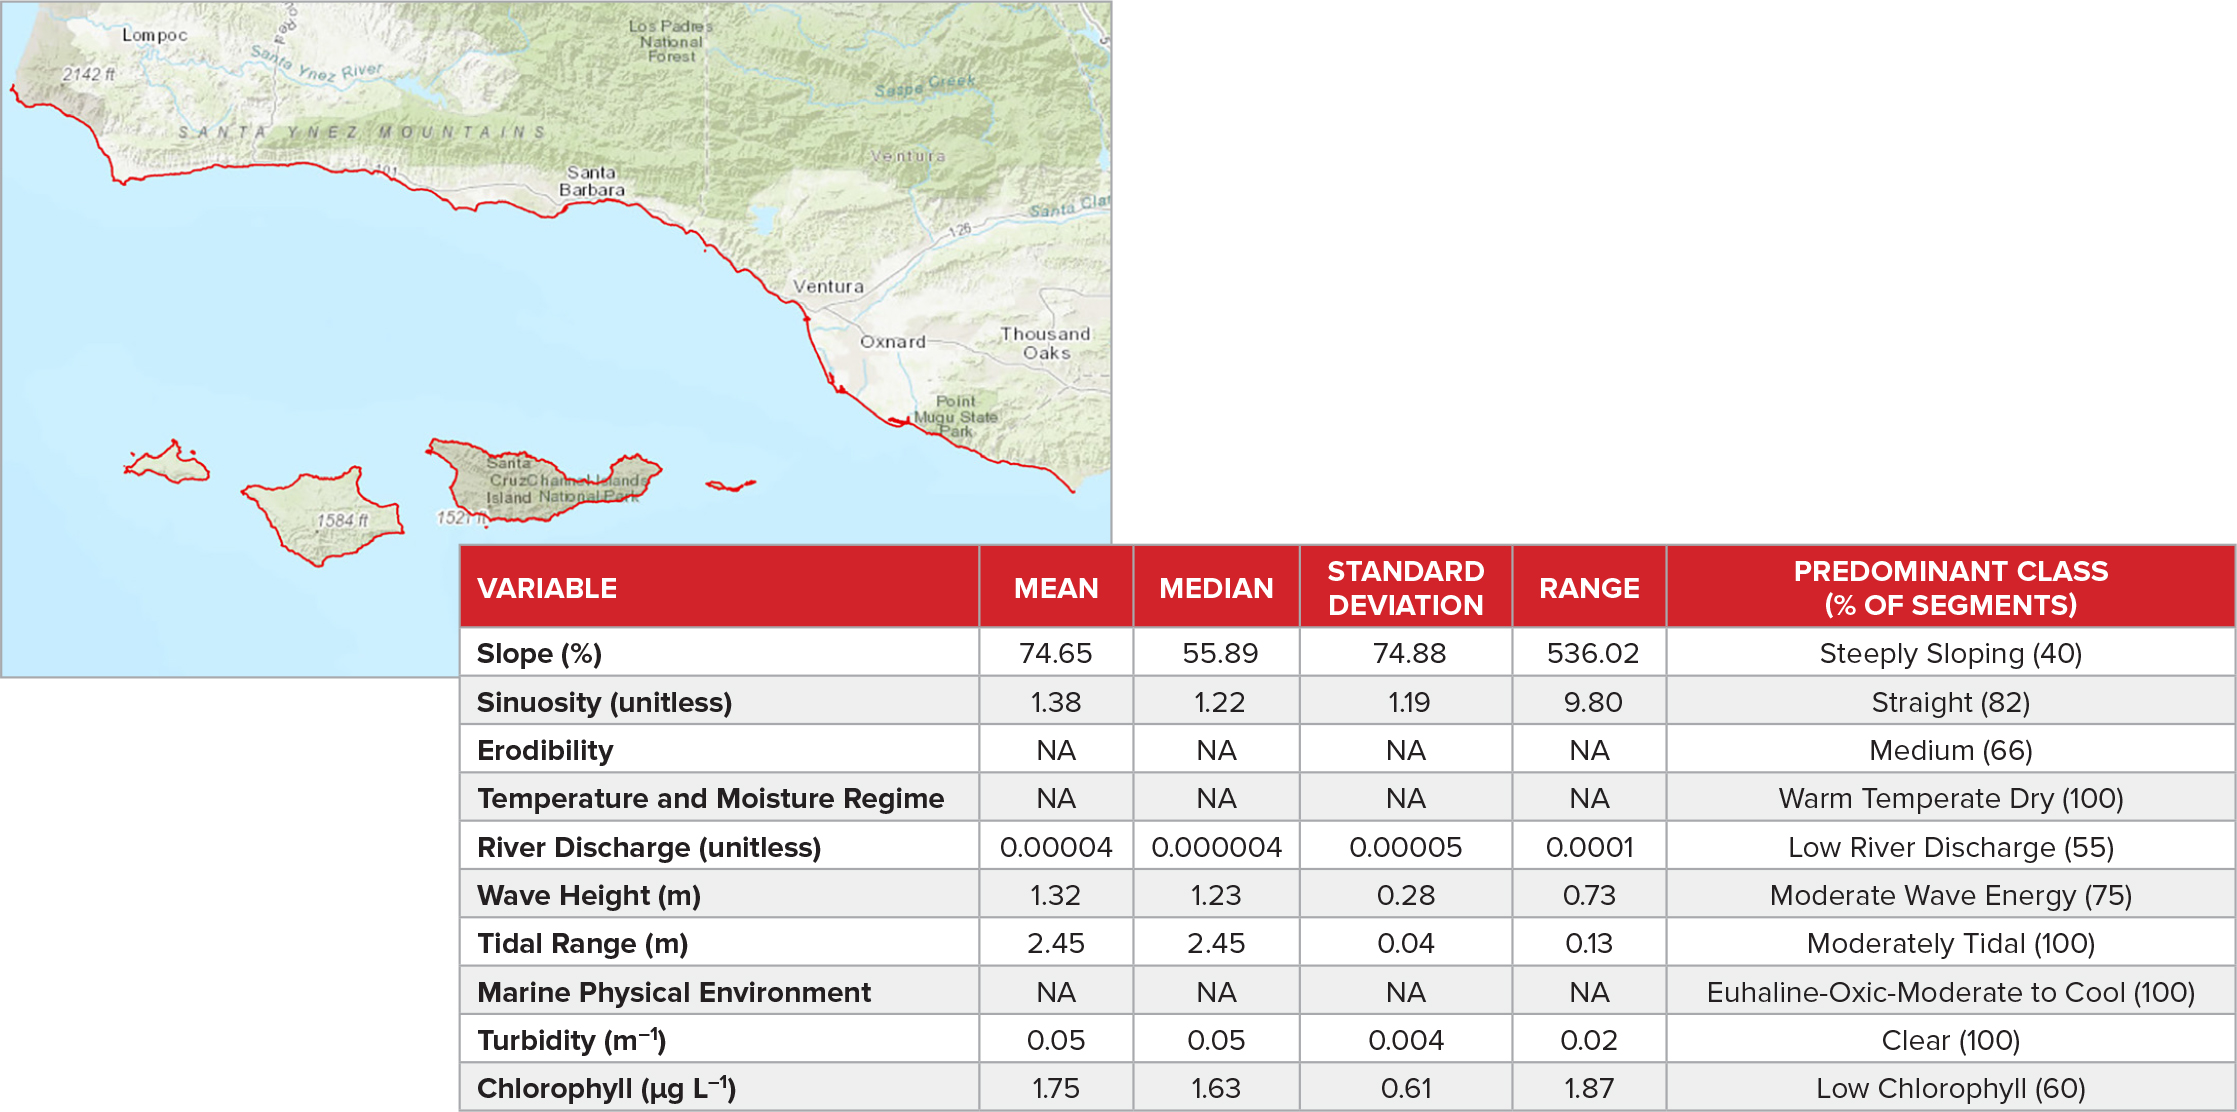
Figure 5. Coastline characteristics of the Santa Barbara Channel (California) US MBON site. (top) Coastline segments (red) selected for site characterization (N = 618 segments). (bottom) Descriptive statistics for the CSUs, including summary text descriptors of the 10 variables (last column). This site is characterized as: steeply sloping, straight, medium erodibility, warm temperate dry, low river discharge, moderate wave energy, moderately tidal, euhaline-oxic-moderate to cool, clear, low chlorophyll. NA = not applicable (categorical variable). > High res figure
|

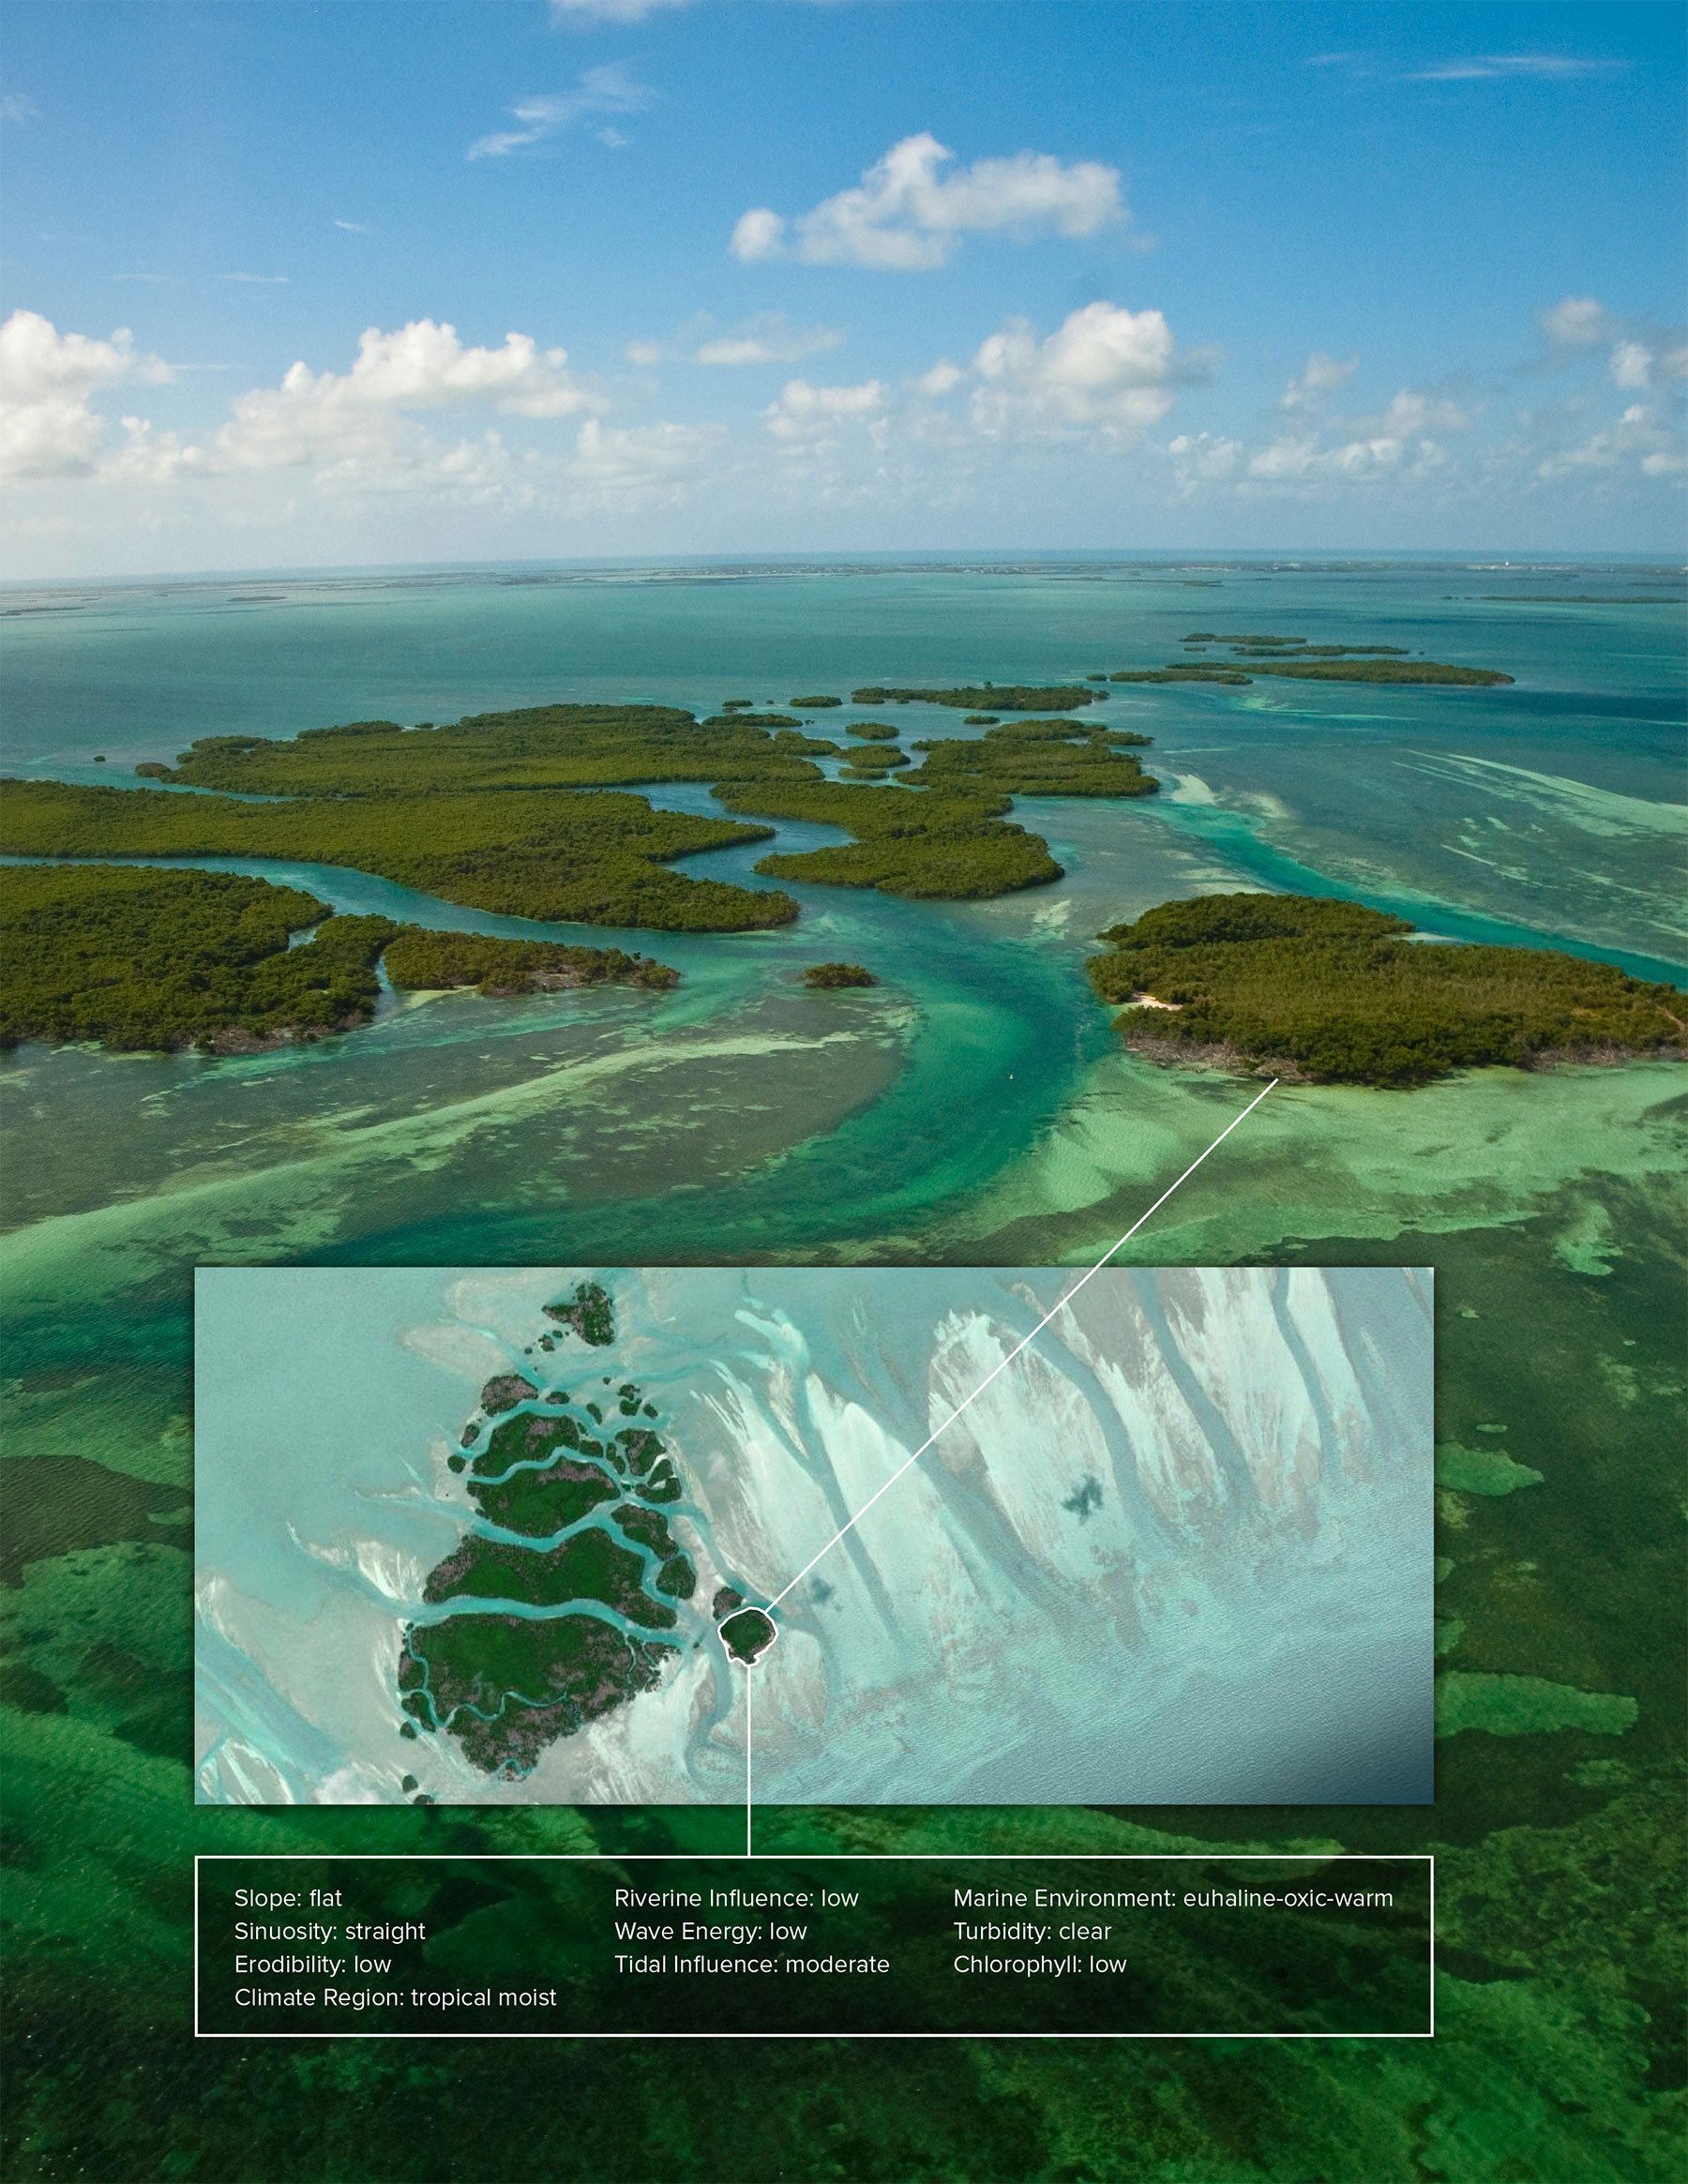
Figure 6. Coastline characteristics of the Florida Keys National Marine Sanctuary (Florida Keys US MBON site). (top) Coastline segments (red) selected for site characterization (N = 1,690 segments). (bottom) Descriptive statistics for the CSUs, including summary text descriptors of the 10 variables (last column). This site is characterized as: flat, straight, low erodibility, tropical moist, moderate river discharge, low wave energy, moderately tidal, euhaline-oxic-warm, clear, moderate chlorophyll. NA = not applicable (categorical variable). > High res figure
|
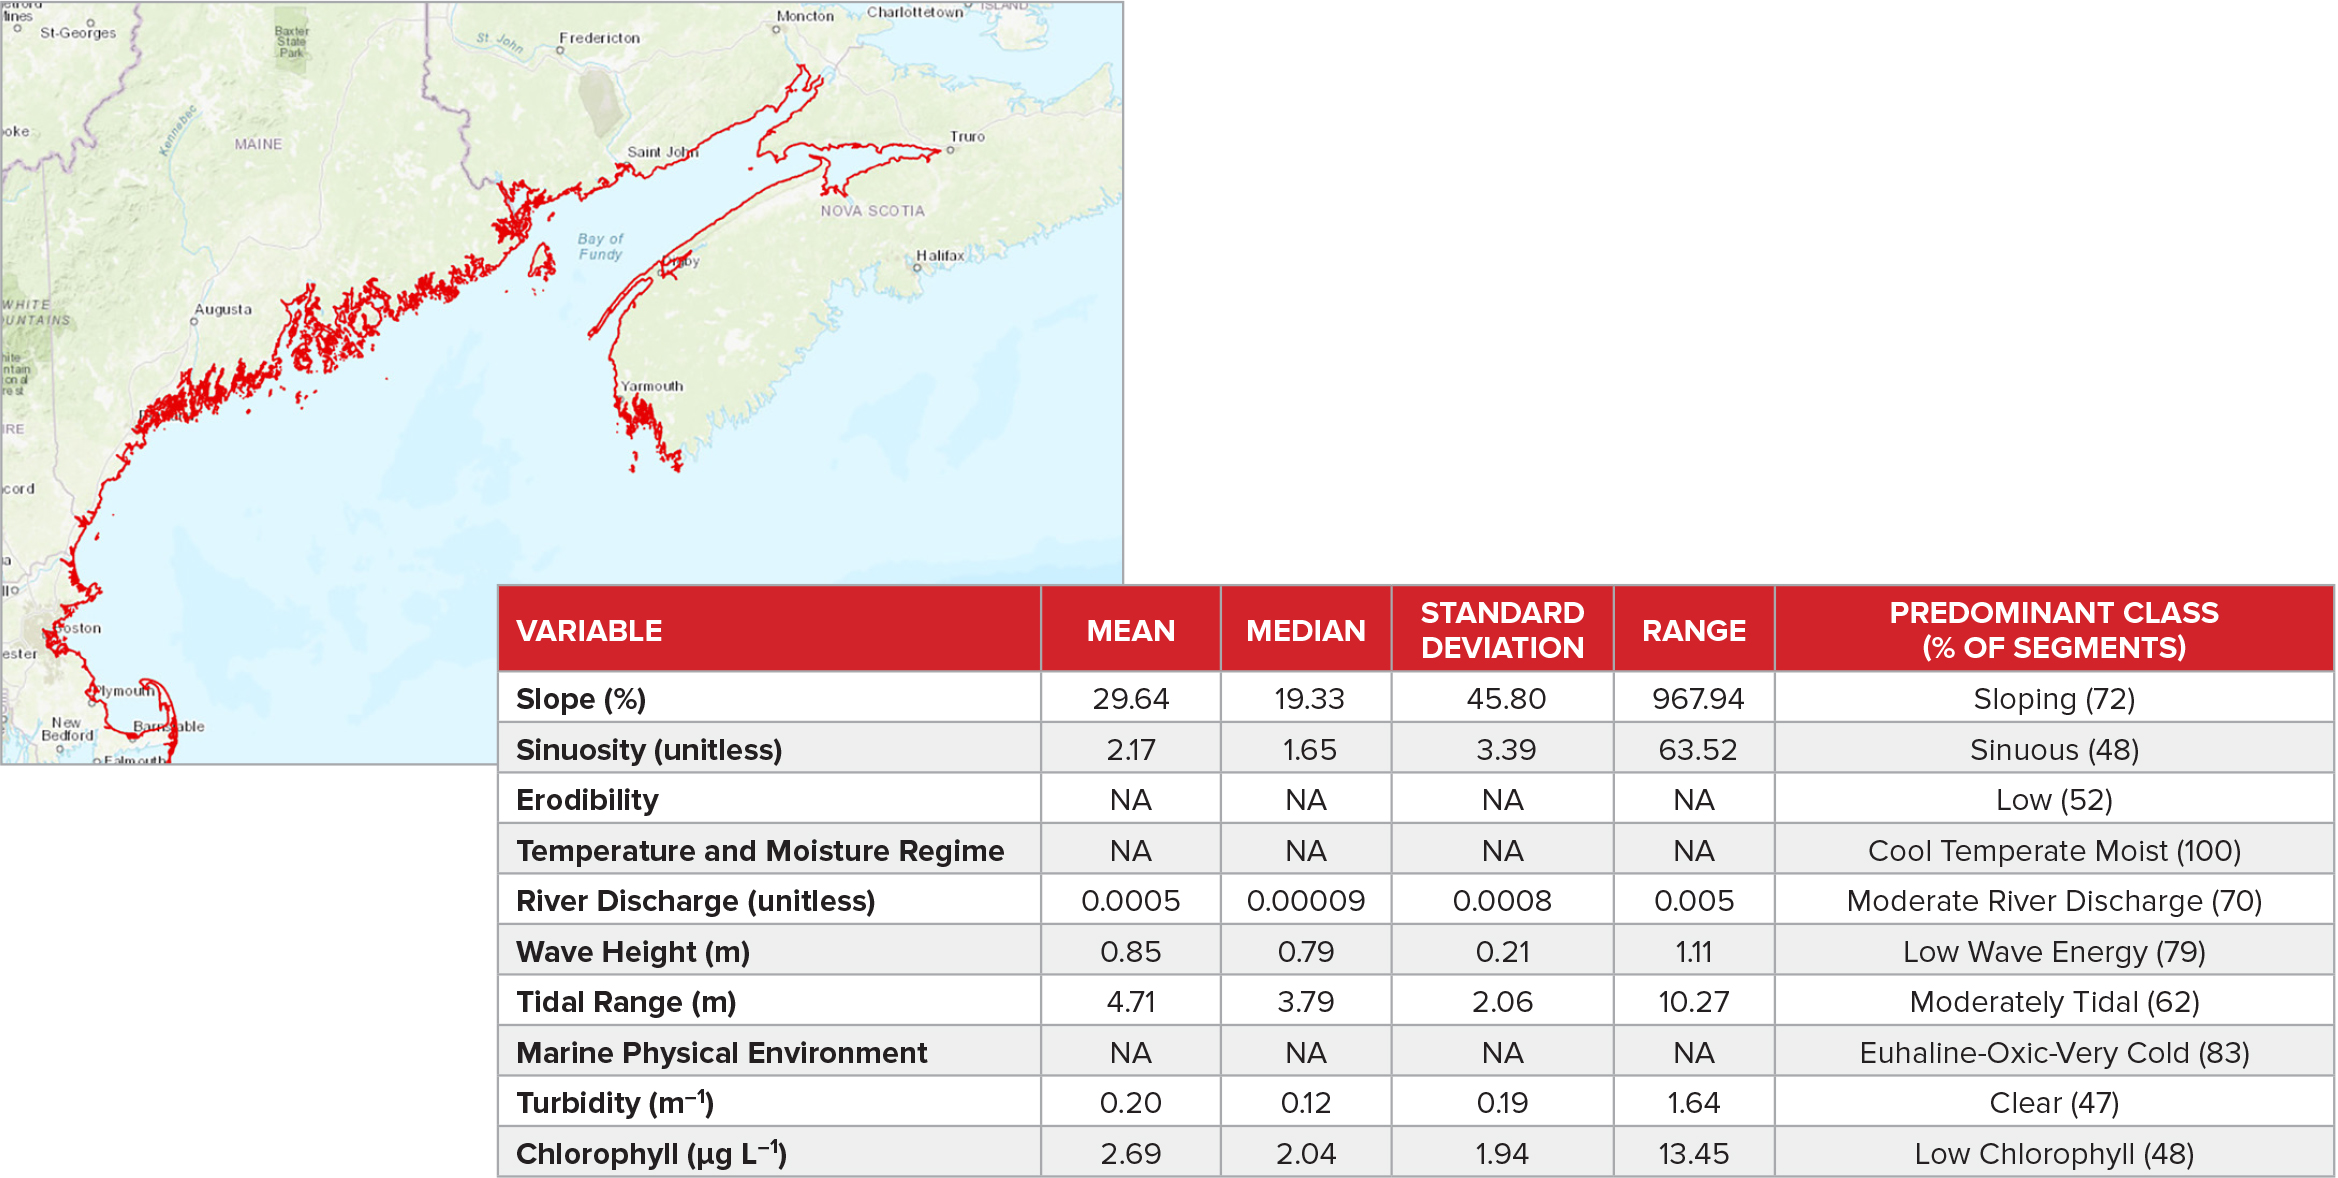
Figure 7. Coastline characteristics of the Gulf of Maine US MBON site. (top) Coastline segments (red) selected for site characterization (N = 15,434 segments). (bottom) Descriptive statistics for the CSUs, including summary text descriptors of the 10 variables (last column). This site is characterized as: sloping, sinuous, low erodibility, cool temperate moist, moderate river discharge, low wave energy, moderately tidal, euhaline-oxic-very cold, clear, low chlorophyll. NA = not applicable (categorical variable). > High res figure
|

Figure 8. Coastline characteristics of the Golfo Nuevo (Argentina) MBON Pole to Pole of the Americas site. (top) Coastline segments (red) selected for site characterization (N = 297 segments). (bottom) Descriptive statistics for the CSUs, including summary text descriptors of the 10 variables (last column). This site is characterized as: sloping, straight, medium erodibility, warm temperate dry, low river discharge, low wave energy, macrotidal, euhaline-oxic-moderate to cool, turbid, low chlorophyll. NA = not applicable (categorical variable). > High res figure
|
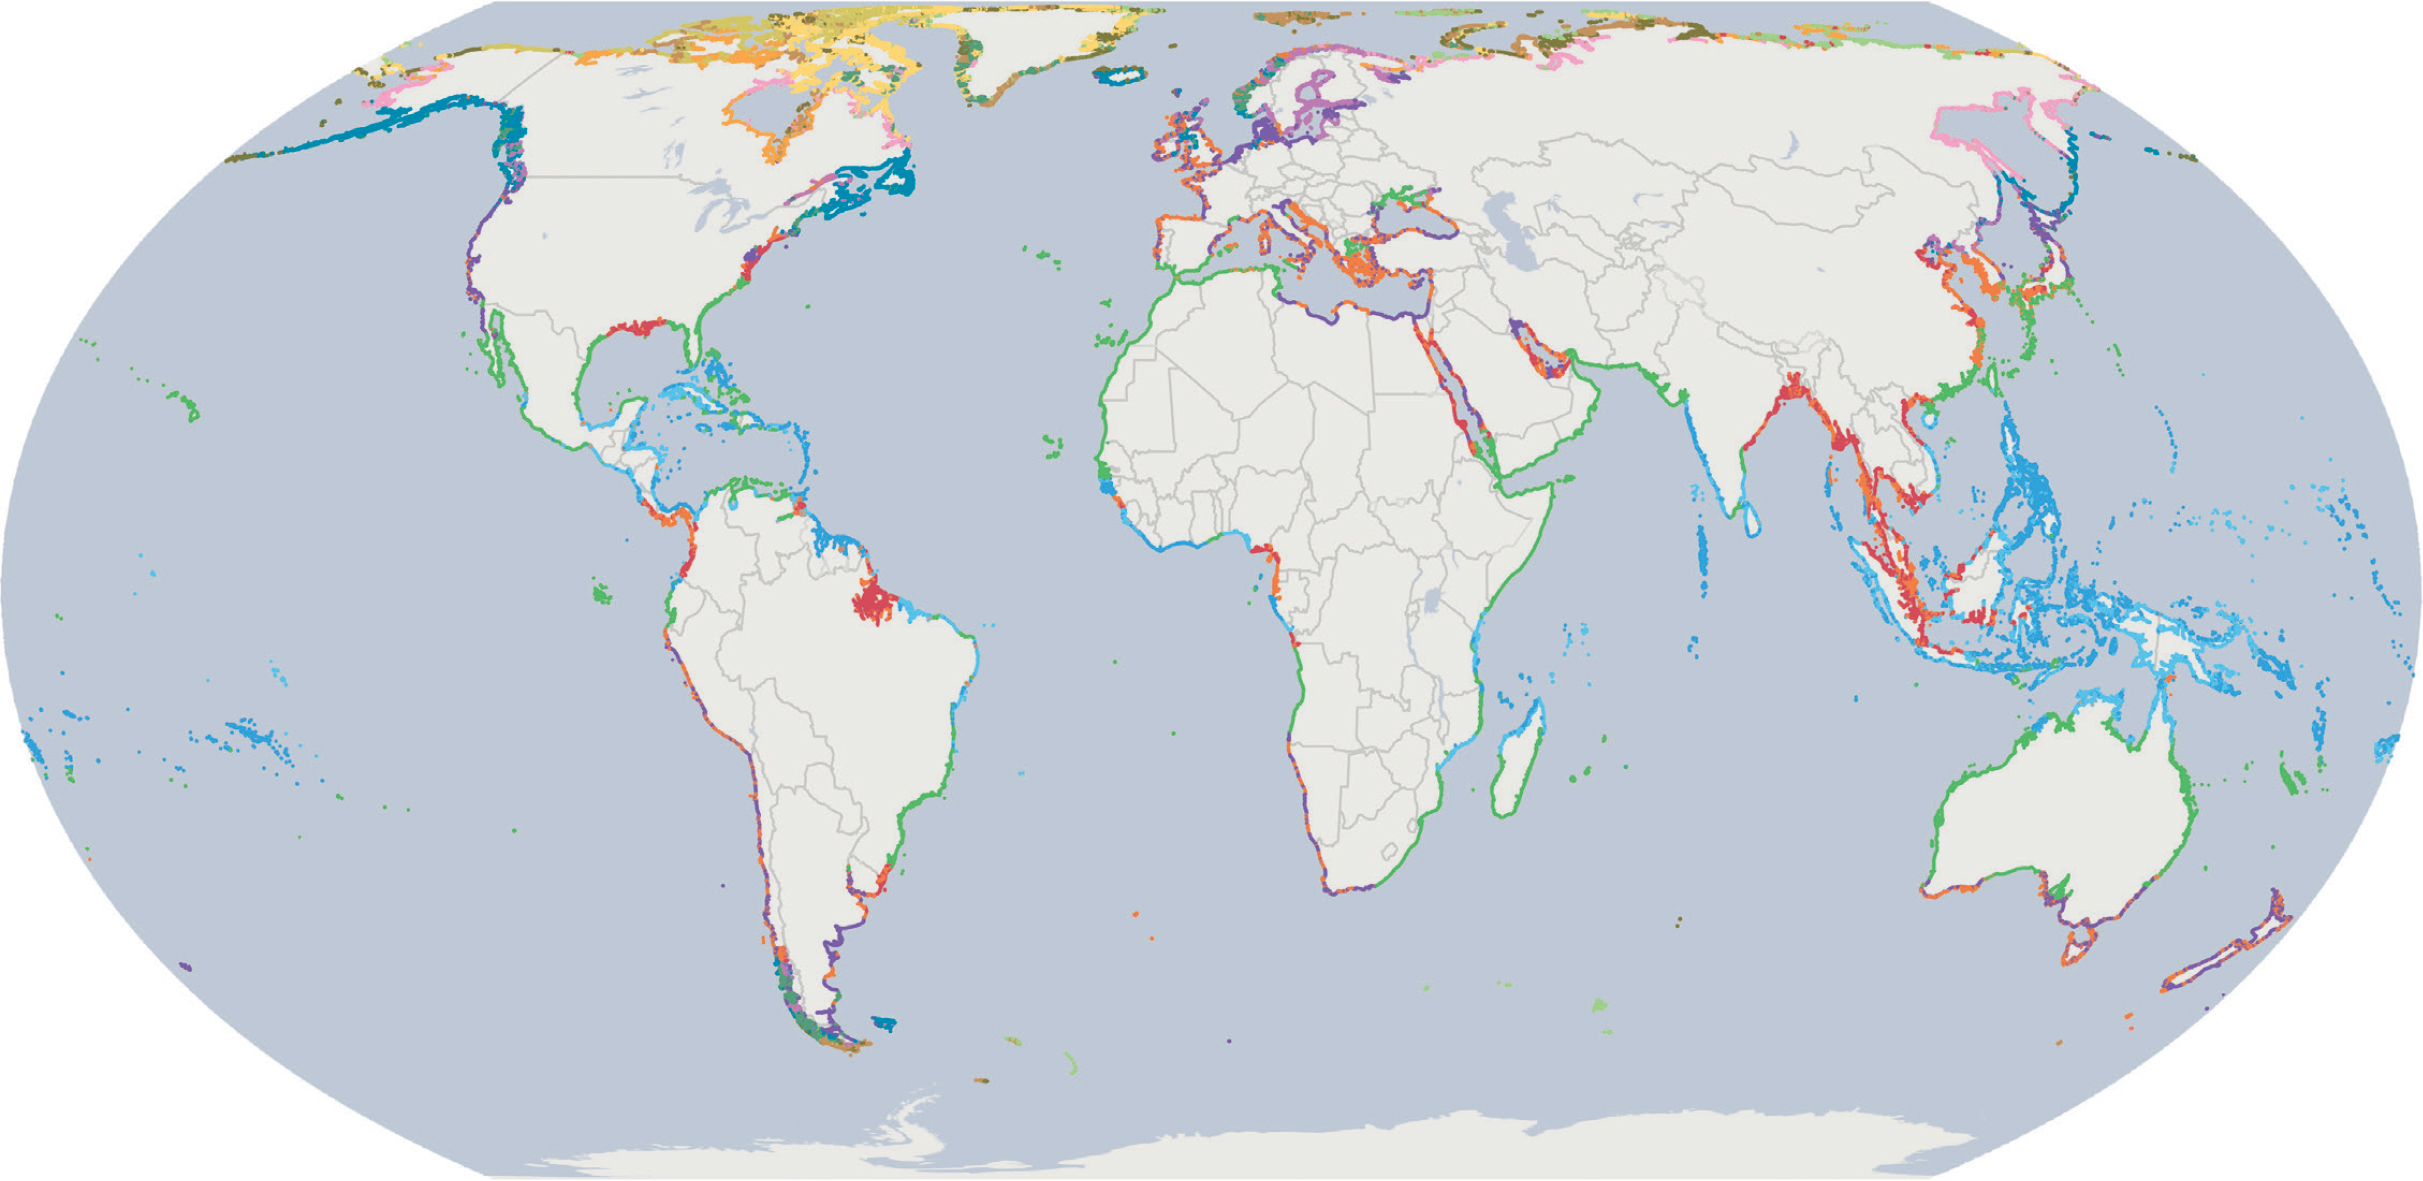
Figure 9. The distribution of 16 groups of globally similar coastlines, reflecting similarity in CSU composition. Maximum random color separation is employed to facilitate visual identification of these global ecological coastal units, derived from a statistical clustering of the 4 million segments. General patterns of latitudinal distributions are evident. Graphic reproduced from Sayre et al. (2021), which includes additional information on the clustering method and results. > High res figure
|
Discussion
The MBON sites span a considerable range of latitudes, coastal morphologies, ocean regimes, and adjacent land regimes. The geomorphology that underlies their biogeography would be difficult to compare without a digital tool. The CSU data enable standardized site-based comparisons by averaging the characteristics (CMECS values) of all the segments in the sites.
For example, the six US MBON sites encompass a range of CMECS water temperature classes, from superchilled (Alaskan Arctic, Pacific Northwest), very cold (Gulf of Maine), and moderate to cool (Central California, Santa Barbara Channel) and warm (Florida Keys). They also encompass different gradients in air temperature and moisture: Arctic – polar moist; Pacific Northwest – warm temperate moist; Central California – warm temperate dry; Santa Barbara Channel – warm temperate dry; Florida Keys – tropical moist; and Gulf of Maine – cool temperate moist. Tidal range was moderately tidal for all sites except the Alaskan Arctic, which was classified as microtidal. The Gulf of Maine contains the Bay of Fundy region, known for its high tidal amplitudes, and while the majority of segments for this MBON site were moderately tidal (62%), the rest of the coastal segments were macrotidal (30%) or megatidal (8%).
The CSU data can be used for fine-scale or large regional (including global, e.g., Figure 9) assessments. They describe “baseline” conditions for coastline settings based on long-term annual averages, and thus may be useful for analyses of change as departures from these long-term averages. Scale is an important factor in the interpretation of this work. A 1 km segment of a 30 m Landsat-derived global shoreline is likely a management-appropriate scale, and site-based applications using the CSU data as a local inventory of coastal ecological settings are encouraged. The use of the data at regional scales (e.g., comparison of coastal environments among and between sites) will likely involve statistical summaries of coastal characteristics of multiple segments.
The CSU data are complementary to the MBON seascapes, the dynamic, data-derived biogeographical regions of the ocean (Kavanaugh et al., 2016; Montes et al., 2020). The seascapes are satellite-derived characterizations of the biogeochemical properties of ocean waters produced in a regular timestep (eight-day and monthly composites). This allows for analyses of seasonal and even event-related changes. MBON site managers and scientists can access the seascape data via NOAA CoastWatch.
The CSUs provide additional site characteristics that complement the seascape data, including the physical and chemical gradients that influence biotic distributions at the coast. The data are intended to be useful for ecosystem inventory and mapping, resource assessments, and accounting; coastal and marine spatial planning; marine protected area (MPA) planning and assessment; conservation prioritization and planning; biogeographic assessments; and species and habitat modeling. The addition of occurrences of major biological assemblages (mangroves, salt marshes, seagrass and shellfish beds, coral reefs, sandy bottoms, and kelp forests) as important “biology” attributes to the data is warranted and planned, and it will increase the biodiversity monitoring value of the CSU data. For biodiversity and habitat monitoring at multiple scales, the 10 variables used to characterize the aggregate ecological setting of a coastal area are understood as fundamental determinants of biotic distributions. It is therefore plausible that the resource should be helpful in understanding changes in biotic distributions as a consequence of changes in the underlying abiotic conditions. The characterization of baseline environmental conditions is an important requirement for biodiversity monitoring. If the environmental conditions for any year (past, current, or future) are known or can be projected, they can be compared to the baseline ecological settings to identify departures from historical conditions. This information, especially in combination with information on changes in the biological assemblages themselves, is a foundational element of biodiversity and habitat monitoring
Science needs assessments have been derived from condition reports and management plans developed for the national marine sanctuaries described in the figures. The CSU data are potentially useful for addressing a number of identified science needs for these sanctuaries (https://sanctuaries.noaa.gov/science/assessment/title_index.html), including climate change, habitat characterization, and assessment of marine zoning effectiveness for the Channel Islands; climate change, habitat protection and management, and physical oceanography for the Florida Keys; nearshore characterization of resources and processes for the Olympic Coast; and similar needs at other sanctuaries.
The data may be particularly useful for ecosystem-based marine spatial planning at MBON sites. At many coastal sites, resource managers develop a number of digital data layers and spatial analytical frameworks to support decisions about human activities in and near the ocean. The process for developing and using these digital resources, known as marine spatial planning (MSP), often has an economic focus on resource extraction, infrastructure development, or use permitting, to name a few. To enhance a focus on environmental sustainability, principles of ecosystem-based management (EBM) are increasingly incorporated into MSP approaches, resulting in ecosystem-based MSP (Foley et al., 2010). The CSU data are intended to support the selection and spatial delineation of the set of ecosystems in a coastal site that are recognized and used as management units.
The CSUs are a fundamental data layer that will be useful as new global data sets become available, including global maps of mangroves, salt marshes, coral reefs, seagrass and shellfish beds, sandy bottoms, and kelp forests. The data will be available as a resource in the Environmental Systems Research Institute (Esri) Living Atlas (https://www.esri.com/en-us/arcgis/products/living-atlas) and in the public domain, and will support marine biodiversity and ecosystem conservation assessments that frame UN Sustainable Development Goal 14 and the Post-2020 Biodiversity Framework of the Convention on Biological Diversity. Ultimately, the CSU data, along with other standardized and globally comprehensive resources such as seascapes (Kavanaugh et al., 2016) and oceanic Ecological Marine Units (Sayre et al., 2017), could be considered as foundational elements of an emerging “digital” ocean. The first research and development priority of the 2021–2030 UN Decade of Ocean Science for Sustainable Development program is the creation of a globally comprehensive and georeferenced common digital atlas of the ocean (Ryabinin et al., 2019). The CSUs offer a valuable contribution to the envisioned set of UN Decade outcomes.
Conclusion
The coastal segment units data represent a globally comprehensive and standardized geospatial data layer on coastal ecological settings. The data were derived from segmentation and attribution of 4 million 1 km or shorter coastline segments. Classification of the segments using the Coastal and Marine Ecological Classification Standard resulted in the identification of 81,000 distinct CSUs. The granularity of the CSU resource (1 km or shorter segments) allows for assessment of coastal ecological settings at local, regional, national, and greater scales. The designated CSUs in seven regional-scale MBON sites were assessed and compared. In addition to the standardized site characterization value, the CSU data are intended to be useful for a variety of research and management applications that include ecosystem-based marine spatial planning, conservation priority setting, species habitat modeling, ecosystem accounting, and scientific assessments undertaken in support of the Sustainable Development Goals and the Conservation of Biological Diversity objectives. Ultimately, the CSU resource represents an element of a common digital atlas of the ocean, as commissioned by the UN Decade of Science for Sustainable Development (2021–2030).
Acknowledgments
The authors appreciate the helpful reviews of Abigail Benson (US Geological Survey) and Katharine Egan (National Oceanic and Atmospheric Administration) and two anonymous reviewers. Any use of trade, firm, or product names is for descriptive purposes only and does not imply endorsement by the US government.

