Introduction and Overview (1965–Present)
While oceanographers were meeting in Hilo, Hawai‘i, to discuss the Bikini atomic bomb tests, they experienced the April 1, 1946, Alaska-generated tsunami that killed 187 people without any warning (MacDonald et al., 1947). In response to this natural disaster, the US Coast & Geodetic Survey (USC&GS), predecessor to the National Oceanic and Atmospheric Administration (NOAA), established an ad hoc earthquake-centric tsunami warning system in 1947 with no new funding (Zetler, 1988). A tsunami travel time chart was developed by the USC&GS so the system could accurately predict the time of tsunami arrival in Hawai‘i. The Seismic Sea Wave Warning System became operational on August 12, 1948, using the Navy’s communication system to receive data and broadcast warnings. In 1952 and 1957, warnings issued when tsunamis were approaching Hawai‘i (Dudley and Lee, 1998) proved the value of the warning system and led to funding for continued research and operations.
Crawl 1965–1980: Basic Research to Understand Tsunamis
In 1965, an agreement was reached between the University of Hawai‘i and the USC&GS to form the Joint Tsunami Research Effort (JTRE), the first federal organization mandated to conduct tsunami research. Gaylord Miller (Figure 1) was appointed as the first director, and state and federal funding was provided to continue tsunami research at the University of Hawai‘i. In 1973, JTRE merged with the Pacific Marine Environmental Laboratory (PMEL) and continued to focus on tsunamis.
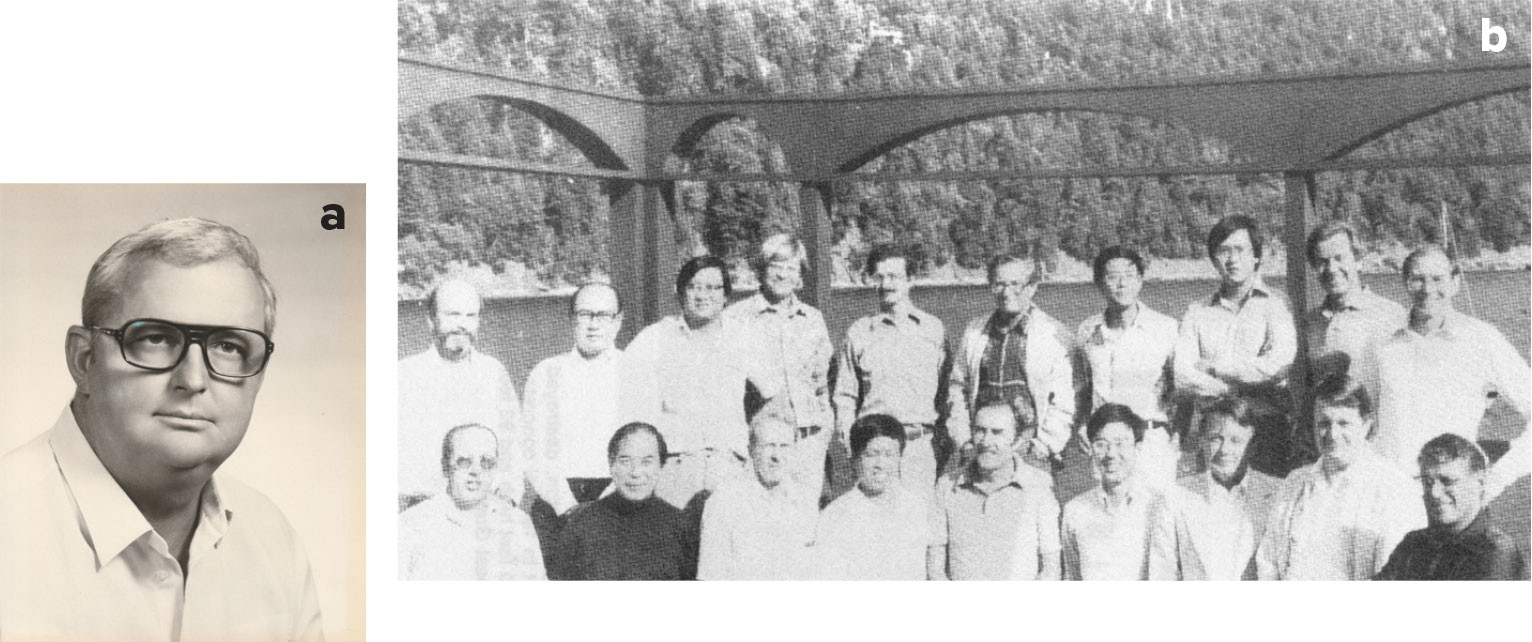
FIGURE 1. (left) Gaylord Miller was the first director of tsunami research for the NOAA Pacific Marine Environmental Laboratory (PMEL). (right) The Tsunami Research Planning Group gathered for a picture during a meeting at Orcas Island, Washington, in 1980. Top row from left: Jerry Harbor (NCR), George Lea (NSF), Chi Liu (NSF), Roger Stewart (USGS), James Houston (ACOE), Bernard LeMehaute (U. Miami), David Tung (N. Carolina State), Keen Lee (Tetra Tech), Richard Goulet (NSF), Eddie Bernard (PMEL/NOAA). Bottom row, from left: Dennis Moore (JIMAR), Ted Wu (Cal Tech), George Carrier (Harvard), Li San Hwang (Tetra Tech), William Van Dorn (Scripps), Phil Hseuh (NSF), Hal Loomis (NOAA), Charles Theil (FEMA), Fred Raichlen (Cal Tech). > High res figure
|
Early research activities included tsunami instrumentation developed by Martin Vitousek, studies of hydrodynamics of long period waves by Harold Loomis, and tsunami propagation modeling by Gaylord Miller and Eddie Bernard (Pararas-Carayannis, 2012). A 1972 US/Union of Soviet Socialist Republic (USSR) Agreement on Environmental Protection funded a cooperative project on tsunami research. The project consisted of a tsunami observational component with oceanographic expeditions to the USSR’s Kuril Islands and a modeling component hosted by the Siberian Academy of Sciences’ Computing Center in Academgorodak, USSR.
On November 29, 1975, due to a human error, no warning was issued for a local Hawaiian tsunami that killed two people. NOAA investigated the human error and developed a plan of action to improve tsunami warning operations. PMEL’s Bernard was appointed Director of NOAA’s Seismic Sea Wave Warning Center, which was renamed the Pacific Tsunami Warning Center in 1977. Bernard followed NOAA’s action plan by integrating computer technology into tsunami warning operations and installing Hawai‘i’s local tsunami warning system from 1977 to 1980. JTRE played an important role in designing the arrays of tide gauges and seismometers. As a result of this success, PMEL’s Gaylord Miller received the Department of Commerce Gold Medal posthumously in 1977.
After Miller died in December 1976, JTRE split into the Joint Institute for Marine and Atmospheric Research (JIMAR) in Hawai‘i and a tsunami research program at PMEL in Seattle. Bernard re-joined PMEL in 1980 as Deputy Director and leader of PMEL’s tsunami research in Seattle.
Walk 1980–2004: Research to Support NOAA Operations
In 1980, NOAA and the National Science Foundation (NSF) co-sponsored an advisory committee workshop, composed of representatives from US federal agencies (Figure 1), that resulted in the first tsunami research plan for the United States (Bernard, 1983). Most US tsunami-related research and warning activities were funded by state of Hawai‘i and federal government sources, with NOAA, NSF, the US Army Corps of Engineers (USACE), the Nuclear Regulatory Commission (NRC), the United States Geological Survey (USGS), and the Federal Emergency Management Agency (FEMA) providing $2.5 million in funding, including $1.3 million for basic and applied research. The group established two goals for tsunami research: (1) forecasting tsunami dangers, and (2) evaluating coastal tsunami hazards to reduce loss of life and destruction of property. To realize these goals, an agreement was made that NSF, USACE, and NRC would fund tsunami modeling efforts, NOAA would fund tsunami observational research in both coastal and deep water, USGS would fund earthquake research, and FEMA would fund response and recovery research.
The 1980 tsunami research plan provided PMEL with a roadmap for moving forward on a limited budget. Building on its strength in ocean observations, deep-ocean tsunami observations became the top research priority for PMEL. NOAA’s tide program led the development of real-time reporting of coastal tide data. Deep ocean pilot projects were carried out in the Gulf of Alaska using internally recording bottom pressure recorders (BPRs), and several tsunamis were recorded in the deep ocean for the first time in 1986, 1987, and 1989. This was also the first time that high-resolution tsunami models were used together with bottom pressure measurements to study the potential for forecasting tsunami flooding (González et al., 1991).
In 1986, a tsunami warning for Hawai‘i led to the evacuation of Waikiki, the dismissal of all state employees, and an ensuing traffic congestion that created a situation where cars were gridlocked in evacuation zones. The government of Hawai‘i estimated this false alarm cost the state about $112 million in inflation-adjusted dollars (Bernard and Titov, 2015) and led to the loss of credibility for tsunami warnings. This experience resulted in additional PMEL funding from the Department of Defense for development of deep-ocean tsunami observations to avoid false alarms. Because hindcasts of deep-ocean tsunami measurements showed promise for forecasting tsunami coastal impacts, PMEL took the first important step with the development and field testing of the first generation of real-time tsunami detection systems, named “Deep-ocean Assessment and Reporting of Tsunamis (DART; Figure 2; González et al., 2005). See the next section on the History of DART Research and Development for details.
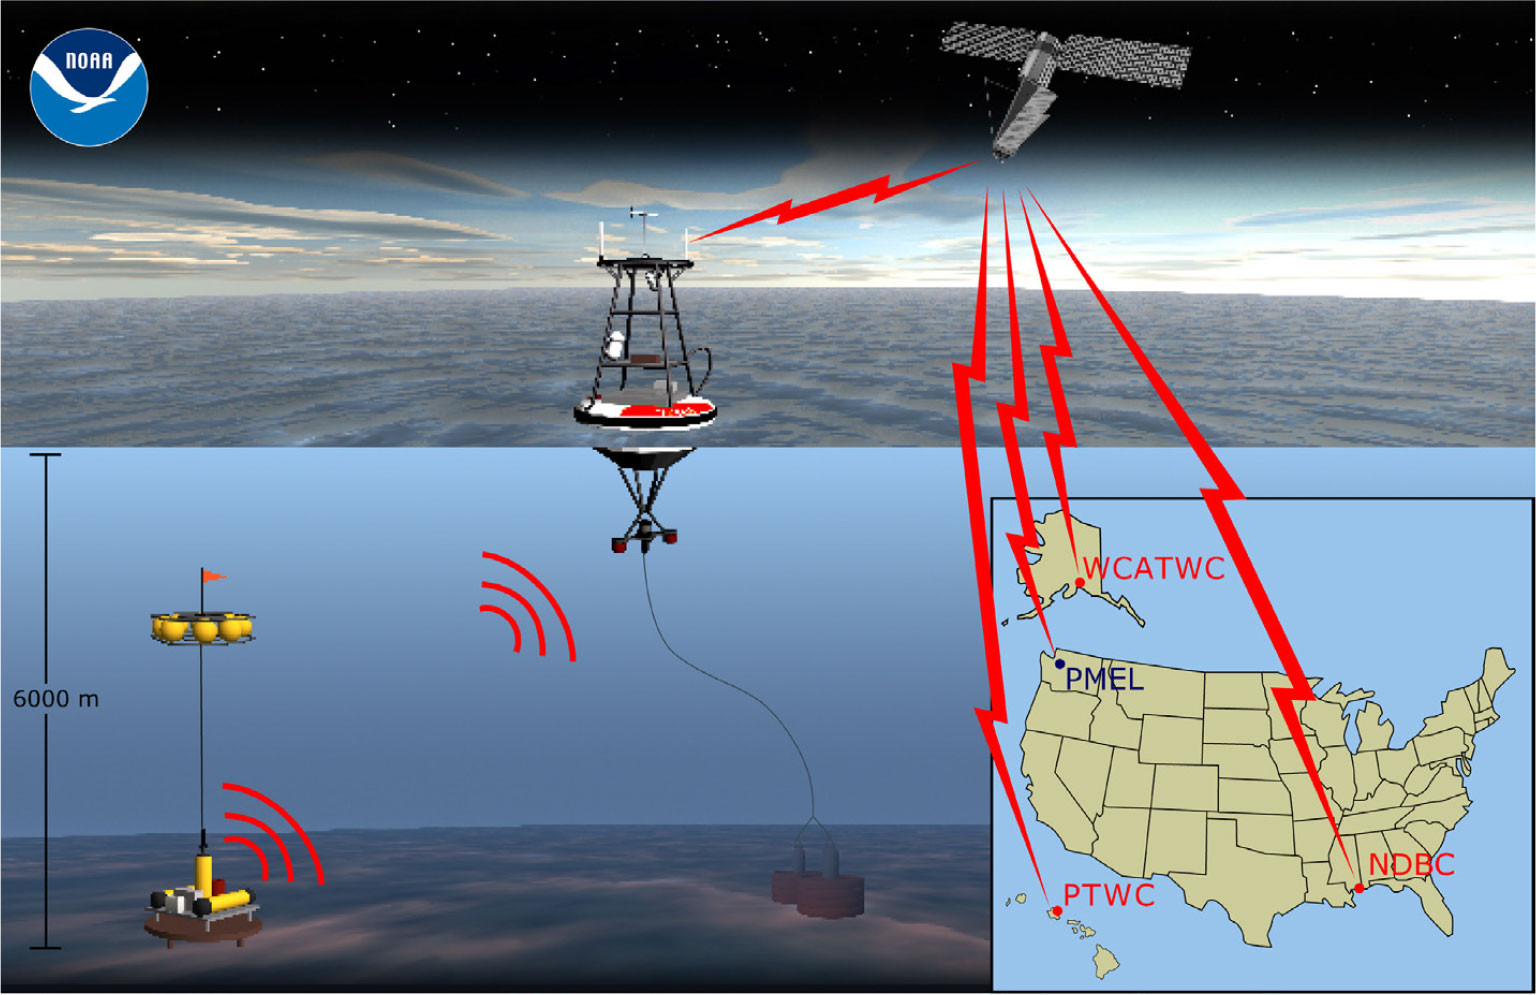
FIGURE 2. Deep-ocean Assessment and Reporting of Tsunamis (DART) buoy station. The bottom pressure recorder transmits data to the surface buoy (center) that, in turn, sends the data to a satellite for distribution to tsunami warning centers, where they are assimilated into tsunami forecast models. > High res figure
|
Success in measuring tsunamis in the deep ocean gave rise to PMEL’s tsunami modeling program as detailed in the section on the History of Tsunami Modeling. NOAA’s mission to provide tsunami warning required the use of numerical models that assimilated DART buoy data in real time to forecast tsunami flooding along US coastlines. NOAA’s role in measuring tsunamis at tide stations and in the deep ocean was a perfect fit for developing validated numerical models for use in warning operations. PMEL’s research program became the only domestic or international effort that had tsunami observations and modeling activities under one roof.
Additional funding for PMEL’s tsunami research effort came from the formation of the National Tsunami Hazard Mitigation Program (NTHMP). The local 1992 California and distant 1994 Russia tsunamis raised new concerns about US tsunami preparedness. As a result, the Senate Appropriations Committee directed NOAA to formulate a plan for reducing tsunami risks to coastal residents. Within 10 months, tsunami hazard assessment, warnings, and mitigation were addressed during three tsunami workshops hosted by PMEL and involving over 50 scientists, emergency planners, and emergency operators from all levels of governments and universities. The Tsunami Hazard Mitigation Federal/State Working Group, with representatives from the states of Alaska, California, Hawai‘i, Oregon, and Washington as well as NOAA, FEMA, and USGS, held a workshop in 1996 that identified primary issues of concern to the states. Based on these issues, the plan established three fundamental areas of effort at funding levels of $2.3 M/year: (1) hazard assessment (produce tsunami hazard maps), (2) warning guidance (deploy tsunami detection buoys), and (3) mitigation (develop state/local mitigation plans) (Bernard, 1998). PMEL’s Director, Bernard, was elected the first chair of the NTHMP, and PMEL received funding to distribute to states. NTHMP funding from 1996 to 2004 allowed PMEL to develop tsunami detection buoys (Bernard and Meinig, 2011) and produce tsunami flooding forecast capability (Titov et al., 2005), advancing purposeful research to support NOAA’s mission. NTHMP also initiated a US “Tsunami Ready” program to recognize communities that met basic tsunami preparedness criteria, including tsunami hazard maps. “Tsunami Ready” road signs would be placed at the entrance of the community to signify this readiness. Through PMEL’s leadership, the formation of NTHMP has reduced the tsunami threat to US coastlines.
Run 2004–Present: Sharing and Advancing PMEL Tsunami Research
The horrific December 26, 2004, Indian Ocean tsunami, which killed over 230,000 people and displaced 1.7 million across 14 countries, stimulated governments of the world to address tsunami hazards. NOAA and the USGS received $40 million to strengthen the existing US tsunami warning system. NOAA was tasked with deploying an array of 39 DART stations as the foundation of a global tsunami warning system and succeeded in setting up an interim tsunami warning service for the Indian Ocean. PMEL became the center of scientific tsunami knowledge, triggering a frenzy of requests for information from Congress, NOAA, and the national and international media as well as visiting delegations from Indian Ocean nations and members of Congress. In addition, there was a call to develop a second strategic plan for tsunami research in the United States, published as The National Tsunami Research Plan (Bernard et al., 2007). In addition to recommending priorities for tsunami research, the plan summarized contributions from various agencies, documenting that the United States spent about $55 million in 2005 for tsunami risk reduction activities. Comparing these inflation-adjusted funding levels with the 1980s, there has been a ninefold increase in total US tsunami effort with a threefold increase in tsunami research funding over this 25-year interval.
Most importantly, in 2006, the US Congress passed the Tsunami Warning and Education Act (Public Law 109-424) as an extension of the efforts of the NTHMP. The act has four elements: warning, education, research, and international cooperation. Both the national research plan and the tsunami act emphasize research that embraces tsunami resilience—the ability of a community to quickly recover from a tsunami. PMEL’s observational and modeling research and development contributions, as well as the formation and early leadership of NTHMP, are the pillars of the national and international effort in tsunami mitigation (Bernard, 2012). PMEL continued to develop the DART and tsunami flooding technology into a real-time tsunami flooding forecast capability, recognized by a Department of Commerce Gold Medal award. This capability was tested during the 2011 Japanese tsunami when a flooding forecast was issued for the Hawaiian Islands six hours before tsunami arrival, allowing ample time to evacuate coastal areas (Bernard and Titov, 2015). Flooding occurred on all islands, validating the forecast accuracy, and more importantly, there were no deaths.
In 2013, PMEL completed the transfer of models to NOAA operations and the US Congress reauthorized the legislation as the Tsunami Warning, Education, and Research Act. Advancing the distributed forecast concept, PMEL has developed two prototype web tools: (1) the Community Model Interface for Tsunamis (ComMIT), which allowed development, use, and sharing of tsunami modeling results (Titov, et al., 2011); and (2) Tweb, which allows sharing forecast results for different coastlines via a graphical web client (Bernard and Titov, 2015). Tweb also allows extremely fast development of the tsunami forecast capability for specific locations.
The 2022 Tonga volcanic eruption generated a Pacific-wide tsunami (Lynett, et al., 2022). Earthquake-centric warning systems struggled to evaluate the tsunami potential from this non-earthquake source, and as a result, information was confusing and not timely. PMEL’s experimental tsunami forecast products, on the other hand, used available DART data and provided quantitative threat estimates for Pacific coastlines during the event (see Tweb product in Figure 3). Efforts are underway to implement such “source-independent” assessments into tsunami warning operations of national and international tsunami warning centers.
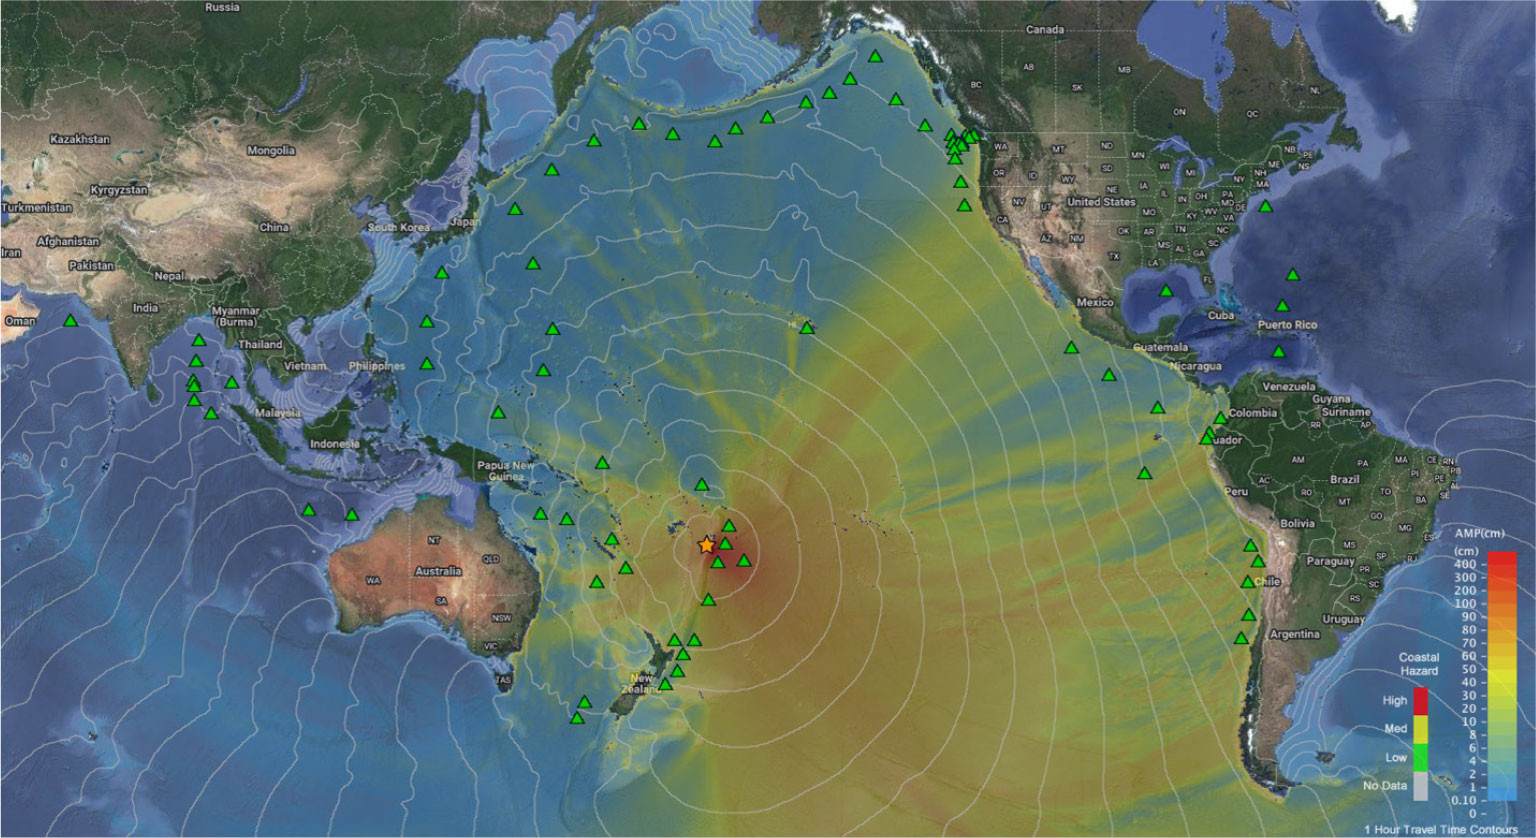
FIGURE 3. Tonga volcano eruption event as displayed in Tweb. Green triangles indicate locations of the international network of 72 DART stations supported by the United States, India, Thailand, Chile, Australia, Columbia, and New Zealand. > High res figure
|
History of DART Research and Development
Initial Development for Real-Time Measurement
The history of the development of real-time measurements of tsunamis in the deep ocean for the purpose of forecasting coastal tsunami impacts began in the 1980s, with early testing of various instruments designed to determine if tsunamis could be measured in the deep ocean (Bernard and Meinig, 2011). We found that the measurement of pressure changes induced by a tsunami required a high-resolution pressure sensor installed on the seafloor to provide a near motionless and temperature stable environment for optimal sensor performance. Additionally, by placing the BPR in the deep ocean, higher-frequency wind waves are naturally attenuated and do not bias the tsunami signal.
Early self-recording BPRs included ultra-low-powered electronics and a digital broadband depth sensor. The sensor included a Bourdon tube, which generated an uncoiling force that applied tension to the quartz crystal resting on the seafloor; it used the depth of the ocean as a pressure reference (Paroscientific, 2004). Once deep ocean measurements were deemed possible, testing and evaluation continued in order to develop critical real-time communications from the BPR to the warning centers. Multiple approaches and four years of ocean testing were devoted to identifying which technology was accurate, affordable, and reliable enough to be used for forecasting under tsunami warning conditions (Meinig et al., 2001). When PMEL completed the research, development, and field testing of an operational prototype based on warning center requirements, in October 2003, the technology was transferred to NOAA operations (Bernard and Meinig, 2011). The system design consisted of a BPR that relayed communications via acoustic modem to a surface buoy connected in real time to shore via a satellite link (Figure 2).
The first-generation DART array comprised six stations strategically located off Alaska, Oregon, and near the equator, the latter to detect tsunamis originating in the Chile/Peru area. The DART I array demonstrated its value within four months by measuring a small tsunami that originated in Alaska and relaying these data to NOAA’s tsunami warning centers in real time. DART data indicated a nondestructive tsunami had been generated, and evacuation of Hawai‘i’s coastline was unnecessary. Avoiding a false alarm minimized disruptions to coastal communities and validated the DART system design.
DART Development
The December 2004 Indian Ocean tsunami motivated the development of the second-generation DART system (DART II) that included global functionality and a two-way communication link from seafloor instruments to the warning centers. It used a newly available global low-Earth orbiting commercial satellite network that allowed a standardized DART II to be deployed anywhere on the globe and communicate with any warning center in the world. An additional capability allowed DART II to be triggered from shore prior to the arrival of an expected tsunami wave, so that warning center operators had the option of accessing tsunami data on demand.
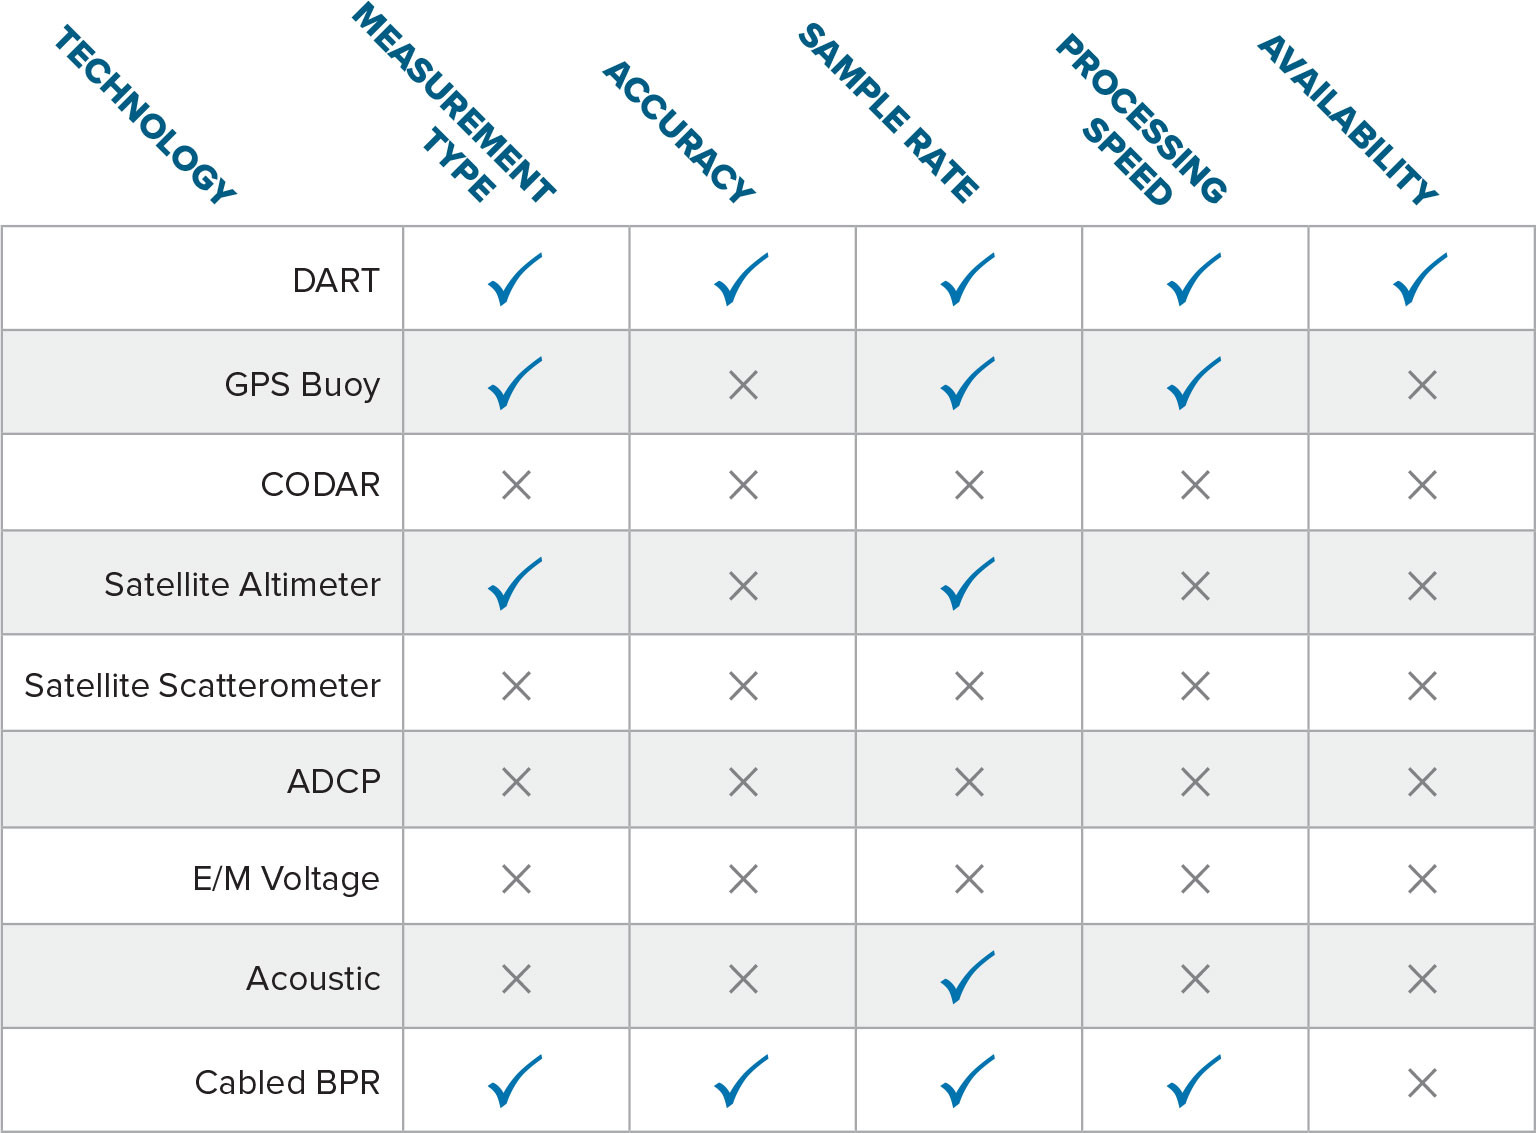
Another impact of the 2004 Indian Ocean tsunami was the identification of many techniques that were touted as being capable of detecting tsunamis in the deep ocean, including satellite-based technologies (e.g., altimeters, scatterometers, and differential GPS), radar-based technologies (e.g., over-the-horizon radars and CODAR), and acoustic-based technologies (e.g., hydrophones and seismometers). By applying the following requirements for real-time tsunami forecasting globally—(1) measurement type: amplitude over time; (2) accuracy: 0.5 cm; (3) sample rate: <1 min; (4) processing speed: within 2 min; and (5) availability: within 5 min—only one technology could measure tsunamis accurately, reliably, and within time constraints required to forecast tsunamis in real time. Table 1 illustrates that DART technology is able to meet all five requirements and identifies the limitations of other tsunami measurement technologies.
TABLE 1. Comparison of technologies meeting requirements for tsunami forecasting. Blue check indicates meeting requirement, while X indicates not meeting requirement (Bernard and Meinig, 2011). > High res table
|
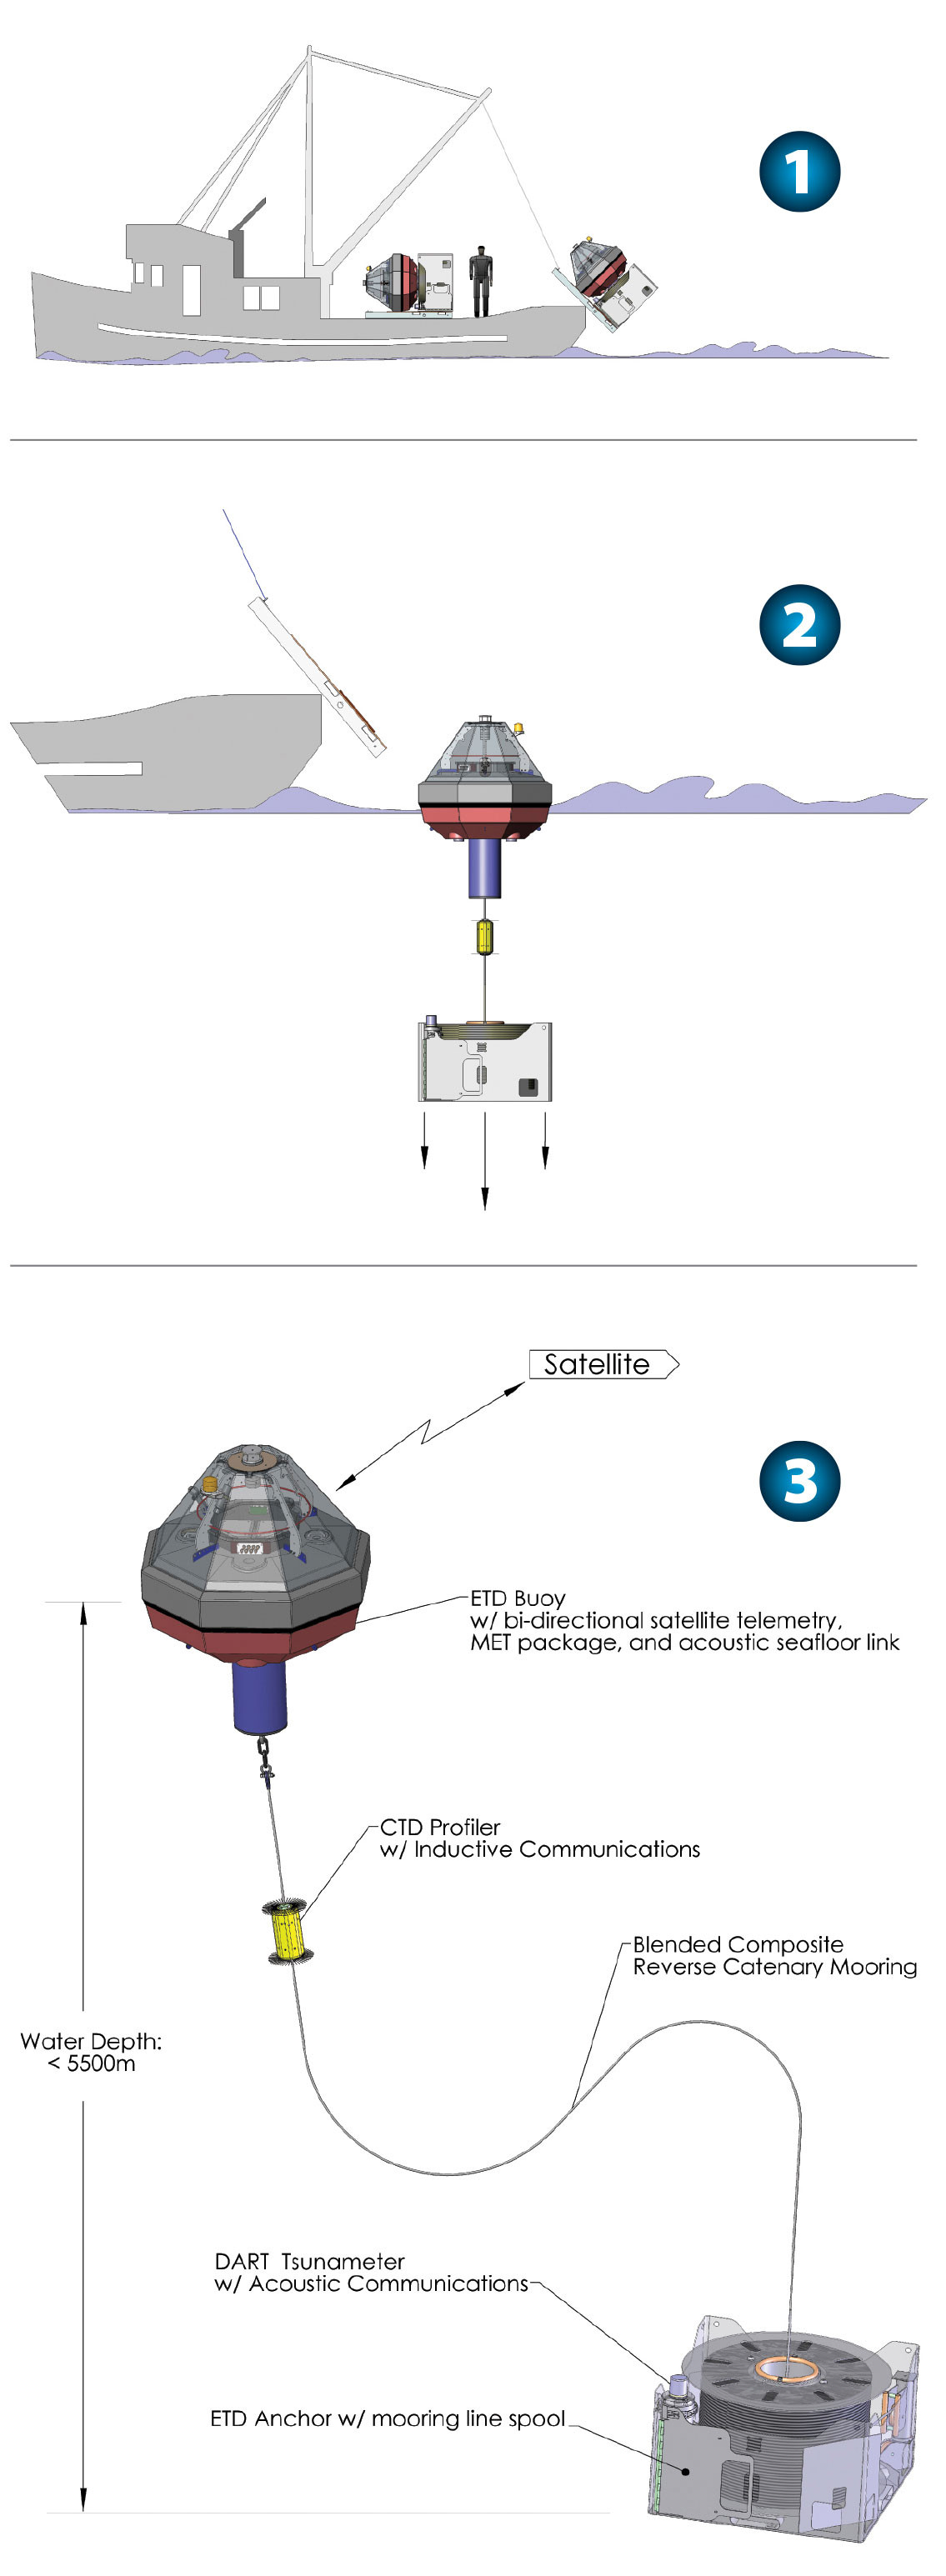
By 2008, NOAA expanded the original DART array from six to 39 stations in the Pacific and Atlantic Oceans. Because NOAA wanted to make this technology available to all nations, PMEL took a strategic, two-pronged approach: (1) publishing the system description and characteristics, and (2) licensing the DART technology patents to a US company, Science Applications International Corporation (SAIC), that currently manufactures and supports DART systems. Meanwhile, PMEL continued to make improvements to the original design, adding warning center requirements, reducing operating costs, and improving reliability. By 2010, over 40 tsunamis had been measured using DART technology, and the third-generation DART system had become a part of the operational global array. The DART Easy to Deploy (ETD; Figure 4) is more affordable and does not require large ships or highly specialized crew to deploy and maintain the operational arrays.
While the DART technology was reliable in monitoring for tsunami from far-field events, it could not separate the earthquake and tsunami signals in the near field during rupture. By 2015, a fourth-generation DART (DART 4G) system that incorporates key pressure sensor improvements (Paros et al., 2011) was developed to work in seismically active subduction zones as well as for far-field tsunami detection. The added near-field capability gave emergency managers additional flexibility to optimize array design for reducing warning times for communities under threat. By 2019, the DART 4G was deployed in the shallow waters of Lake Michigan and detected multiple meteotsunamis generated from atmospheric disturbances.
Multiple generations of DART systems were developed using a rigorous testing process based on system requirements that enabled the PMEL tsunami modeling group to revolutionize the timeliness and accuracy of flooding predictions for vulnerable communities. The international network of over 72 DART stations, supported by the United States, Russia, India, Thailand, Chile, Australia, Ecuador, Columbia, Taiwan, and New Zealand, now protects large populations from tsunamis (Figure 3).
History of Tsunami Modeling
PMEL developed tsunami models for both short-term and long-term hazard assessments at numerous locations globally, as illustrated in Figure 5. Short-term hazard assessment supports NOAA’s mission to issue real-time tsunami warnings that include flooding forecast capability based on DART data assimilation (Titov et al., 2005). A long-term tsunami hazard assessment is the application of this modeling technology to identify the potential impact of a tsunami on a coastal community at risk. Long-term assessment can use deterministic or probabilistic approaches, both discussed in this section.
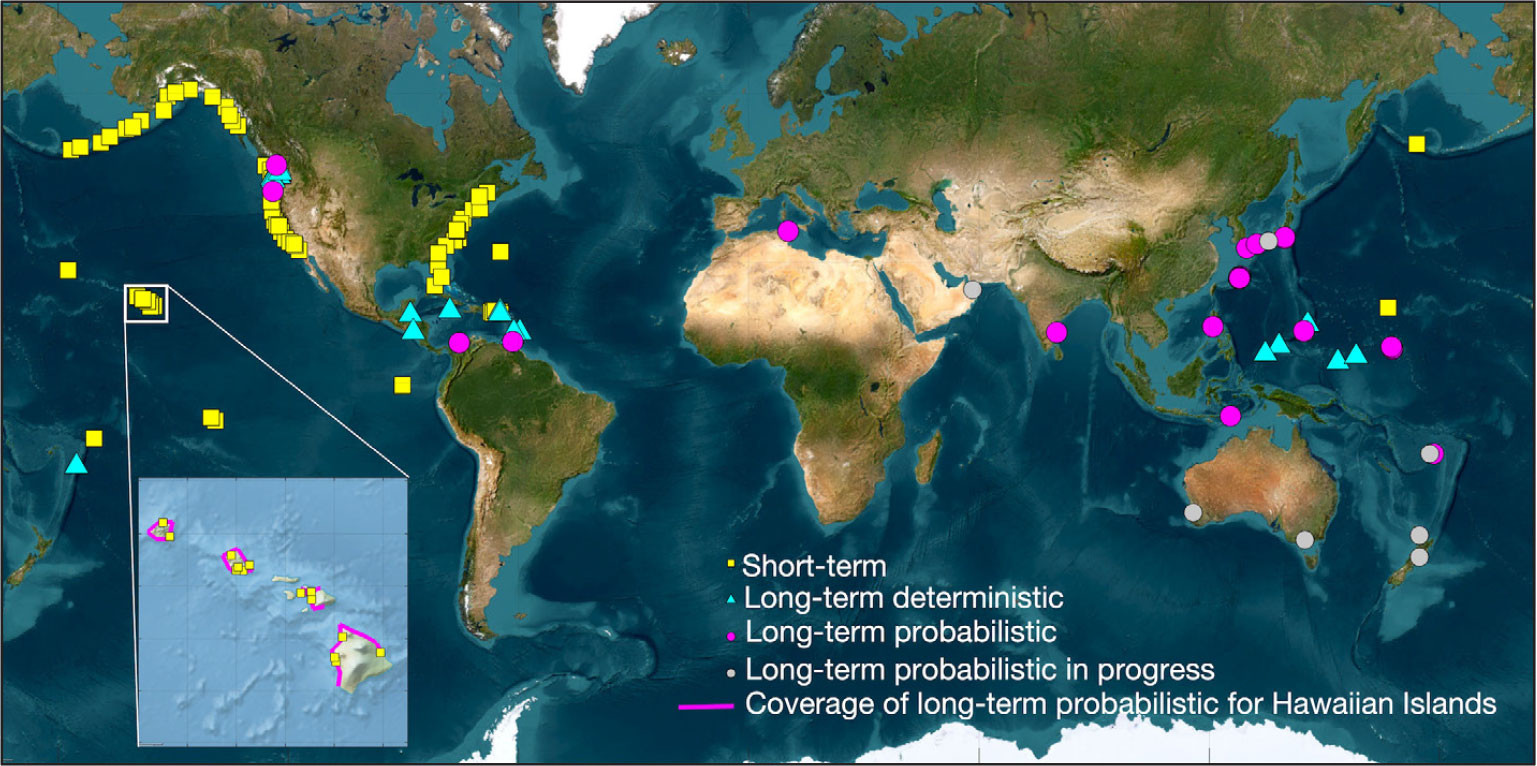
FIGURE 5. Various symbols show location coverage of PMEL’s short-term and long-term tsunami inundation hazard assessment models. > High res figure
|
Short-Term Assessment
The original tsunami propagation code that later became the basis of the flooding model was developed at the Novosibirsk Computing Center of the Siberian Division of the Russian Academy of Sciences of what was then the USSR, from 1984 to 1989. A novel numerical scheme was applied to solve the nonlinear shallow water wave (NSW) equations, without artificial viscosity or application of a friction factor. The method has proven to be especially efficient for tsunami forecast application, providing very fast computation with validated accuracy. Further development of the tsunami model occurred at the University of Southern California from 1992 to 1997 to add the capability of tsunami flooding simulation. These successes were documented in Titov and Synolakis (1998). More importantly, the model had undergone intense testing and verification during two NSF-sponsored tsunami model benchmarking workshops that led to development of standard tsunami model benchmarking procedures (Synolakis et al., 2008). In 1997, this flooding model was first introduced as a NOAA tsunami forecast tool (Titov, 2009). The transition was funded by the Defense Advanced Research Projects Agency (DARPA). This project pioneered the use of deep ocean pressure data for tsunami flooding forecasts. At first, measurements were not transmitted in real time but rather were recovered from the BPR after a year-long deployment. The NOAA flooding model used the pressure records of the 1996 Andreanof tsunami to test the distant tsunami propagation simulation capability.
The flooding model was further developed by introducing three standardized levels of telescoping computational grids that zoomed into a coastal location, with adequate grid resolution for accurate inundation modeling (Figure 6). Tsunami observation data from the 1993 Okushiri Island, 1994 Kuril Islands, and 1996 Andreanof Island tsunamis (Titov et al., 2005) confirmed these choices and established the standard resolution for the inundation model resolution of 50 m.
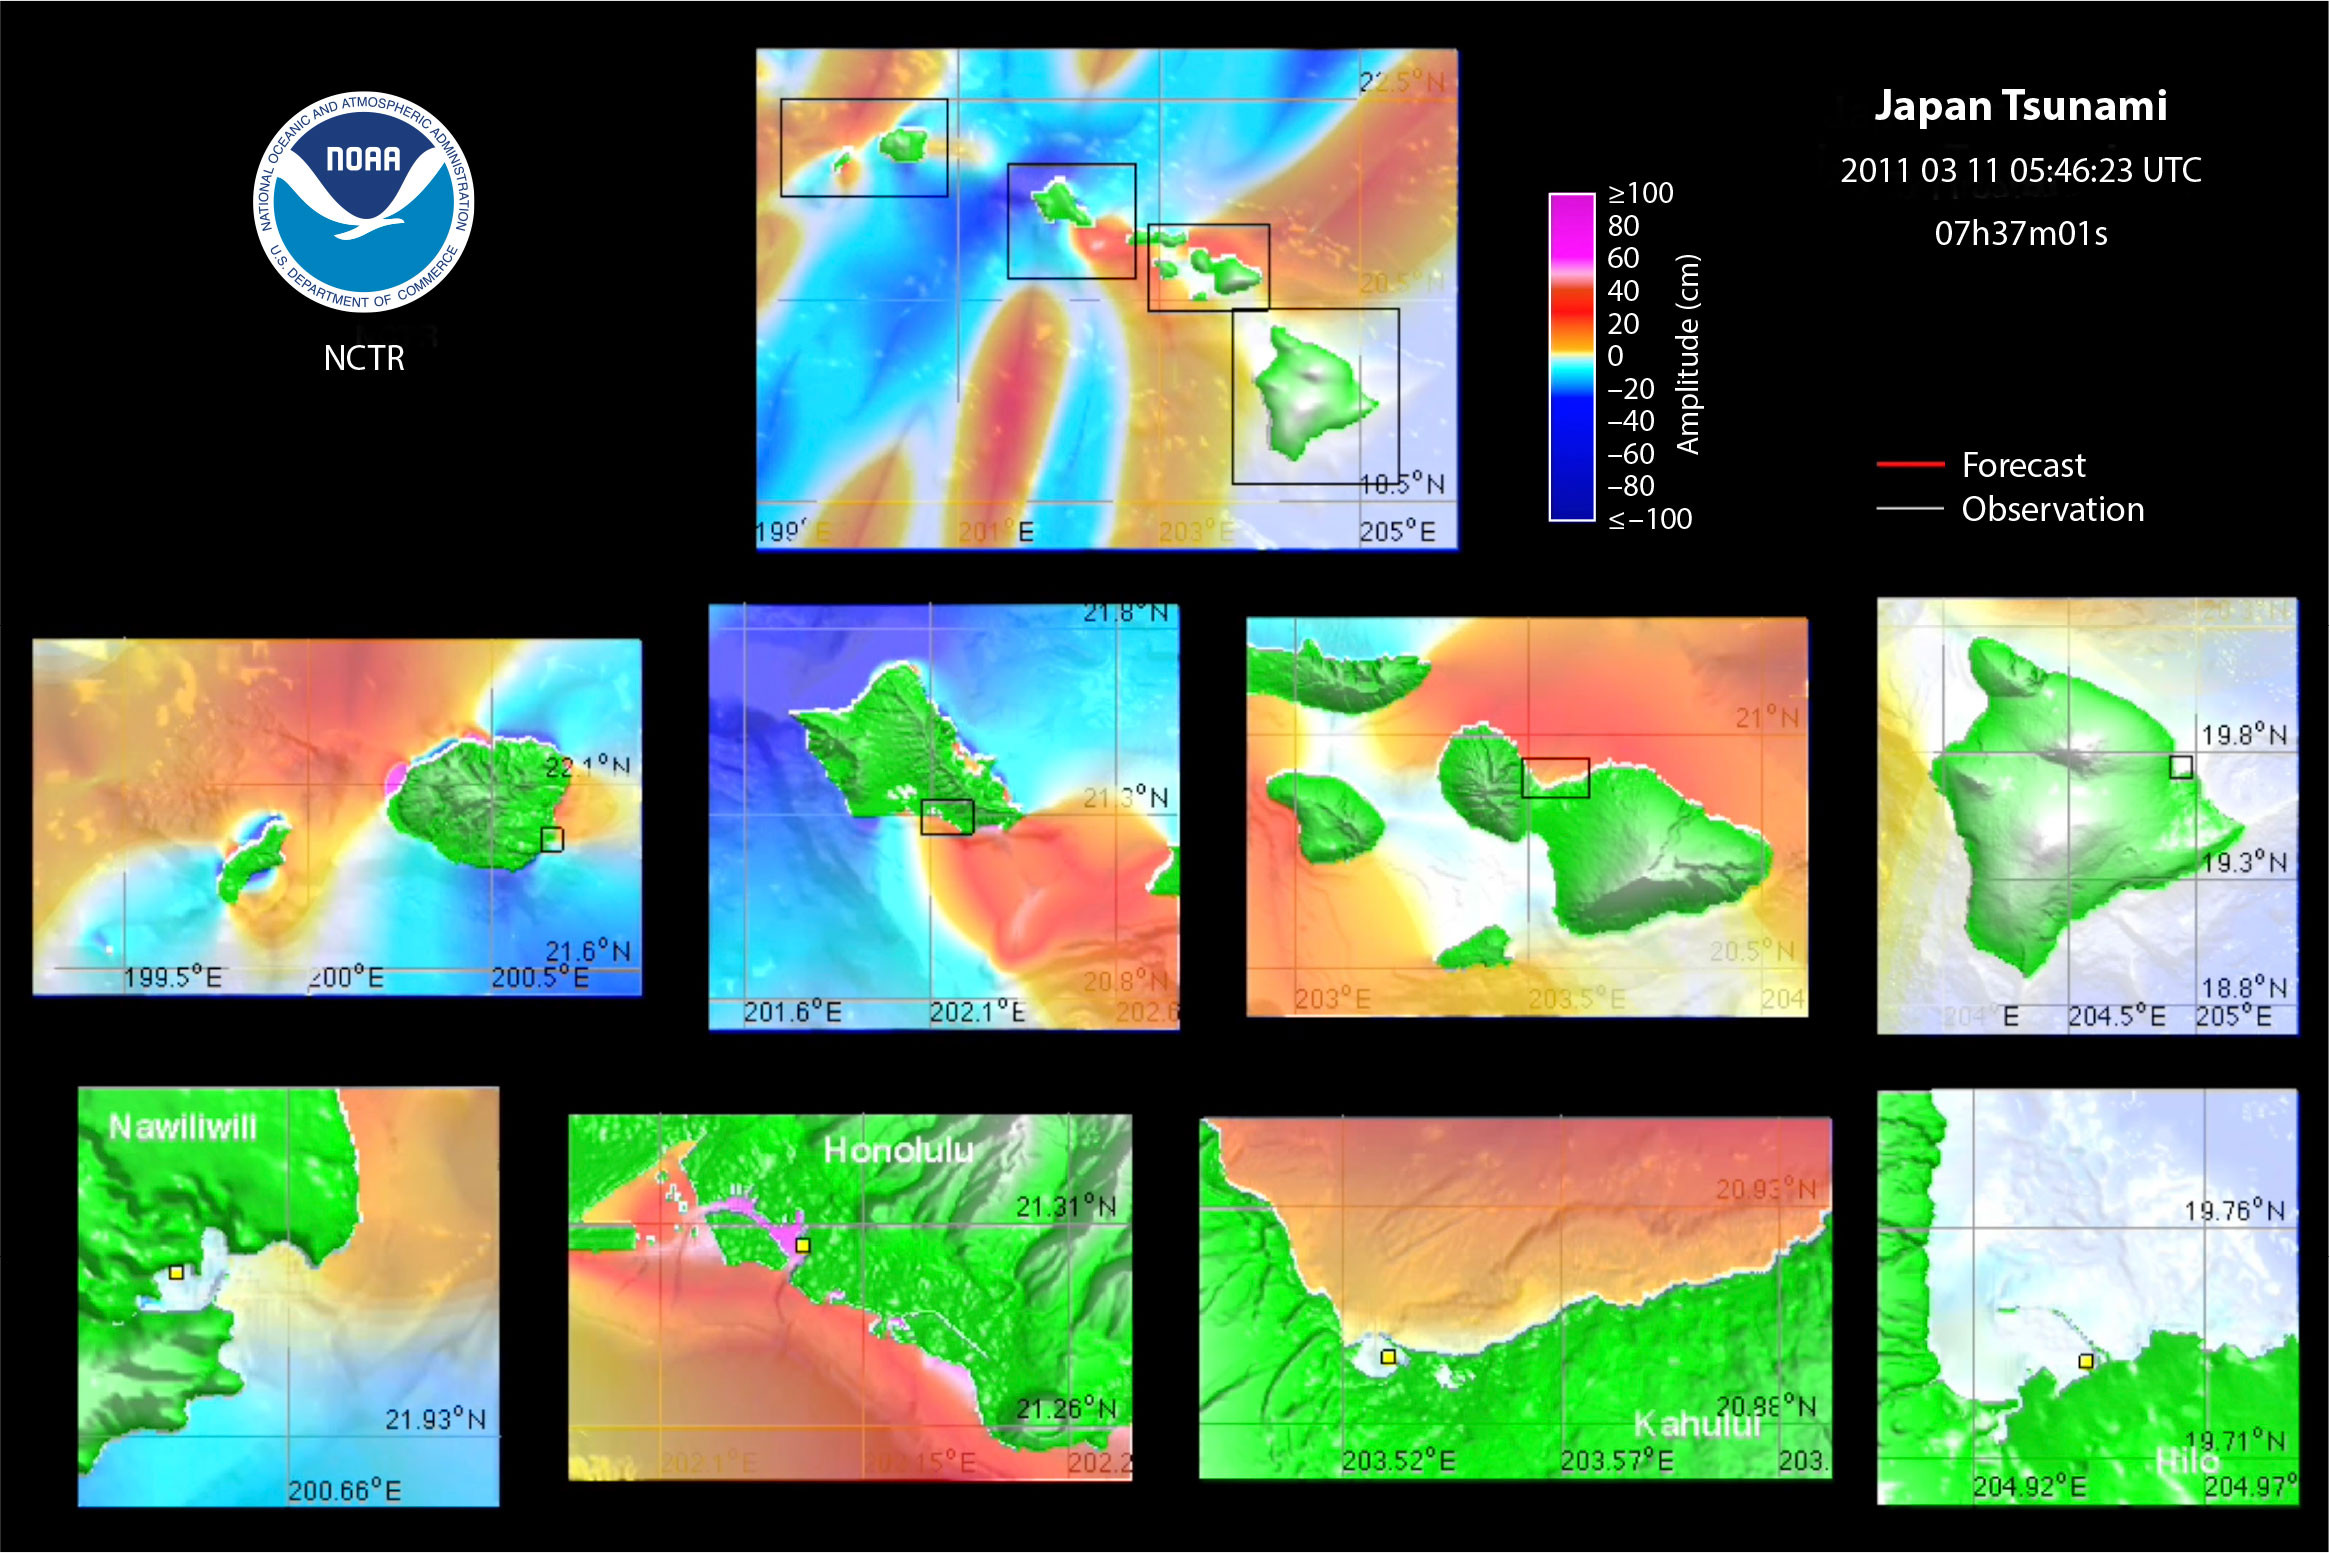
FIGURE 6. Telescoping grids were used to forecast tsunami flooding in Hawai‘i from the 2011 Japanese tsunami six hours before arrival using DART data. From Tang et al. (2012). > High res figure
|
The flooding model is the core tsunami forecast tool, as described in detail in Titov (2009). A forecast scenario consists of a propagation model that provides input for coastal inundation models for specific portions of coastlines. The propagation model combines precomputed propagation simulations (referred to as unit sources) to minimize the differences between actual DART measurements and model scenarios. Each unit source is a simulation of tsunami propagation from a particular source of M 7.5 along major known tsunamigenic areas around the world (Gica et al., 2008). Over 2,000 such propagation runs are stored in PMEL’s database, and the actual flooding forecast is produced using a nonlinear inundation model at high resolution. Nearshore tsunami dynamics and overland flooding are estimated through modeling a set of grids telescoping from the propagation runs of ~7 km resolution into the inundation model resolution of ~50 m.
After the 2004 Indian Ocean tsunami killed nearly a quarter million unwarned coastal residents, NOAA began to implement PMEL flooding forecast capabilities into operational tsunami warning systems. The flooding model became the core component of NOAA’s operational forecast system. Developing codes that run on demand under the pressure of tsunami warning operations is quite different from traditional model development and application in tsunami research. An operational model must provide accurate, robust, and rapid results with minimal interaction from forecasters. Tang et al. (2009) discuss these challenging and conflicting requirements for operational flooding forecasts, and Kânoglu et al. (2015) describe the methodology. The next 10 years of model advancement were focused on increasing robustness, accuracy, and development of site-specific models for the most vulnerable US coastal communities.
Tsunamigenic earthquakes offer large-scale experiments that provide source information and tsunami measurements for model validation. The full US array of 39 DARTs was completed in 2008 (Figure 3). Since 2003, there has been at least one DART record for every measurable tsunami. The earthquake location and the DART data provide the necessary information to produce a tsunami coastal impact forecast (Wei et al., 2008). Hence, every tsunami detected by the DARTs post-2003 has been analyzed using PMEL’s flooding model to continuously validate the model’s performance.
The March 11, 2011, Japanese tsunami created devastation in Japan and panic throughout the Pacific. During this tsunami, the PMEL model was used to produce the first real-time tsunami flooding forecast for US Pacific coastal communities. This pan-Pacific propagation computation was available about 90 minutes after the earthquake, using two DARTs (one American-owned and one Russian-owned) that recorded the initial half-wave period of the evolving tsunami. The propagation forecast was used to set initial conditions for high-resolution flooding model runs for 32 coastal communities in the United States and resulted in warnings for and evacuations in Hawai‘i (Tang et al., 2012). The forecast of flooding in Hawai‘i was confirmed by later observations and surveys, showing that the modeling forecast of tsunami flooding had become a reality (Figure 6). It was further reinforced by PMEL’s post-event model validation of the tsunami waveforms and inundation along Japan’s coastlines (Wei et al., 2013). The flooding forecast predicted tsunami amplitudes over 2 m at several locations along the US West Coast. However, the West Coast was spared from flooding by a significant low tide at the time of maximum tsunami wave arrival. The capability to linearly combine the tidal model and the flooding forecast model input is now implemented into the operational model. The PMEL flooding modeling system was successfully transferred to NOAA’s tsunami warning centers in 2013 (see Titov et al., 2023, in this issue, for details).
Long-Term Assessment
Deterministic Method
A deterministic inundation hazard assessment first acquires predefined tsunami source(s) that are deemed worst-case scenarios for the site based on historical accounts, paleo-geological records, and simulation results if limited historical data exist. PMEL pioneered the deterministic approach for assessing tsunami inundation hazards for US coastlines utilizing state-of-the-art numerical codes. In 2000, PMEL started to apply numerical models to map tsunami inundation in Puget Sound resulting from crustal faults in the Pacific Northwest. For a long-term inundation mapping project, Titov et al. (2003) established the PMEL standards and procedures, data sources, and mapping products that formed the fundamental criteria for development of the short-term inundation models. PMEL has been a partner with Washington Geological Survey in developing tsunami inundation maps for coastal communities in the state of Washington. PMEL was also involved in numerous tsunami inundation mapping and hazard assessment efforts for California, Hawai‘i, Oregon, Guam, and Pacific islands, and for critical infrastructures such as the Nuclear Regulatory Commission (see the long-term deterministic sites in Figure 5). Most of these assessments were based on deterministic earthquake scenarios that may potentially yield the worst-case inundation at a site.
Probabilistic Method
Deterministic, scenario-based hazard assessment methods have the advantage of bracketing potential impact at a study site. Unlike the deterministic practice of “worst-case” scenarios, the probabilistic approach estimates “unexpected” tsunamis like the 2011 Japan tsunami (Kânoglu et al., 2015). For structures in a tsunami flooding zone, the probability of occurrence of a tsunami event is more crucial for their design specifications than a “worst-case” scenario. The Probabilistic Tsunami Hazard Analysis (PTHA), adapted from the Probabilistic Seismic Hazard Assessment (PSHA), assesses tsunami risks based on a reliability analysis that considers the uncertainty and variability of seismic events (Geist and Parsons, 2006). PMEL was one of the leading agencies to apply PTHA in inundation hazard assessment using numerical simulations (González et al., 2009). This pioneering work performed high-resolution modeling for a small number of source scenarios, with PSHA-defined return periods, to derive 100- and 500-year recurrence inundation at a study site. It considered the uncertainty due to different tidal stages and slip distribution for near-field sources.
Since the 2011 Japan tsunami, practical, probabilistic-based design standards have been applied to achieve greater resilience of critical and essential facilities, such as tsunami vertical evacuation structures and other multi-story building structures subjected to tsunami inundation (Chock et al., 2018). PTHA methods include (1) uncertain, unpredictable random processes like modeling errors, source geometry, and randomness of slip distribution, and (2) an incomplete understanding of natural processes such as fault segmentation, slip rate, and earthquake recurrence rate. The latter relies on the use of logic trees to express experts’ current understanding of earthquake processes. A rigorous PTHA thus generates thousands or more scenarios to represent full integration over earthquake magnitudes, locations, and sources. Through collaboration with the tsunami loads and effects subcommittee of the American Society of Civil Engineers (ASCE), PMEL developed a simplified, yet ASCE-compliant, approach method to model the probabilistic tsunami inundation for a study site. This approach first identifies the most hazard-contributing source regions for the study site, and then propagates the waves that match the PTHA amplitude exceedance rates offshore the study site for high-resolution inundation computation. During 2013–2015, PMEL developed Tsunami Design Zone (TDZ) maps for all coastlines of the five Pacific states for the ASCE tsunami provision (Wei et al., 2015). In the following years, PMEL continued probabilistic inundation modeling studies for many sites and coastlines globally (Figure 5), in collaboration with Department of State, the Navy, the state of Hawai‘i, and private sectors.
“Multiple generations of DART systems were developed using a rigorous testing process based on system requirements that enabled the PMEL tsunami modeling group to revolutionize the timeliness and accuracy of flooding predictions for vulnerable communities.”
|
Contribution of PMEL Tsunami Research
Scientific and Practical Outputs
There are many metrics in research to signify quality. For a federal research laboratory, three metrics are especially relevant: publications, patents, and awards. Publications are an indicator that the science is peer reviewed and shared with the scientific community. Publications are also a way for scientists, throughout the world, to build upon US investments, paving the way for accelerated advancements in tsunami research. Patents are a key indicator of innovation and relevance; they protect the US government’s use of its own intellectual property and discourage others from filing such patents. Patents also provide an income stream for PMEL through royalties. Awards are recognition that the research has value to NOAA, the nation, and internationally.
Publications
PMEL tsunami scientists have published over 322 peer-reviewed articles, technical reports, and conference proceedings that have appeared in the scientific literature, and they have served as editors of three books: (1) Tsunami Hazard (Bernard, 1991), (2) Developing Tsunami-Resilient Communities (Bernard, 2005), and (3) The Sea, Volume 15: Tsunamis (Bernard and Robinson, 2009). According to Google Scholar, these publications have been cited over 10,000 times in the scientific literature.
Patent/Trademark
PMEL has provided an exclusive license to SAIC for DART technology under US Patent 7,289,907 (issued in 2007 as “System for reporting high resolution ocean pressures in near real-time for the purpose of tsunami monitoring,” Christian Meinig, Scott E. Stalin, Alex I. Nakamura, Hugh B. Milburn). A Trademark for “DART Tsunami Technology” was registered in 2007, and SAIC license royalties paid to PMEL have totaled over $565,000.
Awards
PMEL tsunami research has received 20 major awards in recognition of outstanding research relevant to the United States and to Japan, with sponsors including three US Presidents, the US Senate, and the US Department of Commerce (DOC). The awards include four Gold Medals, the DOC’s highest award, and two Bronze Medals, and the following NOAA awards: Administrator’s Award, Technology Transfer Award, Gears of Government Award, Silver Sherman Award, Outstanding Scientific Paper Award, and Team Member of the Month Award. Additional honors include The National Academies Ocean Studies Board Thirteenth Annual Roger Revelle Commemorative Lecturer (Bernard, 2012), the Partnership for Public Service 2008 Service to America Medal, and The Tsunami Society Award. In 2016, Bernard received the inaugural Hamaguchi Award for Enhancement of Tsunami Resilience presented by Japan’s Ministry of Land, Infrastructure, Transport, and Tourism.
The combination of publications, patent, and awards clearly shows the quality of PMEL tsunami research and its impact on tsunami mitigation for the nation and the world.
Relevance
PMEL’s DART research and development led to technology transfer to NOAA’s National Data Buoy Center (NDBC), which now operates and maintains 39 buoys and serves as real-time data distributor for other nations. This technology was also patented and licensed by PMEL to meet the needs of the international community. DART licensee SAIC has manufactured over 60 buoys for eight different countries. PMEL’s tsunami flooding modeling research led to technology transfer to NOAA’s tsunami warning centers, NTHMP, and international tsunami preparedness communities. Short-term flooding modeling research was initiated at PMEL to improve NOAA tsunami warning operations to better serve US coastal communities. Because NOAA operations required validation of models, the transfer took years to complete. PMEL-developed web-based modeling tools ComMIT and Tweb provide fast development options for shared tsunami modeling, forecasting, and hazard assessment projects around the world. These tools have been used by hundreds of scientists for model development and by several countries for tsunami forecast development (Bernard and Titov, 2015). The same validated modeling technology was then used in long-term forecast modeling to produce hazard maps for coastal communities in the United States through the NTHMP and internationally through the IOC. Tsunami hazard maps are an essential first step in preparing a community for the next tsunami. Using these maps and other preparedness criteria, a community can become Tsunami Ready for the next event. Tsunami Ready has been adopted by the IOC as the global standard for preparedness for at-risk, populations. IOC efforts are underway to make all tsunami threatened communities “Tsunami Ready” by 2030 (ITIC, 2023).
In 2012, PMEL scientists joined the effort led by the ASCE to articulate the first national design criteria addressing tsunami load and effect on buildings, published in ASCE (2017) and later incorporated into the International Building Code. PMEL developed the first draft of probabilistically based TDZ maps for the US West Coast that are integrated into ASCE’s tsunami geodatabase (https://asce7tsunami.online/; Wei et al., 2015).
Performance
One performance measure is the expanded use of research products through technology transfers. A brief history of the transfer of DART and modeling technologies within and outside NOAA is detailed in Titov et al. (2023, in this issue). PMEL’s efforts in successfully transferring tsunami technology ranks research productivity at the highest level. These efforts have not only benefited NOAA operations in the creation of a tsunami flooding forecast capability but also the United States and the world as these technologies are applied to protect coastal communities with populations exceeding 890 million people (Reimann et al., 2023) from future tsunamis.
Conclusions and Future of Tsunami Research
The combination of publications, patents, and awards clearly demonstrates PMEL tsunami research capabilities and their significant impact on tsunami mitigation for the nation and the world. Further, NOAA’s tsunami flooding prediction capability, derived from PMEL research, will remain a substantial part of the world’s defense against future tsunamis.
The immediate next step is development of timely near-field warnings, available in 10 minutes or less after an earthquake stops shaking. Further development of DART 4G, designed to work in seismically active subduction zones, will allow detection of tsunamis closer to the source, enabling quicker warning. Preliminary tests of the near-field flooding forecast capability using the 2011 Tōhoku data and the 2015 Chile tsunami forecast (Tang et al., 2016) have already shown promising results. NOAA’s flooding model will further evolve in response to these new goals, and developments are under way to improve numerical efficiency, to implement more robust boundary conditions, and to include faster and more accurate forecasts, including tsunami induced currents in harbors. Artificial intelligence is being applied to NOAA’s forecasting capability to determine whether this technology can improve warning operations. NOAA’s tsunami flooding prediction capability, derived from PMEL research, will remain a substantial part of the world’s defense against future tsunamis.
Acknowledgments
We thank NOAA for 50 years of support. We also thank three anonymous reviewers for providing comments that improved the quality of this manuscript. This is PMEL contribution number 5474.