Introduction
Ocean heat content is markedly increasing as air-sea interaction transfers anthropogenic warming of the atmosphere into the water column. The ocean holds 93% of 1955–2010 anthropogenic heating (Levitus et al., 2012). Ocean uptake of heat depends on the difference between air and sea surface temperatures, as well as wind speed, both of which vary spatially and temporally in response to the many climate oscillations spanning a broad range of timescales. A key part of the ocean heat uptake occurs in the tropical Pacific Ocean, which varies in response to the El Niño-Southern Oscillation (ENSO; England et al., 2014) and longer-period oscillations such as the Pacific Decadal Oscillation (PDO; von Känel et al., 2017). During La Niña, sea surface temperatures (SST) in the central and eastern tropical Pacific Ocean are colder than during El Niño conditions. In addition, the trade winds are stronger during La Niña (England et al., 2014). These factors result in the Pacific tropical expanse being more effective at absorbing atmospheric heat, which attenuates atmospheric warming during La Niña conditions (Kosaka and Xie, 2013). The oceanic heat spreads both poleward and zonally into the Indian Ocean by way of the Indonesian Throughflow (ITF; Lee et al., 2015). Here, we use time-varying velocity and temperature profiles to investigate the inter-ocean heat flux of the ITF during the period 2004–2017 and the impact this exchange has on the heat inventory in the eastern tropical Indian Ocean (ETIO).
The ~15 Sv (Sv = 106 m3 s–1) of tropical Pacific water that the ITF advects into the ETIO (Gordon et al., 2010) spreads as a distinct low-salinity plume across the Indian Ocean within the 10°–15°S band (Gordon et al., 1997). The ITF plays an important role in the ocean-climate system (e.g., Schneider and Barnett, 1997; Sprintall et al., 2014) and affects Indian Ocean stratification (e.g., Song and Gordon, 2004; Feng et al., 2015; Liu et al., 2015).
Approximately 77% of ITF waters flow through Makassar Strait (Makassar throughflow of 11.6 Sv compared to 15 Sv total ITF outflow into the Indian Ocean measured in 2004–2006 during the International Nusantara STratification ANd Transport [INSTANT] program; Gordon et al., 2010). Makassar Strait transport, which has been monitored with some gaps in time from 1996 to 2017, displays seasonal and interannual fluctuations. The Makassar velocity profile exhibits a marked velocity maximum (V-max) within the upper thermocline. During the summer months (southeast monsoon), there is an increase in maximum velocity, while a decrease is evident during the beginning of the northwest monsoon (Gordon et al., 2008, 2012; Susanto et al., 2012). The velocity profile in Makassar Strait also changes with ENSO phase, with increased velocity within the warm upper thermocline during La Niña and reduced velocities during El Niño (Gordon et al., 2008, 2012). In addition to this shifting velocity profile, temperature within Makassar Strait also varies with ENSO. Ffield et al. (2000) compared XBT-based Makassar temperature at 100 m depth to Niño3 and Niño41 indices, finding correlations of −0.80, and −0.82, respectively (negative correlations indicate cooler temperatures and shallower thermocline during positive ENSO phase). Susanto et al. (2012) found a correlation between Makassar average temperature at 120–420 m depth and a Niño3.4 index of −0.78.
This ENSO dependence is linked to the movement of the North Equatorial Current (NEC) bifurcation, which shifts between 10°N and 15°N (Qiu and Chen, 2010). During El Niño, the NEC bifurcation shifts northward, increasing leakage from the Pacific through Luzon Strait into the South China Sea (SCS), which drives relatively fresh buoyant SCS waters through the Sulu Sea and into the Sulawesi Sea where they form a “freshwater plug,” inhibiting Makassar throughflow in the upper ~70 m (Qiu and Chen, 2010; Gordon et al., 2012, 2014). The reverse conditions are present during La Niña. Recent studies also show the importance of salinity in driving the ITF. Hu and Sprintall (2016) separated the effects of salinity on ITF transport and found a contribution to total variability of about 36%. Rainfall variability over the Maritime Continent may contribute significantly to these salinity changes, as Hu and Sprintall (2017) suggest that increased rainfall in this region leads to elevated ITF transport.
After passing through Makassar Strait, ITF waters exiting the Indonesian Seas are injected into the ETIO through three primary pathways: Lombok Strait, Ombai Strait, and Timor Passage. These three portals also exhibit strong seasonal and interannual variability (Sprintall et al., 2009). Using a numerical model, Song and Gordon (2004) show decreased SST in the ETIO when the Makassar ITF transport profile is altered within its observed range. Another model study by Lee et al. (2015) suggests that ITF effects may not be limited to the eastern Indian region. They show that increases in Makassar heat flux during the warming hiatus are reflected in increasing heat content in the upper 700 m of the Indian Ocean. Furthermore, a variable ITF has the potential to affect the Atlantic Meridional Overturning Circulation (AMOC). In two more model simulations, Durgadoo et al. (2017) propose that 45% of Agulhas leakage waters originate from the ITF, and Le Bars et al. (2013) conclude that the Agulhas leakage increases by 3 Sv when the ITF is present compared to a closed Indonesian Seas scenario.
Longer time series of Makassar throughflow data collected in 2004–2011 and 2013–2017 during the NSF-supported INSTANT and NOAA-Ocean Climate Observations (OCO) Monitoring Indonesian Throughflow (MITF) programs now allow for more detailed investigation of the ITF that can help validate these model simulations and provide an observation-based foundation for further study of how ITF variability can affect the Indian Ocean and climate.
As noted above, in this study we consider the heat flux anomaly (HFa) within Makassar Strait calculated using observed time-varying velocity and temperature profiles. We compare the Makassar HFa time series to the heat content anomaly (HCa) within the ETIO as observed by Argo floats.
Makassar Data
Velocity
Velocity measurements were recorded by moored acoustic Doppler current profilers (ADCPs) deployed within the 45 km wide Labani Channel located at 2.86°S, 118.62°E in Makassar Strait during 1996–1998, 2004–2011, and 2013–2017 as part of the Arlindo, INSTANT, and MITF NOAA-OCO programs, respectively (Figure 1; Gordon et al., 2008, 2012). For this study, data from 2004 onward are considered, as earlier measurements only capture velocities above 400 m, and we seek to investigate heat flux above the sill depth (values to 740 m are used to encompass the sill depth of 680 m) in the southern Makassar Strait. For the 2004–2017 time period, velocity measurements were interpolated to hourly intervals at 20 m depth levels from 40 m to 740 m. Velocities were only available below 40 m. For the surface layer, the velocity measurement at 40 m was applied. This is one of four methods for extending velocity measurements from the topmost measurement to the surface described in Vranes et al. (2002). The method used here is less likely to systematically over- or underestimate surface layer velocities than linear extrapolations to the surface described in the other three methods. The Labani Channel axis is aligned at a slight angle from due south at ~170°. The along-axis velocity, marking the Makassar Strait throughflow, was determined from the geographic zonal and meridional speed rotated counterclockwise by 10° (as in Gordon et al., 2008; Susanto et al., 2012; Figure 2). In order to remove tidal fluctuations and reflect the same temporal resolution as Argo data used in the ETIO region, the final along-channel velocities were averaged monthly.
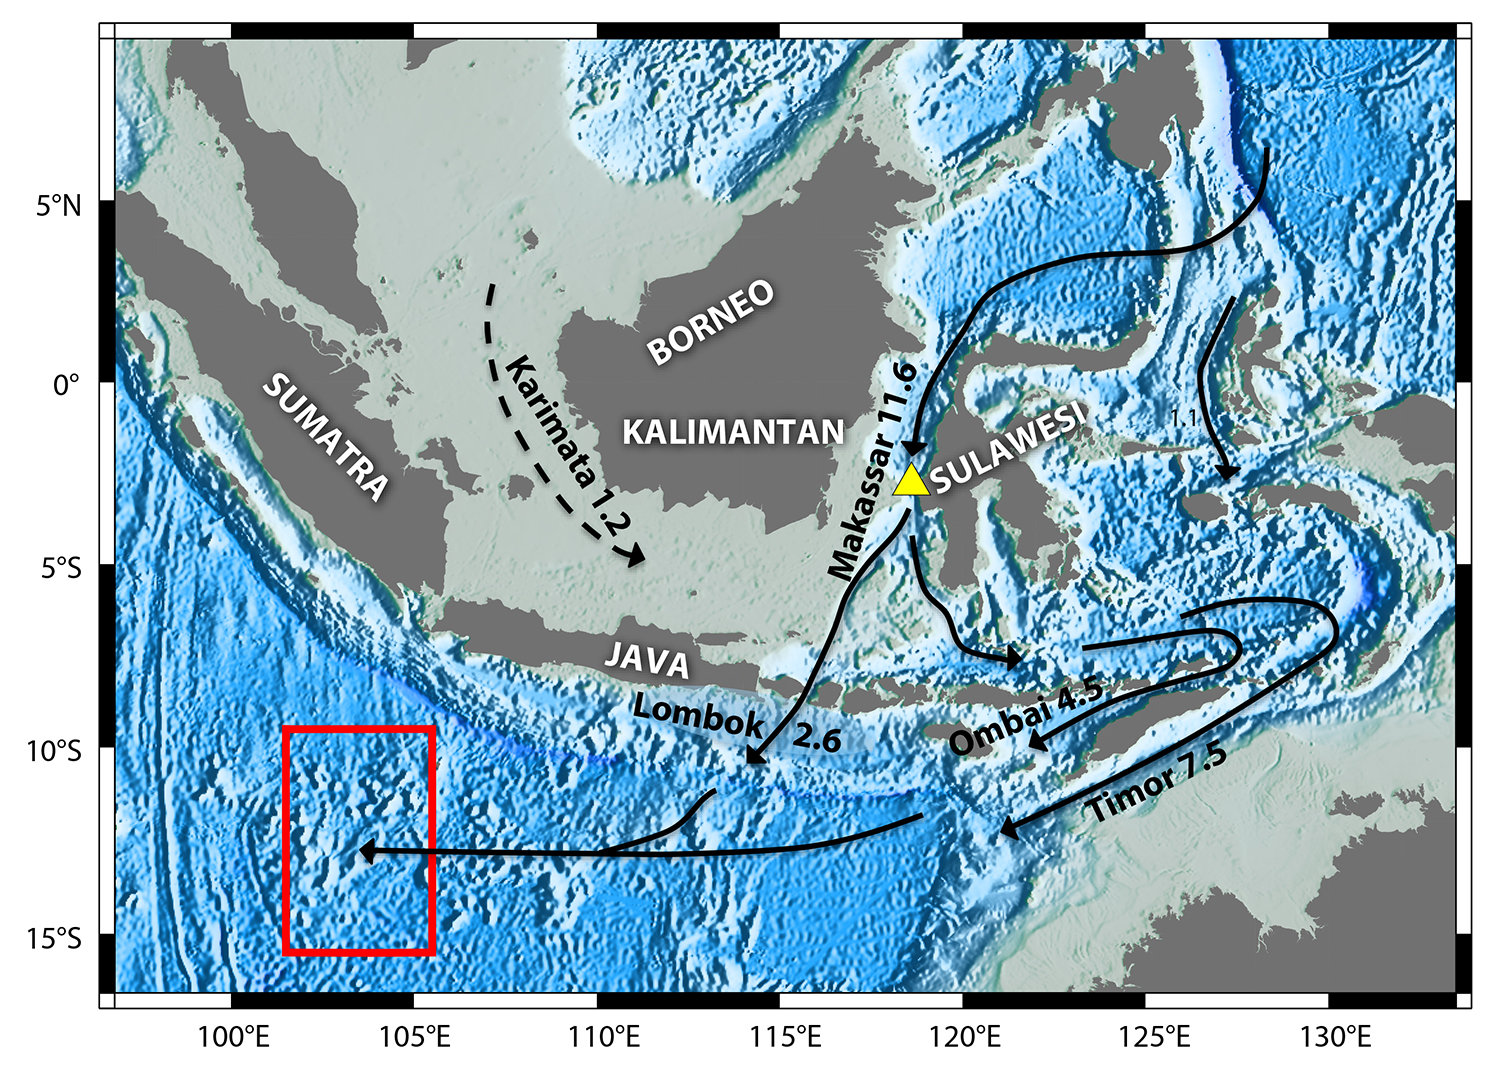
Figure 1. The Makassar Strait and eastern tropical Indian Ocean (ETIO) outflow region. The mooring location within Labani Channel is indicated by the yellow triangle. The ETIO box bounded by 101.5°E–105.5°E and 9.5°S–15.5°S is shown by the red rectangle. Arrows indicate the pathway of Indonesian Throughflow (ITF) waters, starting at the Pacific inflow and finishing in the ETIO box. Volume transports during 2004–2006 in Sv (106 m3 s–1) from the International Nusantara STratification ANd Transport (INSTANT) program (Gordon et al., 2010) are indicated at each passage, and the dashed line shows Karimata transport (Fang et al., 2009). > High res figure
|
Temperature
To ensure capture of the full variability in Makassar heat flux anomalies, variability in temperature profiles, as well as velocity profiles, must be addressed. A deeper thermocline during La Niña will strengthen the established pattern of shallower, faster velocities (increased heat flux), with opposite conditions during El Niño. Estimates of ITF heat flux calculated using continuous in situ temperature data are only possible for 2004–2006. Using a climatology temperature profile for the remaining velocity time series, 2006–2011 and 2013–2017, could underestimate (overestimate) heat flux during La Niña (El Niño), thus decreasing heat flux variability. To capture the increased variability in Makassar heat flux, this study uses in situ temperature data combined with the Niño3.4 climate index to approximate temperature profile variability.
To investigate the changes in the temperature profile in Makassar Strait during different ENSO stages, 50 CTD profiles from seven Makassar Strait cruises spanning 1993–2017 were used in combination with continuous temperature profiles collected from 2004 through 2006 as part of the INSTANT program. Additional temperature data from the World Ocean Database, including from nine CTDs, 26 ocean stations, 89 profiling floats, 37 mechanical bathythermographs, and 358 expendable bathythermographs (Boyer et al., 2013) were also used. The ENSO phases were determined by the Niño3.4 climate index (NOAA, 2017).
Following the ENSO phase, temperature profiles were coded as negative (La Niña), neutral, or positive (El Niño), depending on the date the measurement was taken. Negative was defined as Niño3.4 less than −0.5, neutral as between −0.5 and 0.5 inclusive, and positive as greater than 0.5. During 2004–2006, continuous temperature profiles were recorded, though due to mooring movement, many values in the surface layer could not be used. These data were collected every six minutes and averaged into daily intervals. In order to determine shallow temperatures, SST from the NOAA Optimally Interpolated SST (OISST) data set (Banzon et al., 2016) were used for the same time period. These daily data are at 0.25° resolution, and the grid box that encompassed the mooring site was used for all further calculations. At each time step in the 2004–2006 Makassar temperature time series, an associated SST was appended to the top of the profile. A piecewise cubic interpolation was used to interpolate between the surface and the uppermost measurement. The three ENSO phase temperature profiles were created using a bootstrap approach. For each of the three profiles, a temperature profile was chosen at random from all available temperatures (266 for negative, 374 for positive, and 952 for neutral), recorded, and then placed back into the pool of available temperatures. This process was repeated 10,000 times for each ENSO phase. Figure 2 shows the resulting mean profiles. A temperature time series for 2004–2017 was created by applying each representative profile to the ENSO phase recorded in the Niño3.4 index. Although this method seeks to improve heat flux calculations made using a climatology temperature profile, it is limited by a lack of continuous temperature data over many ENSO cycles. Because of this, we are unable to determine how developing and decaying phases of ENSO may affect the Makassar temperature profile differently.
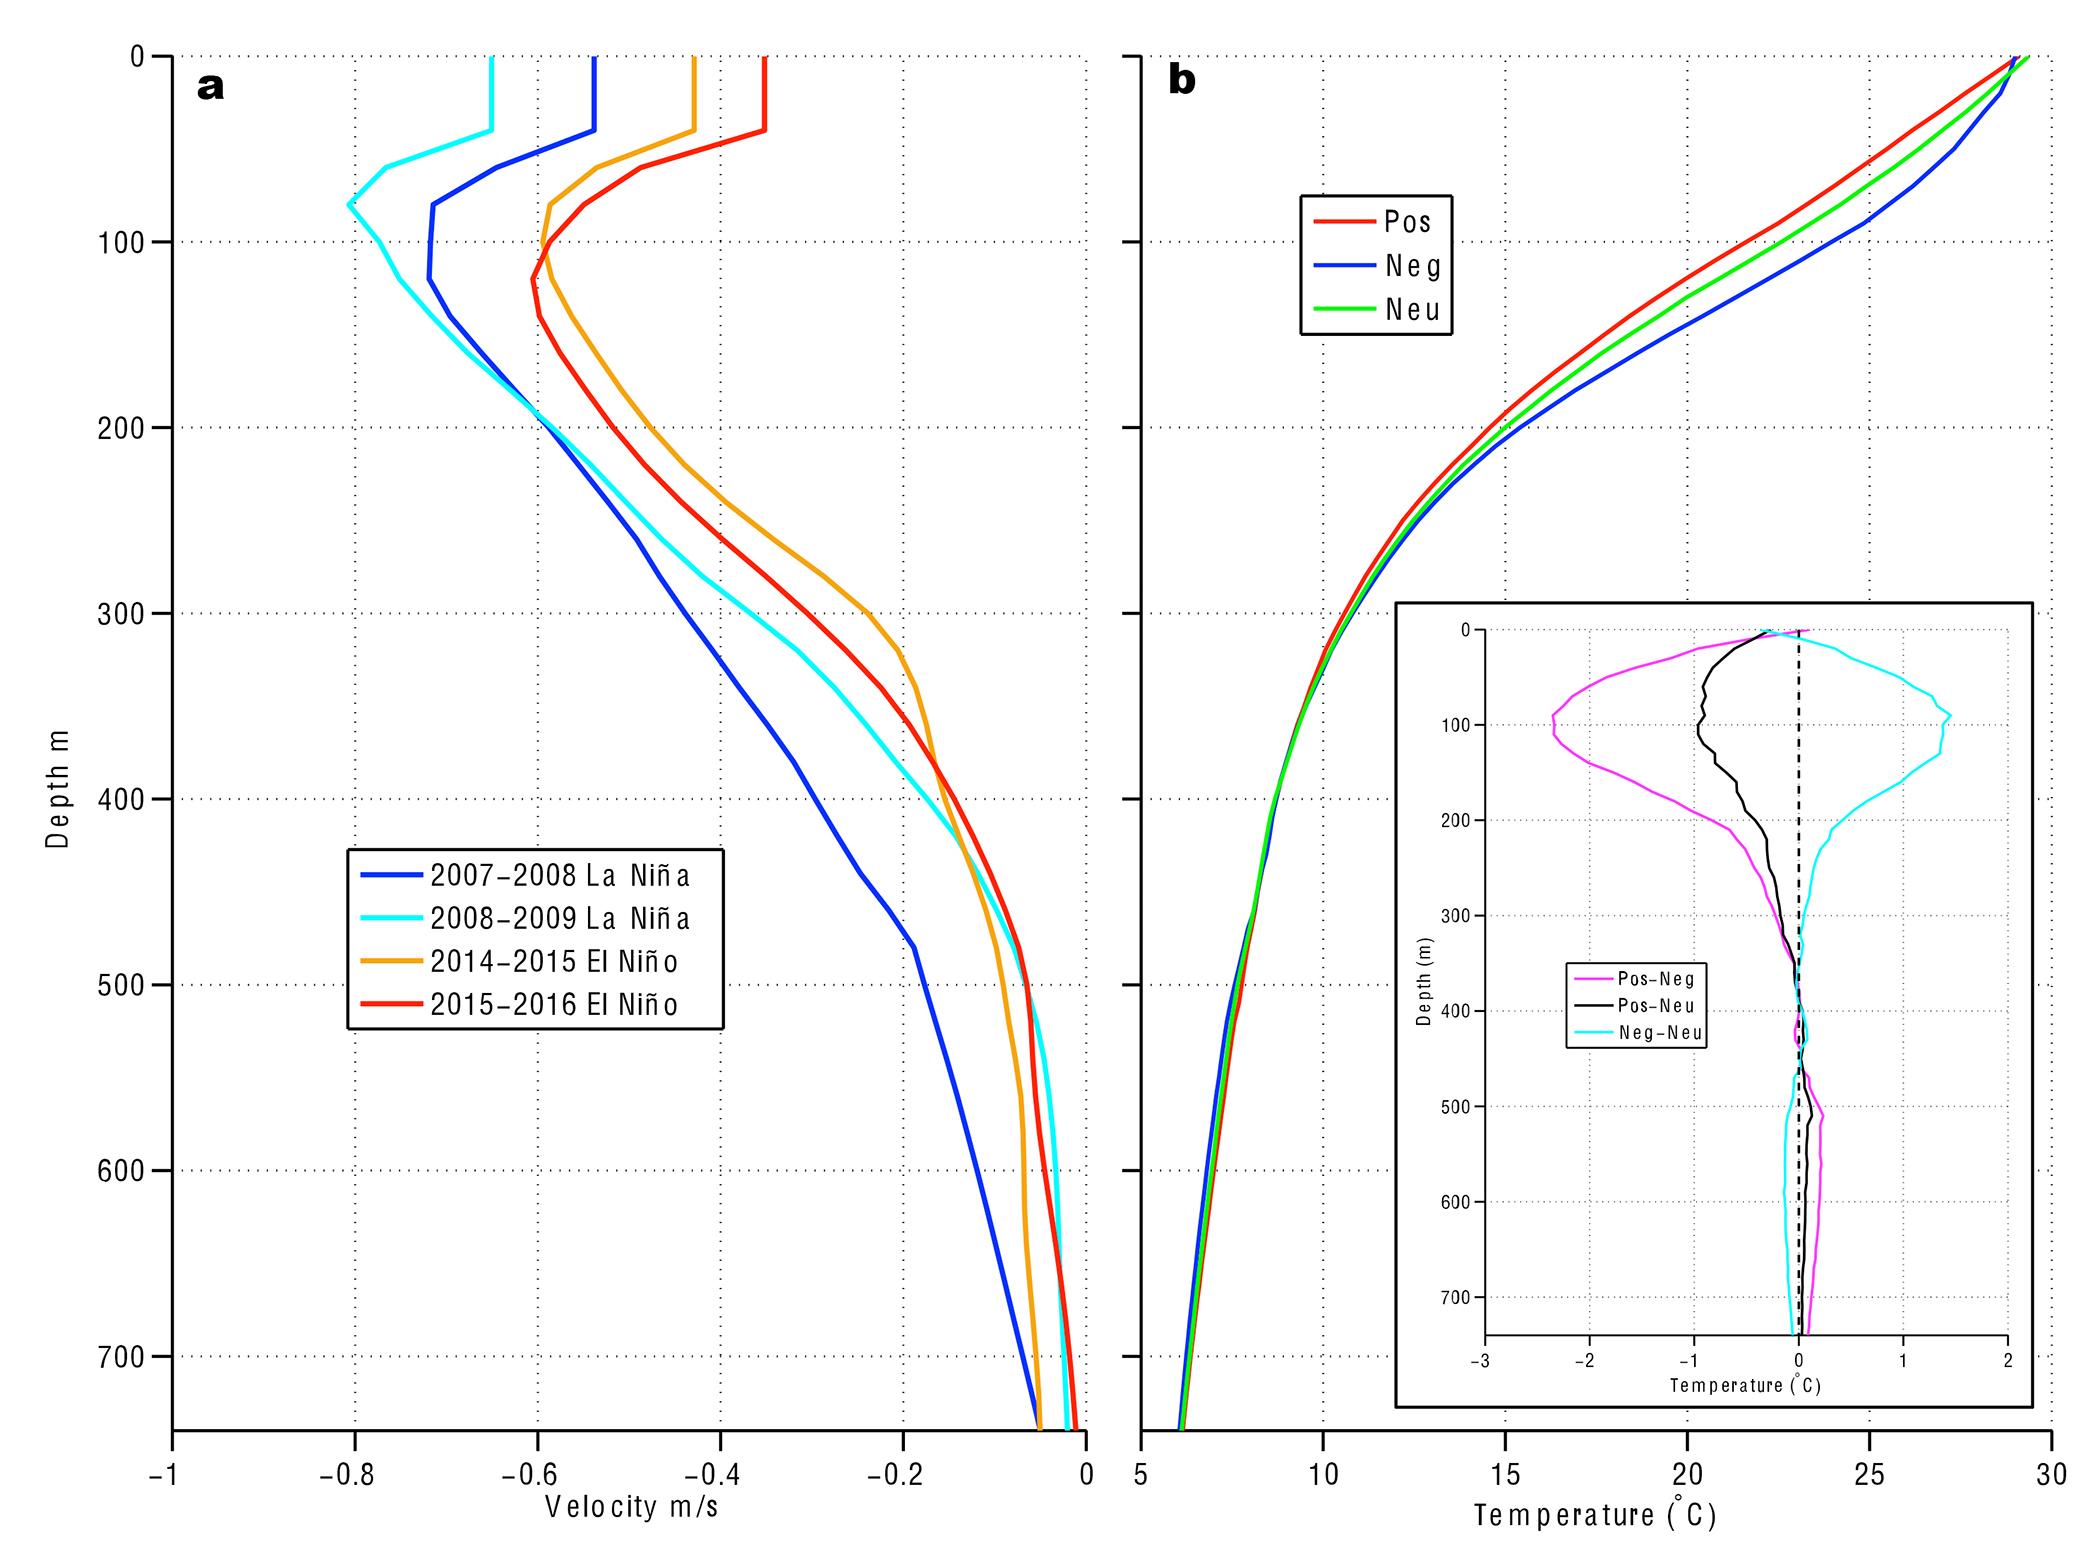
Figure 2. Makassar velocity and temperature profiles. (a) Averaged Makassar velocity profiles July–June for four years, two representing La Niña years (dark blue, 2007–2008; light blue 2008–2009), and two representing El Niño years (orange, 2014–2015; red, 2015–2016). Negative velocity indicates southward flow. During La Niña (El Niño) years, the velocity maximum is larger (smaller) and occurs at shallower (deeper) depth. (b) Makassar temperature profile composites for El Niño (red), La Niña (blue), and neutral (green). Deepening of the isotherms from approximately 10 m to 350 m depth is present during La Niña, with the opposite during El Niño from 0 m to 380 m depth. (inset) Positive El Niño-Southern Oscillation (ENSO) phase temperature profile minus negative profile (purple), positive minus neutral (black), and negative minus neutral (blue). The largest temperature differences are in the surface and the thermocline, with negative (La Niña) temperatures 2.4°C warmer than positive (El Niño) temperatures at 90 m depth. > High res figure
|
Results and Discussion
ENSO-Based Temperature Reconstruction
Figure 2 shows representative profiles for each of the ENSO states. Significant differences are evident, especially within the thermocline. The expected pattern is present, with a shallower thermocline during El Niño and a deeper one during La Niña. Positive ENSO events are linked with cooler temperatures (compared with neutral conditions) from 0 m to 380 m, with a maximum cooling of 1.0°C at 110 m depth. Negative ENSO events are associated with warmer temperatures (compared with neutral) from 10 m to 350 m, with a maximum warming of 1.5°C at 90 m depth. La Niña conditions reflect warmer temperatures than El Niño conditions from 10 m to 370 m depth. The largest temperature difference between profiles occurs within the thermocline at 90 m depth where the positive profile is 2.4°C cooler than the negative profile.
Heat Flux/Heat Content
Heat flux was calculated in Makassar Strait using velocity profiles described above combined with the ENSO-based temperature time series described above. Heat flux was calculated as

where ρ is a mean density profile, v is the along-channel velocity profile, A is the cross-sectional area of the depth bin at the mooring location determined from a combination of observed bathymetry recorded during the Labani Channel mooring rotation of 2009 and Smith and Sandwell (1997) topography (http://topex.ucsd.edu/marine_topo/), Cp is the specific heat of seawater estimated here as 4,000 J kg–1 °C–1, θ is time varying temperature profile determined in the above temperature section, and θref is a reference temperature.
Vranes et al. (2002) provides mean Makassar heat flux estimates using five different reference temperatures. The results have a range of 0.18 PW. Understanding the difficulty in choosing an appropriate closure point for our system, we use a reference temperature of 0°C and only consider heat flux anomalies to alleviate inconsistencies in reference temperature choice. These values in the heat flux equation are multiplied together and integrated over the 0–740 m layer at each one-month time step. The mean heat flux was subtracted from each data point in the time series to create a heat flux anomaly time series. A 13-month running mean was applied to remove the seasonal cycle and identify interannual variability and long-term trends.
The heat content was calculated for a region of the ETIO, a box bounded by 101.5°E–105.5°E and 9.5°S–15.5°S inclusive. The ETIO box represents the furthest west portion of the ITF outflow area identified by Andersson and Stigebrandt (2005) termed the “downstream buoyant plume.” As we investigate the effects of the ITF on the Indian Ocean, we choose to examine this box, as it is already known to contain ITF water (Gordon et al., 1997) and provides the most direct connection back to Makassar Strait. The most westward portion of this box was chosen as a way to avoid shorter-term variability that may arise from Makassar water exiting through the three main export passages at various times and rates (Sprintall et al., 2009, discuss these exit passages in detail), and to avoid regions of coastal upwelling. Ideally, an investigation of heat content along the entire path Makassar water travels through the Indonesian Seas and into the ETIO would be performed, but we are limited by the lack of continuous observations. The Argo profiler data set used here does not resolve the Indonesian Seas. The ETIO box we have chosen balances proximity to the ITF outflow area with sufficient data coverage. Heat content was calculated using a gridded 1° × 1° monthly Argo data set (2005–2017) from the Asia Pacific Data Research Center (2017). The following equation was used to determine heat content:

where ρ is a mean density profile, Cp is the specific heat of seawater estimated here as 4,000 J kg–1 °C–1, and is θ is temperature. In order to focus on subsurface variability, heat content within the mixed layer was not included in the total heat content. Argo-based mixed layer depths (mld) were provided by the Asia Pacific Data Research Center (2017). These values were multiplied together and integrated over the bottom of the mixed layer through the 740 m layer at each one-month time step. The mean was subtracted from the resulting data set to examine only anomalies, and a 13-month running mean was applied to the time series.
The heat content anomaly in the ETIO box is a continuous monthly data set from 2005 to 2017. The Makassar heat flux anomaly time series is continuous from 2004 to 2011 and 2013 to 2017, with data missing for much of 2011 and 2013, and all of 2012. We sought to patch this gap before comparing these two data sets. The heat flux anomaly in Makassar Strait is well correlated with the 0–740 m depth volume transport anomaly, with an R-value of 0.76 (Figure 3). Li et al. (2018) produce a reconstructed 0–300 m Makassar transport from 1948 to 2016 using Pacific zonal wind speed square anomalies in a neural network framework. When the same 13-month running mean is applied to the 0–300 m Makassar transport anomaly from Li et al. (2018), it is well correlated (R = 0.82) with the 0–740 m transport anomaly observations during their overlapping time period (2004–2011, 2013–2016). Similarly, this reconstruction is well correlated with the observed heat flux anomaly during the overlapping time period (R = 0.72). As the Li et al. (2018) 0–300 m transport represents the observed transport variability quite well, and both the observed and reconstructed transports track the heat flux anomaly, we use the Li et al. (2018) 0–300 m reconstruction to fill in the 2011–2013 heat flux anomaly gap. The mean ratio of observed heat flux anomaly to reconstructed 0–300 m Makassar transport anomaly from 2004–2011 and 2013–2016 was calculated (0.18 PW Sv–1). For each missing month of data from 2011 to 2013, the reconstructed 0–300 m Makassar transport anomaly was multiplied by the ratio to create a heat flux anomaly estimate that was used to fill in the gap (see green line in Figure 4).
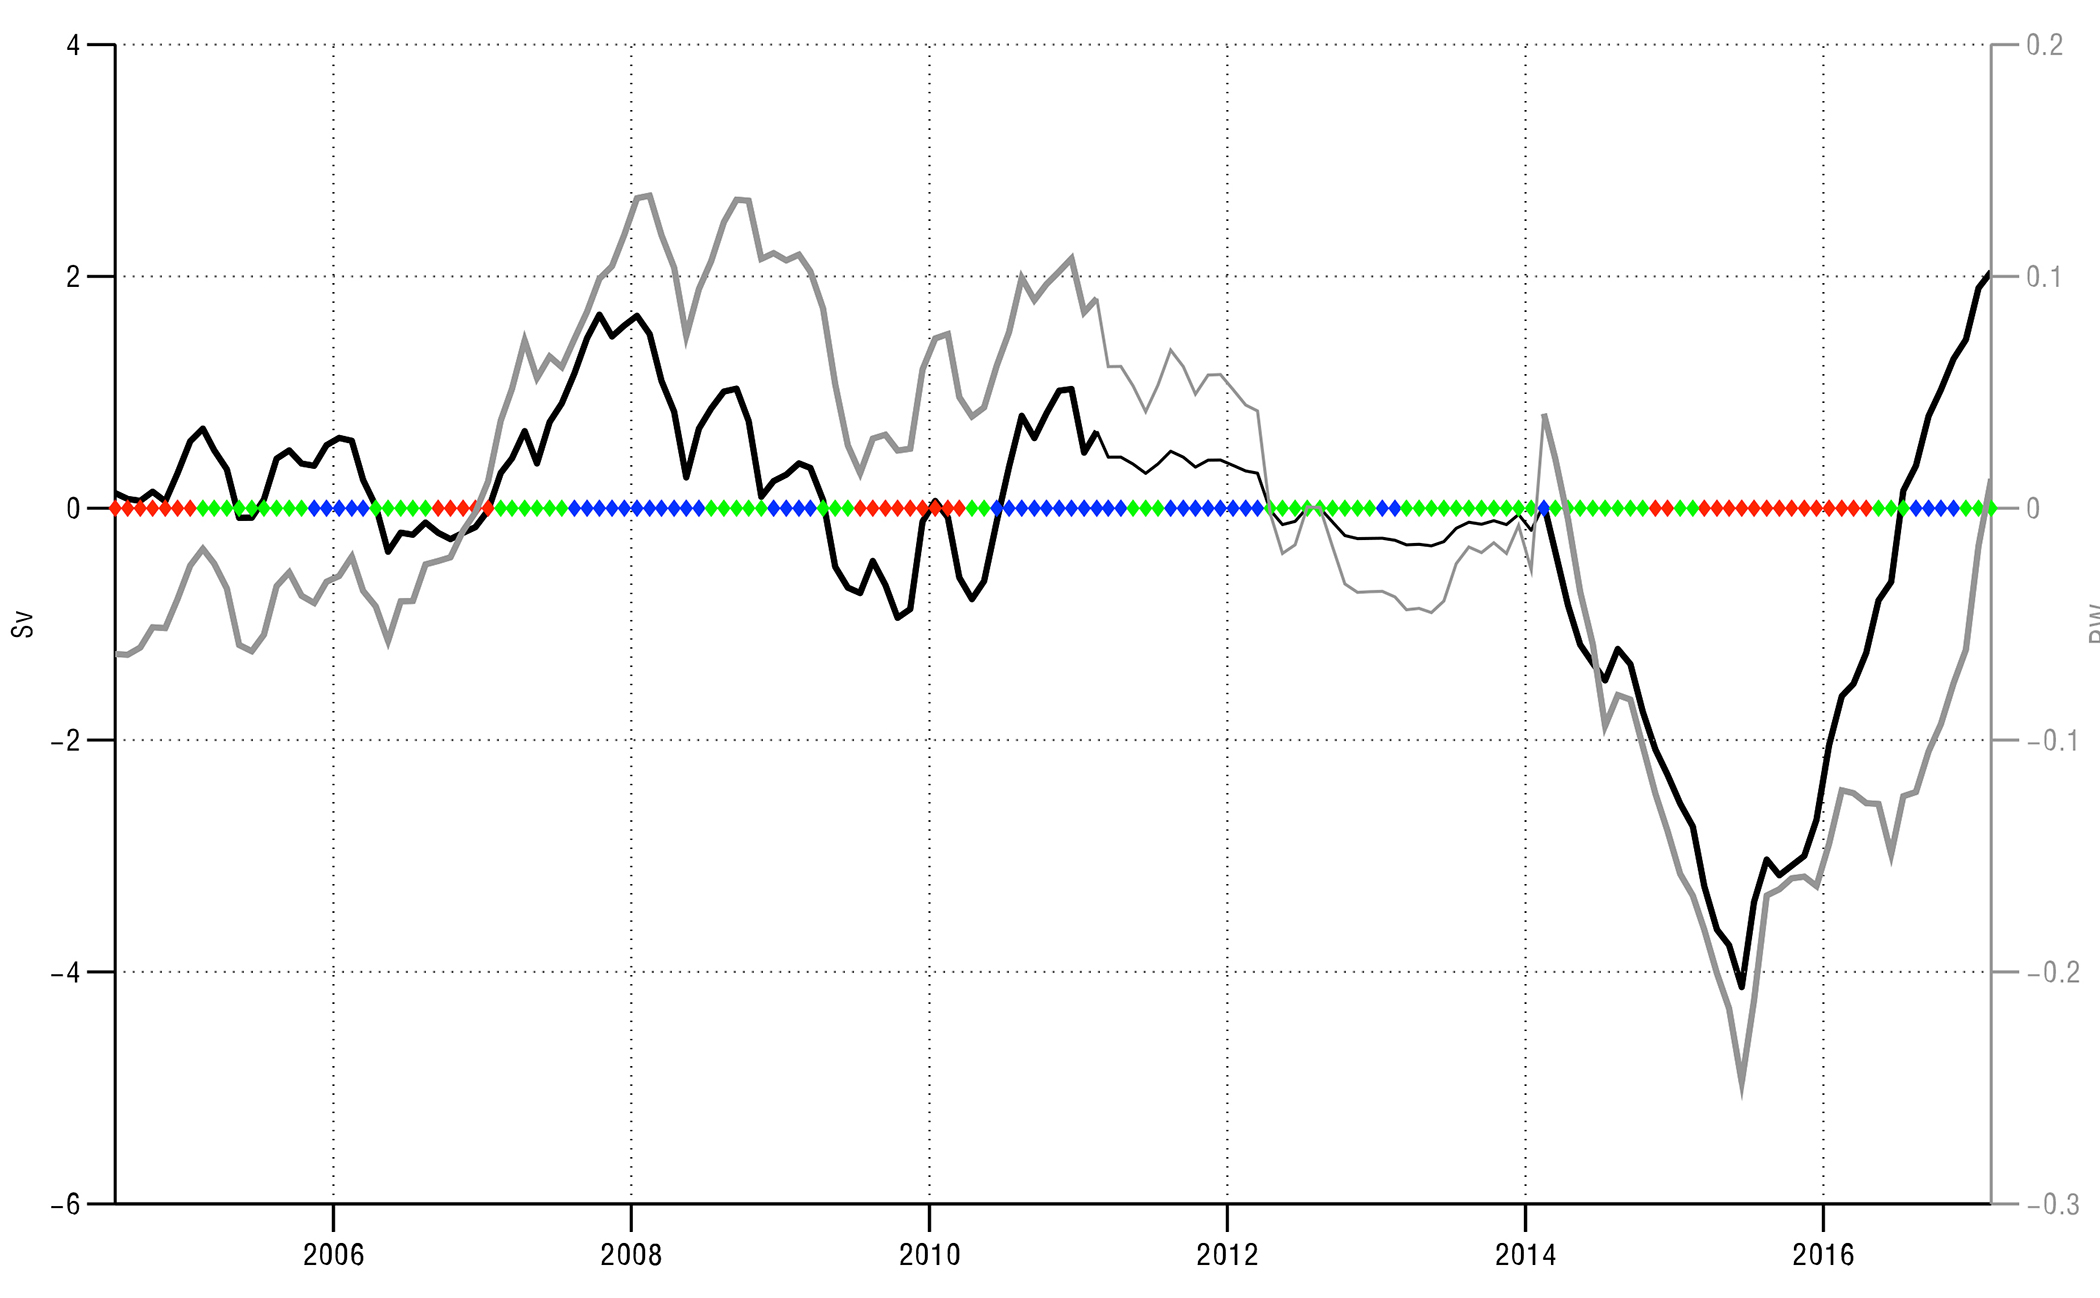
Figure 3. Makassar Strait transport anomaly (thick black line, Sv = 106 m3 s–1) and heat flux anomaly (thick gray line) from observations. Transport and heat flux estimations determined using Li et al. (2018) are shown in the thin black line and the thin gray line, respectively. Time series are shown with a 13-month running mean. Positive values indicate increasing transport or heat flux to the south. The correlation coefficient between these two time series is 0.76. Although the volume transport is important in driving the heat flux anomaly, it is not the sole factor determining heat flux anomaly (HFa) variability. The ENSO phase from Niño3.4 (NOAA, 2017) used to the construct temperature profiles is shown in red (positive), green (neutral), and blue (negative) markings along the zero anomaly line. > High res figure
|
Makassar to ETIO Comparison
Although about 77% of the total ITF waters flow through Makassar Strait (Gordon et al., 2010), no continuous long-term measurements of the major exit passages exist. Here we consider how the outflow region in the ETIO would be affected by changes in Makassar Strait.
A time-varying cross correlation is applied to the Makassar heat flux anomaly time series and the ETIO box HCa. At a time step of zero, the ETIO box time series and the Makassar time series both begin in January 2005. The ETIO box time series is shifted back at one-month intervals and an associated correlation is calculated; for example, the second correlation would be calculated with the ETIO box time series beginning in January 2005 and the Makassar in December 2004. In this manner, the time lag between the Makassar heat flux anomaly events and potentially connected ETIO HCa changes is lengthened with every consecutive correlation calculation. The significance of the correlations was determined using the bootstrap approach described by Martinson (2018). Due to the application of the 13-month running mean, the first and last six months of data from each time series were removed before performing the correlations.
Makassar Heat Flux and ETIO Heat Content
Figure 4 shows the Makassar heat flux anomaly time series. The time series shows large seasonal variability, with an average difference between minimum boreal winter heat flux south and maximum summer heat flux south of 0.65 PW. This is a result of the seasonal nature of the Makassar volume transport, which is characteristically greatest during summer months and weakest during winter (Susanto et al. 2012). Following the application of the 13-month running mean to remove the seasonal cycle, the maximum heat flux anomaly south is 0.13 PW during February of 2008, and the minimum is −0.25 PW during June 2015 (with positive values indicating increasing heat flux southward). The heat flux anomaly is very highly correlated with the volume transport anomaly (R = 0.76; Figure 3). This volume transport explains approximately 57% of the variance in heat flux anomaly, indicating that the variability in the temperature and velocity profiles also significantly affects the heat flux anomaly. To determine the impact of the velocity and temperature profiles, heat flux was calculated twice more, once using a mean velocity profile and variable temperature profile, and once using mean temperature and variable velocity profiles. These new heat flux estimates indicate that changes in the velocity profile account for 72% of the variance in total heat flux, whereas the temperature profile changes only account for 28%. During La Niña, the velocity maximum shallows, the maximum speed increases, and the isotherms deepen, increasing both the amount of water flowing through the channel and the temperature of that water. The opposite happens in El Niño.

Figure 4. (top) Heat flux anomaly in Makassar Strait, 2004–2017. Monthly means (gray), 13-month running mean (black), portion removed before correlation (purple), and gap filled using heat flux anomaly to volume transport anomaly ratio and Li et al. (2018) 0–300 m transport (green). Positive values indicate increasing heat flux anomaly south. A large seasonal cycle is clearly visible in monthly means. The maximum southward heat flux is 0.13 PW during February 2008, and the minimum is −0.25 PW during June 2015. (bottom) Heat content anomaly in the ETIO box plotted from Argo data collected from 2005 to 2017: monthly means (gray), 13-month running mean (black), portion removed before correlation (purple). Maximum heat content anomaly of 0.3321 J occurs in July 2010 and minimum of −0.2621J happens in December 2006. > High res figure
|
Figure 4 displays the ETIO box heat content anomaly. Similar to Makassar heat flux, the ETIO box heat content anomaly also exhibits a seasonal cycle. This seasonal cycle shows larger values during austral summer and smaller values during late winter. The average difference between summer and winter heat content is 0.9721 J. After the 13-month running mean is applied, the heat content anomaly within this box reaches its maximum of 0.3321 J during July 2010 and the minimum of −0.2621 J during December 2006.
The best correlation between the Makassar HFa and the ETIO box HCa is R = 0.83, with a p-value of 10–4 at a lag of 30 months (Figures 5 and 6). This is indicative of an advective signal, with Makassar waters winding their way through the Indonesian Seas and exiting into the ETIO approximately 2.5 years later. Although this lag may be somewhat variable due to recirculation by eddies and uncertain residence time in the Banda Sea, it is notable that the 30-month lag is consistent with a model-based study by Song et al. (2004), which suggests it takes fewer than four years for Makassar waters to reach the outflow region, including the ETIO box. This indicates the importance of Makassar Strait throughflow in defining the water mass characteristics of ITF outflow waters. Although not all entry and exit passages of the ITF are consistently actively monitored, ITF effects on the Indian Ocean can still be identified using Makassar Strait data. Both model- (van Sebille et al., 2014) and observation-based (Ffield and Gordon, 1992; Ilahude and Gordon, 1996) studies show the majority of water traveling through Makassar Strait is of North Pacific origin. The work of van Sebille et al. (2014) shows that the majority of water exiting through Lombok Strait, Timor Passage, and Ombai Strait are derived from Makassar Strait, and that ITF waters crossing 110°E retain a distinct core of North Pacific waters between the 15°C and 25°C isotherms. Although there is mixing of South and North Pacific waters within the Indonesian Seas, the South Pacific contribution is smaller (Ffield and Gordon, 1992) and more concentrated in the lower water column (Huatala et al., 1996; Ilahude and Gordon, 1996).
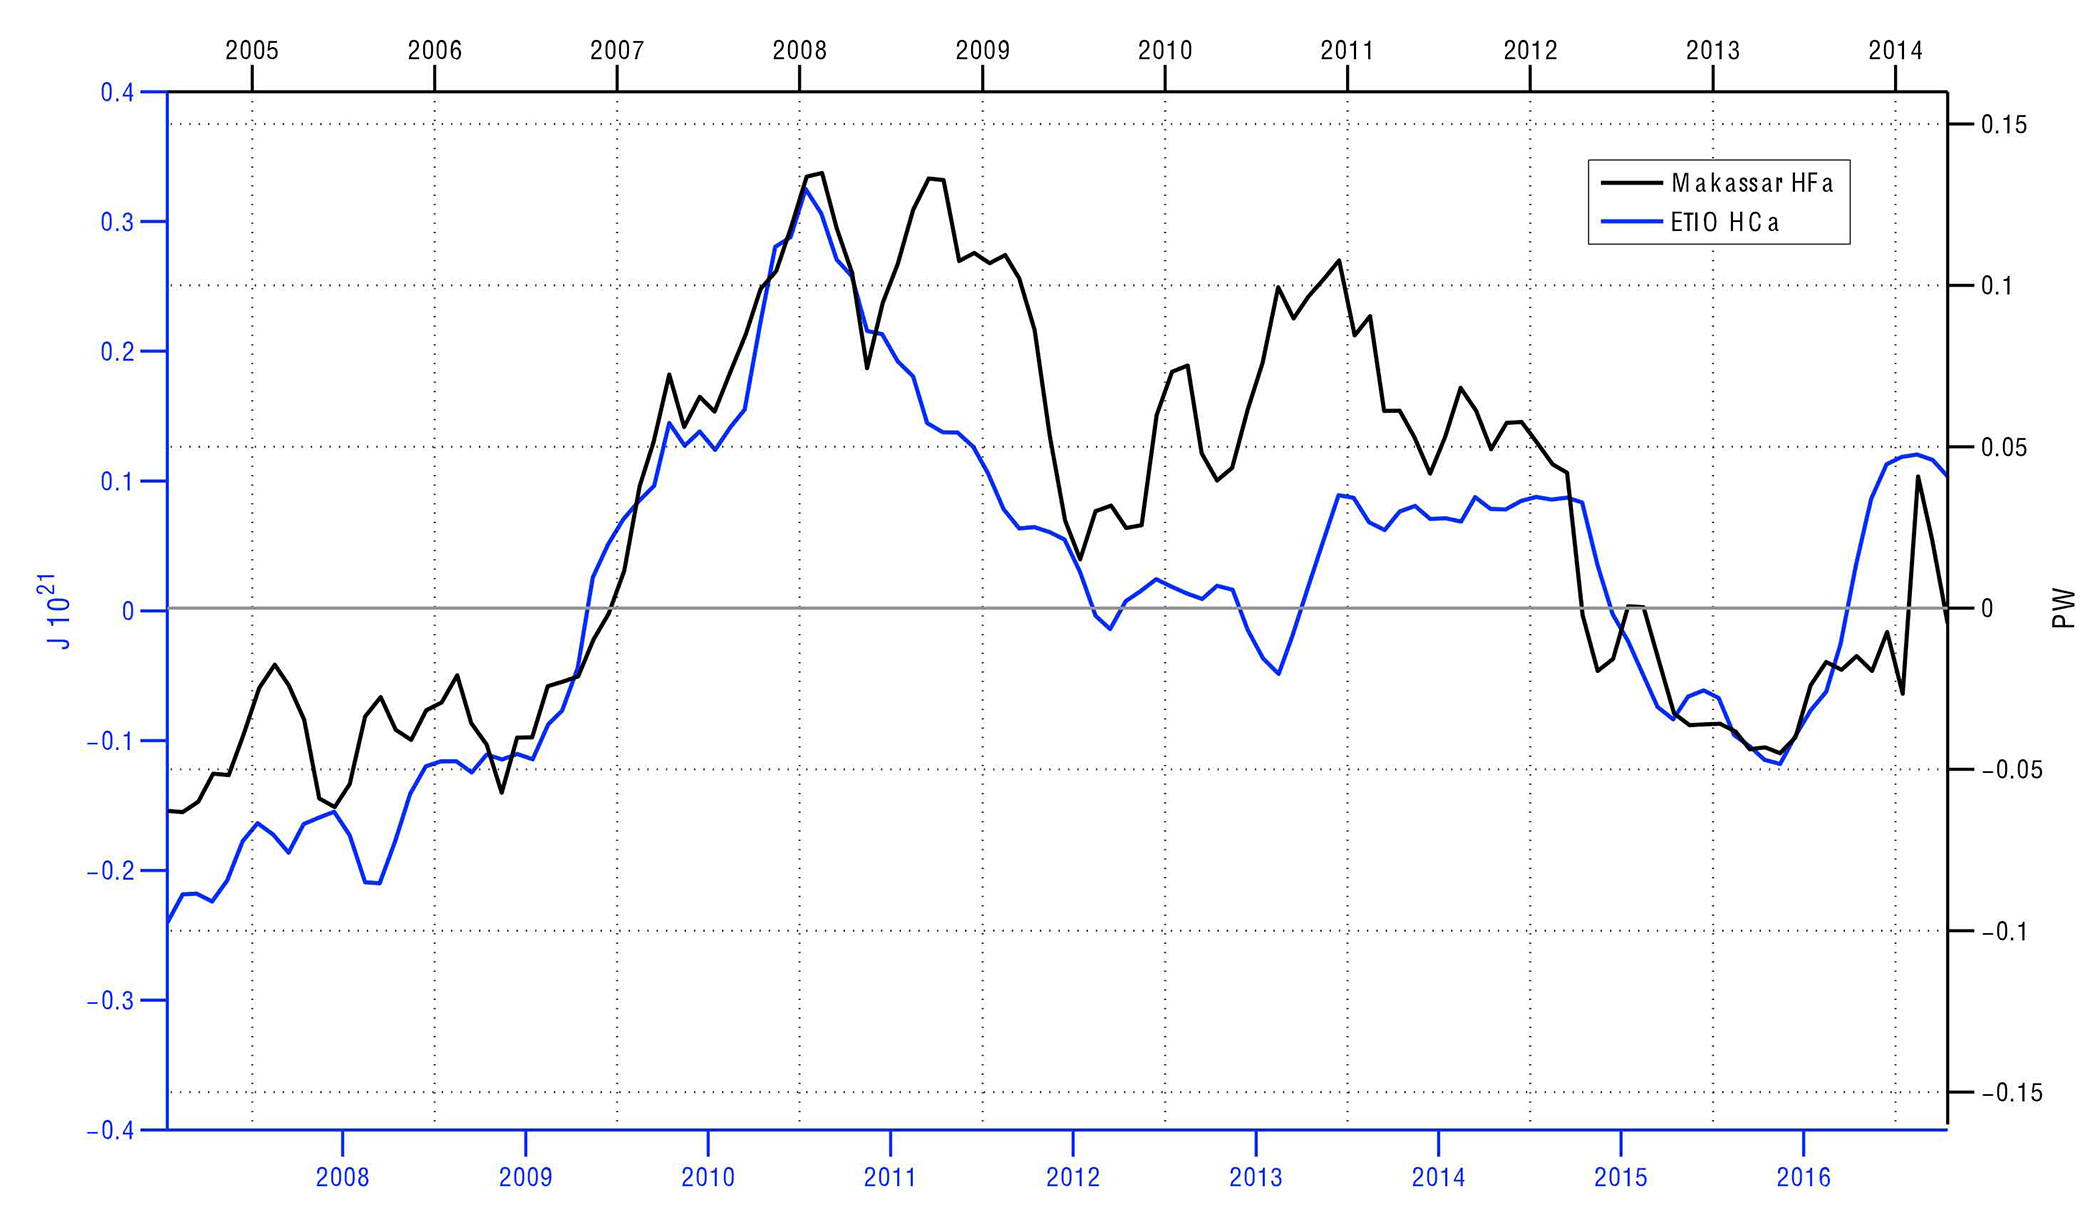
Figure 5. Heat flux anomaly in Makassar Strait (black) and heat content anomaly in ETIO box (blue) are shown with ETIO box time series lagged 30 months behind the Makassar time series. Values indicating increased Makassar HFa to the south are positive. The correlation coefficient is 0.83. Both data sets show increases between 2006 and 2008 (using black axes) followed by a negative trend continuing through 2013. > High res figure
|
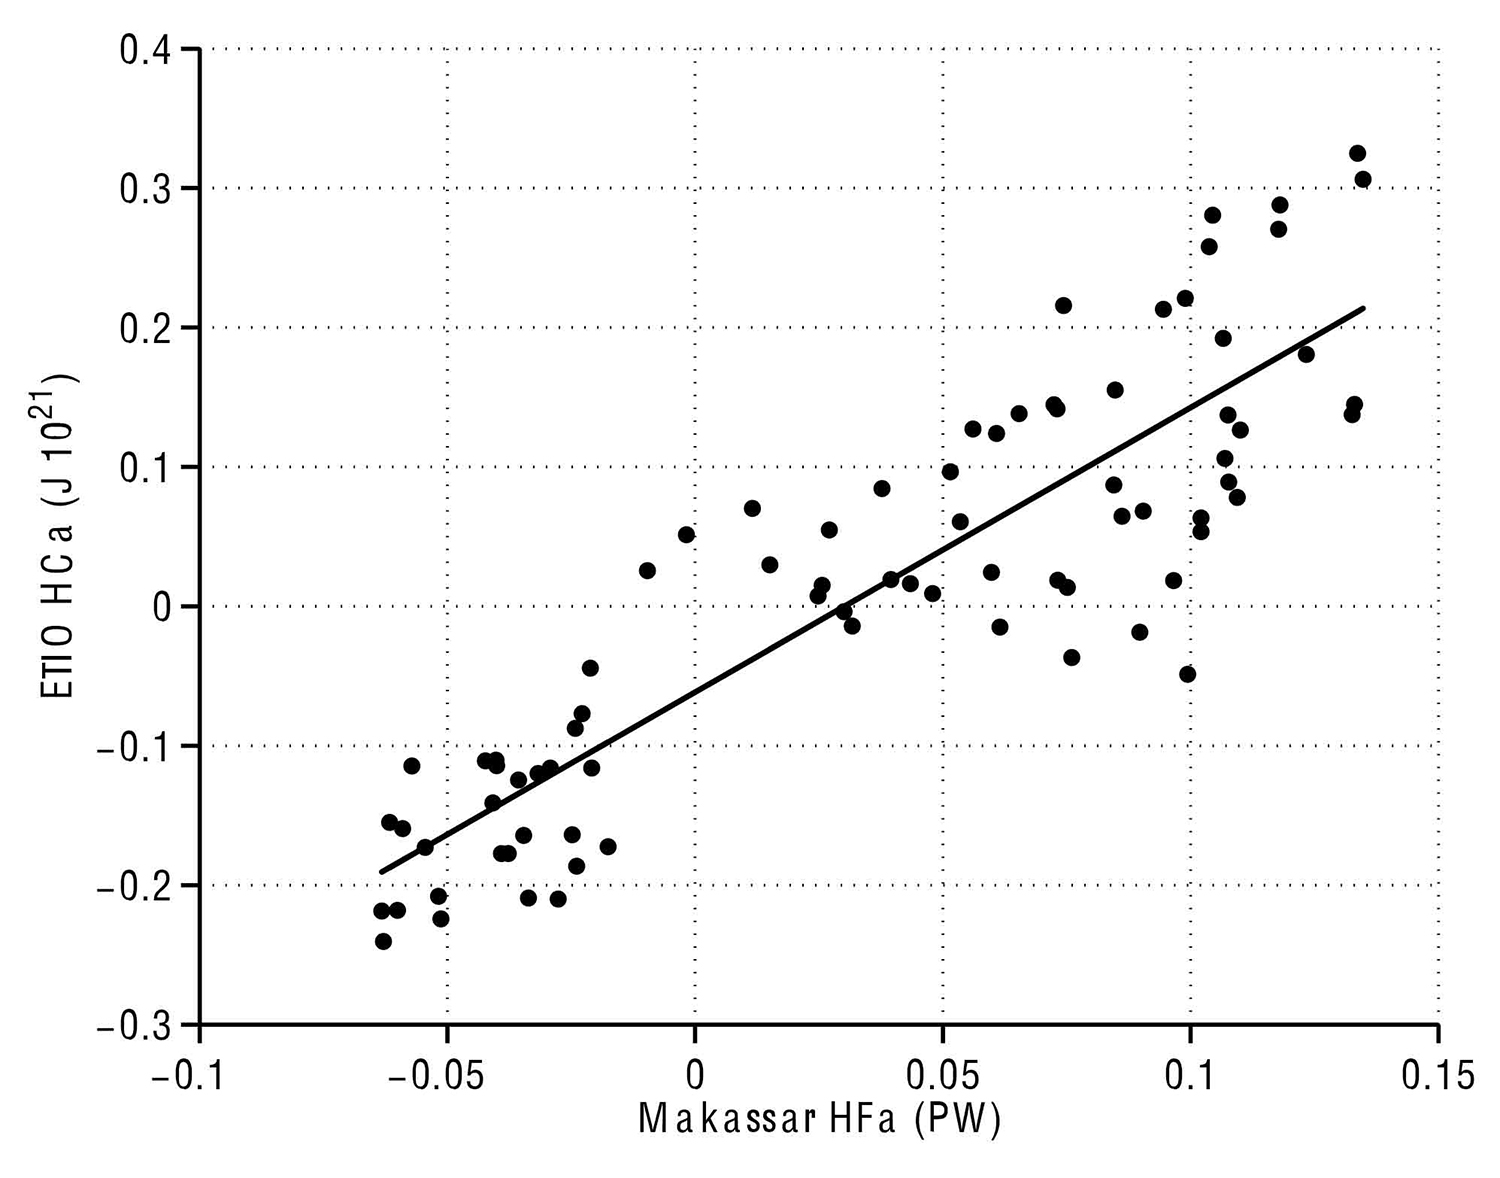
Figure 6. Heat flux anomaly in Makassar Strait plotted against 30-month lagged heat content anomaly in the ETIO box. R2 = 0.69. Positive Makassar HFa values indicate increasing Makassar HFa southward. > High res figure
|
When ETIO box HCa is compared with the Indian Ocean Dipole (IOD) Mode Index, there is a significant correlation of −0.37 (higher HCa during a negative IOD), indicating that the IOD explains about 14% of ETIO HCa variance. Although the IOD may influence the inter-ocean pressure gradient that drives the ITF (Yuan et al., 2011), its importance to interannual trends in ETIO HCa is minimal when compared to the advective signal from Makassar Strait.
A large discrepancy between Makassar HFa and ETIO HCa occurs during 2012/2013 (Figure 5, blue axes). This could have many causes, including changes in residence time of water within the Banda Sea and alternate trajectories for ITF waters in the ETIO. Work in progress suggests the latter, with the potential for a southern pathway for ITF waters within the ETIO. It is expected that further from this immediate outflow region, the advective signal may not be as well defined. But results from Lee et al. (2015), in which a model showed increasing heat flux through Makassar Strait followed by increased heat content (0–700 m depth) in the Indian Ocean, provide reason to believe that Makassar heat flux variability may significantly affect Indian Ocean heat content at greater spatial scales, especially when longer-term (multiyear) trends are considered. Sen Gupta et al. (2016) show a multi-model mean of 3.4 Sv reduction in ITF transport under the RCP8.5 climate change scenario. This could lead to a reduction of heat flux through Makassar Strait, a reduction of heat content in the ETIO, and, if persistent over multiple years, a reduction of upper water column heat content in the Indian Ocean.
Summary
The heat flux anomaly in Makassar Strait was determined using velocity profiles made from direct observations during 2004–2011 and 2013–2017, and an estimated temperature profile based on observed temperature during positive, negative, and neutral ENSO phases. The 2011–2013 gap was filled by calculating a ratio of heat flux anomaly to volume transport anomaly and applying this ratio to the reconstructed 0–300 m depth Makassar transport anomaly from Li et al. (2018). Variability in Makassar Strait heat flux is linked to changes in the velocity and temperature profiles in these waters, as well as the vertically integrated volume transport within Labani Channel. The ETIO box heat content anomaly was determined using Argo gridded data sets from 2005 to 2017. Both time series display seasonal and interannual variability. After smoothing with a 13-month running mean, they correlate well (R = 0.83), with rapid increases in the Makassar heat flux anomaly from 2006 to 2008 followed by a slow decrease from 2009 to 2015 that manifests 30 months later in ETIO box heat content anomaly. This indicates that variability within Makassar Strait plays an important role in determining the heat content in the ETIO, with potential for that influence to spread across the Indian Ocean, perhaps reaching into the Agulhas leakage region south of Africa, as suggested in model runs (Durgadoo et al., 2017).