Introduction
Observations of Arctic climate since the 1980s show strong warming of two to three times that of the global mean (Collins et al., 2013) and a strong reduction in sea ice extent of up to 40% in September since the 1980s (Walsh et al., 2017). Projections for the twenty-first century using various climate models suggest that the warming will continue and possibly accelerate, with the central Arctic warming as much as 10°C (Figure 1). As a result, late summer sea ice may vanish as early as the 2040s (Collins et al., 2013), with sea ice retreat contributing to surface warming. Amplified Arctic warming is caused by a number of climate feedbacks, most notably ice-albedo feedback and lapse-rate feedback (Pithan and Mauritsen, 2014). (The lapse rate is the change in temperature with altitude; non-uniform changes in the lapse rate cause differences by which atmospheric warming affects outgoing longwave radiation, called the lapse-rate feedback.) Because the ice-albedo feedback is positive in the Arctic (amplifying an initial warming) and zero in extrapolar ice-/snow-free regions, it contributes to amplified Arctic warming. Similarly, the lapse-rate feedback is positive in the Arctic and negative in extrapolar regions, thereby also contributing to amplified Arctic warming. High-latitude warming peaks in the near-surface atmospheric layers (Screen and Simmonds, 2010) and exhibits a strong seasonal cycle: maximum in winter, moderate in summer. The latter is related to the storage and release of energy by the ocean, modulated by receding sea ice (Bintanja and van der Linden, 2013).
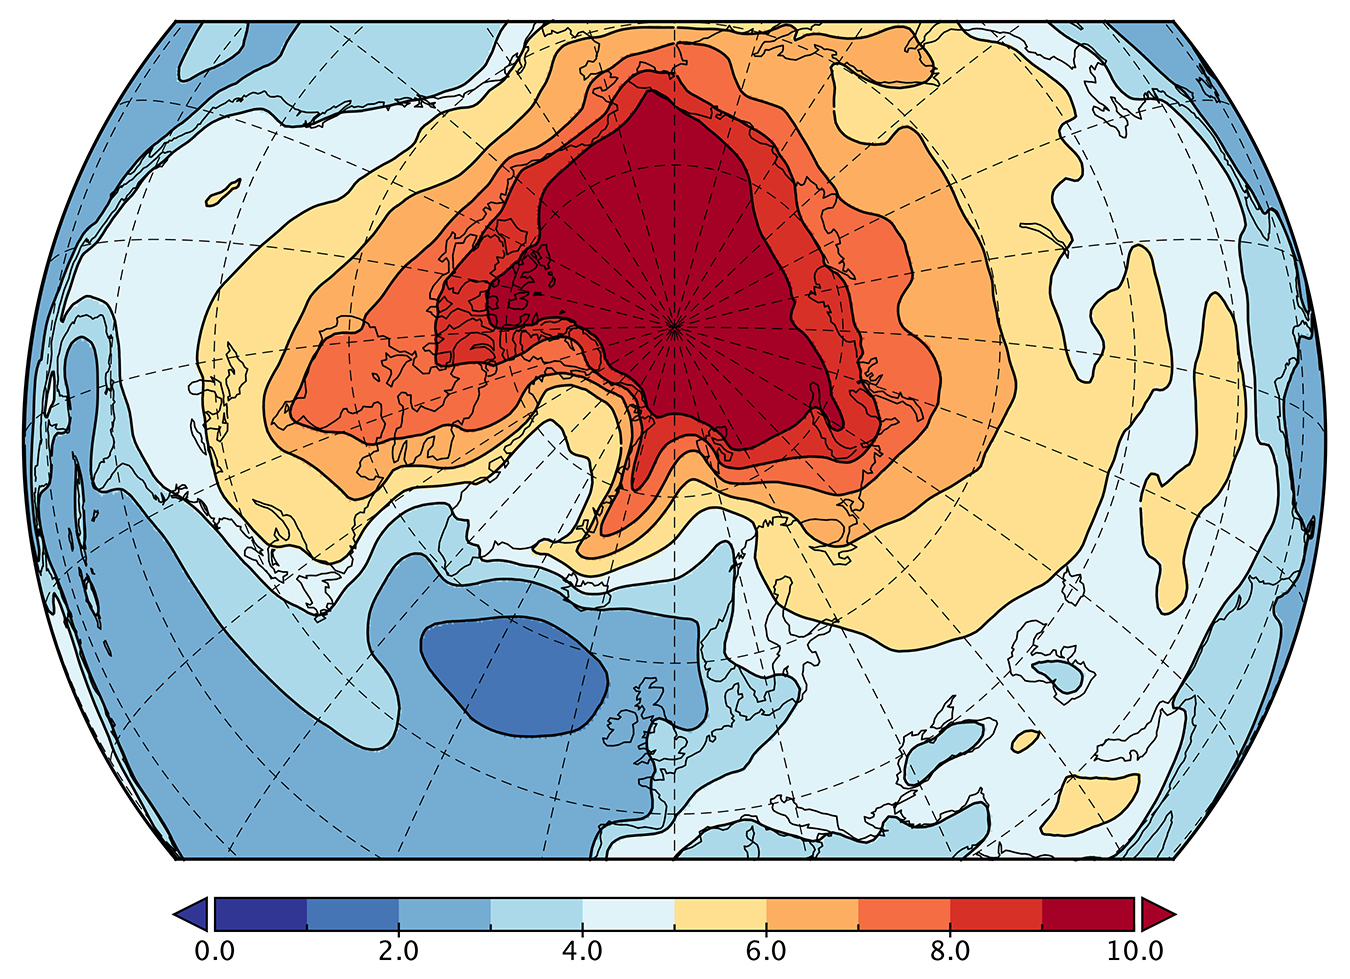
Figure 1. Difference in annual mean surface air temperature between the end of the twenty-first century (2091–2100) and the present day (2006–2015) for 36 CMIP5 climate models (average over all models) forced by the RCP8.5 warming scenario. > High res figure
|
Concurrent with this strong seasonal warming is a strengthening of the Arctic hydrological cycle (e.g., Min et al., 2008; Vihma et al., 2016): sea ice retreat leads to enhanced surface evaporation, more clouds, and intensified precipitation rates (Bintanja and Selten, 2014). Recent studies show that the precipitation increase in the Arctic may reach 50%–60% in the year 2100 for the strongest warming scenario (RCP8.5), aided by enhanced moisture influx from lower latitudes (Kug et al., 2010; Bengtsson et al., 2011; Zhang et al., 2013). A considerable part of the additional precipitation is projected to fall as rain (Screen and Simmonds, 2012), but in the high Arctic (roughly north of 80°N) and over Greenland, snowfall will continue to dominate precipitation (Bintanja and Andry, 2017).
The feedbacks between reduced sea ice cover, enhanced surface evaporation, increased cloud cover, and more precipitation are relatively well established and studied (Francis et al., 2009; Vihma et al., 2016), but the direct effects of precipitation changes on sea ice conditions have not been addressed thus far. Precipitation freshens the upper ocean layers (Holland et al., 2007), a process that is qualitatively similar to warming-induced enhanced melt and runoff from continents, glaciers, and ice sheets that leads to expanding sea ice (e.g., Bintanja et al., 2013; Nummelin et al., 2015, 2016). The most obvious difference between these two processes, besides possibly the magnitude of the forcing, is the spatial (and seasonal) pattern of the freshwater forcing. In the cases of glaciers and ice sheets, forcing is located near the margins of the land-based ice peaks in spring/summer and diminishes to near zero in winter. If precipitation changes, the freshwater forcing will occur wherever there is open water throughout the year, even though the magnitude may vary from season to season.
Increased snow- and rainfall in the Arctic will have many consequences (e.g., societal, ecosystem), including drastic effects on climate. It was recently found that increased levels of Arctic precipitation that result in reduced surface salinity and outflow of relatively fresh water into the North Atlantic can affect deep water formation and the strength of the Atlantic Meridional Overturning Circulation (AMOC; Bintanja and Selten, 2014). Such changes in Arctic precipitation have the inherent ability to affect the global climate. However, the extra precipitation may also have more localized climate effects. This is because fresh snow increases surface albedo—whereas rain lowers the albedo of snow-covered surfaces—and thus affects the surface radiation budget (Kattsov and Walsh, 2000). Moreover, increased precipitation, as well as runoff from precipitation that enters rivers directly (Peterson et al., 2002; Nummelin et al., 2015, 2016), will cause the Arctic Ocean to freshen, especially the top layers, thereby affecting vertical mixing. More precisely, the vertical stratification is strengthened, likely leading to reduced upward mixing of heat, and, as a consequence, surface cooling. Changes in vertical mixing also greatly affect upward mixing of nutrients, essential ingredients for phytoplankton blooms and thereby for seasonal ecosystem development (Vancoppenolle et al., 2013).
Additional precipitation resulting from both the albedo and the vertical ocean mixing effects can, in principle, influence sea ice extent and Arctic temperatures. In “realistic” climate runs, however, these processes are hard to single out and quantify because of the complex interconnection of the associated climate variables. In this paper, we investigate the roles that surface albedo and vertical ocean mixing play in the spatially, vertically, and seasonally changing Arctic climate by using specific climate model simulations in which we apply artificially altered precipitation rates. Additionally, we will use the results from these simulations to estimate the “realistic” effect of these feedbacks on projected Arctic twenty-first century warming and sea ice retreat.
Methods
In order to isolate the link between precipitation and sea ice and near-surface temperatures from other climate interactions, we carried out a series of climate model simulations using the state-of-the-art atmosphere-ocean-land global climate model EC-Earth v2.3 (T159L46 resolution; Hazeleger et al., 2010). This model contributed to the Climate Model Intercomparison Project phase 5 (CMIP5) initiative (Collins et al., 2013) that intercompared and applied about 40 global climate models to produce future projections of climate using standardized climate forcing scenarios. EC-Earth v2.3 employs the atmospheric model IFS (which includes atmospheric dynamics, physics, and land processes), the ocean model NEMO (Nucleus for European Modelling of the Ocean), the dynamic-thermodynamic sea ice module LIM2 (both at 1° × 1° resolution), and the OASIS coupling module to combine the various components. Note that EC-Earth v2.3 (year 2000 control run) has a slight warm bias in the Arctic, especially in winter (+1.8°C), with too little sea ice in summer and somewhat too much in winter; biases are −2.5 and +2.0 1012 m2, respectively, compared to ERA-20C data averaged over 1990–2010 (van der Linden et al., 2017). These biases should be borne in mind while interpreting the results. For instance, the simulated response of sea ice caused by precipitation changes may diverge from that in nature because the additional precipitation may affect upper-ocean salinity differently if present-day sea ice cover is over/underestimated.
In the 44-year simulations used here, initiated with year 2000 conditions, we kept the radiative forcing at the present-day (year 2000) level but artificially and instantaneously changed the precipitation rate in the Arctic (70°–90°N) region (Bintanja and Selten, 2014). In particular, we simply added a source term for Arctic precipitation so that the surface receives a certain extra amount of precipitation (without adjusting the atmospheric moisture balance). We carried out three simulations in which we multiplied Arctic precipitation rates by a certain value A (1, 1.5, 4), which means that for any model grid point in the Arctic, the surface instantaneously receives A times the present-day precipitation. In an absolute sense, wet regions and/or seasons thus receive extra precipitation above that of dry regions/seasons. The added precipitation is applied throughout the 44-year simulation period. Whether the additional precipitation falls as snow or rain is determined by internal model physics. Obviously, A = 1 is the control simulation, representative of present-day (year 2000) conditions and climate forcing. The case A = 1.5 represents the “realistic” situation for a 50% increase in precipitation that the CMIP5 climate model ensemble projects for the year 2100 in the RCP8.5 scenario (Bintanja and Selten, 2014), while the extreme (and unrealistic) A = 4 case was added in order to optimally identify the relevant climate mechanisms. We show the first two years of the simulations to infer the “initial” response so as to pinpoint the processes governing the changes (data from the first year only may be affected by random internal climate variability). We also show means over the final 20 years of the simulations as the “final” changes, the length of this period being a compromise between (1) a sufficiently long period to average out internal variability, and (2) starting long enough after the beginning of the simulations to minimize transient climate effects.
Note that because internal climate mechanisms alter the precipitation rate in the Arctic, the additional precipitation will be affected as well. For instance, because adding precipitation generally results in cooling (as will be shown later), more sea ice, and reduced precipitation rates, this means that, for example, precipitation in the A = 4 case will become somewhat smaller than four times the current value during the course of the integration. We compare the altered precipitation cases (A = 1.5, A = 4) with the control simulation (A = 1) to determine the climate effects of increased rates of Arctic precipitation, in particular, sea ice and surface air temperature. These exact simulations were used previously to evaluate the effect of artificially altered Arctic precipitation on the AMOC (Bintanja and Selten, 2014) through the export of relatively fresh surface water to the North Atlantic.
Results
An increase in precipitation leads to cooling of the Arctic region (Figure 2). Annual mean temperatures (70°–90°N averages over the full 44 years of the integrations) and interannual standard deviations are −13.5° ± 0.7°C, −14.2° ± 0.4°C, and −17.6° ± 0.8°C for the cases A = 1, A = 1.5, and A = 4, respectively. In the unrealistically strong forcing case A = 4, the Arctic region cools by 4.1°C, but in the more realistic case A = 1.5, the cooling amounts to only 0.7°C, and temporal variability is considerable. There are two potential causes for precipitation-induced cooling of the Arctic: (1) an increase in surface albedo because of enhanced snowfall, (2) a decrease in ocean surface salinity by the extra precipitation, leading to stronger stratification and reduced upward mixing of heat from the deeper ocean to the surface. We examine both mechanisms’ contributions to the simulated cooling.
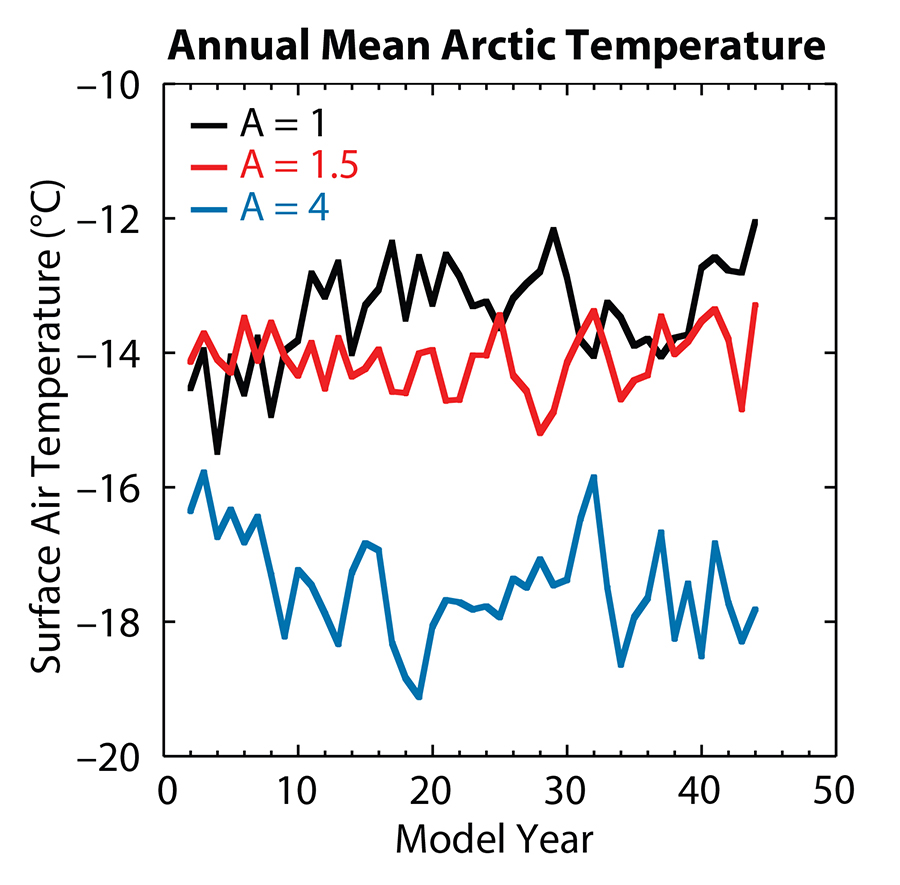
Figure 2. Arctic mean (70°–90°N) annual mean surface air temperature for the cases A = 1 (black), A = 1.5 (red), and A = 4 (blue) for the 44-year precipitation-rate simulations. > High res figure
|
Increased precipitation can lead to more snowfall, which tends to increase the surface albedo, or more rainfall, which generally reduces the surface albedo. Therefore, we first examine changes in surface albedo over snow-/ice-covered surfaces (in the Arctic Ocean, the surface is sea ice). A complicating factor is that snowfall may affect not only sea ice extent by increasing the albedo and cooling but also sea ice expansion that in itself leads to higher (Arctic mean) albedo, meaning that albedo changes constitute a response rather than a cause. During both the control run and the altered precipitation runs, in order to distinguish these effects, we examined surface albedo changes for the entire Arctic and also specifically for those regions that are sea ice covered. The initial response (i.e., the first two years) exhibits an increase in Arctic mean surface albedo for the increased-precipitation simulations (Figure 3a, black line). However, sea ice also begins to expand immediately (Figure 3b), especially in the Barents Sea, so the elevated values of surface albedo might well be attributed to increases in sea ice extent. Indeed, surface albedo values over regions covered by sea ice in both simulations are quite alike (Figure 3a, red line), which means that the average changes in Arctic surface albedo are virtually totally due to expanding sea ice (or snow) and not to more/fresher snow. Hence, the increase in surface albedo due to enhanced precipitation/snowfall can be ruled out as an important factor in the precipitation-induced cooling of the Arctic region because it is merely a result of sea ice expansion, not the cause of the cooling and sea ice expansion.
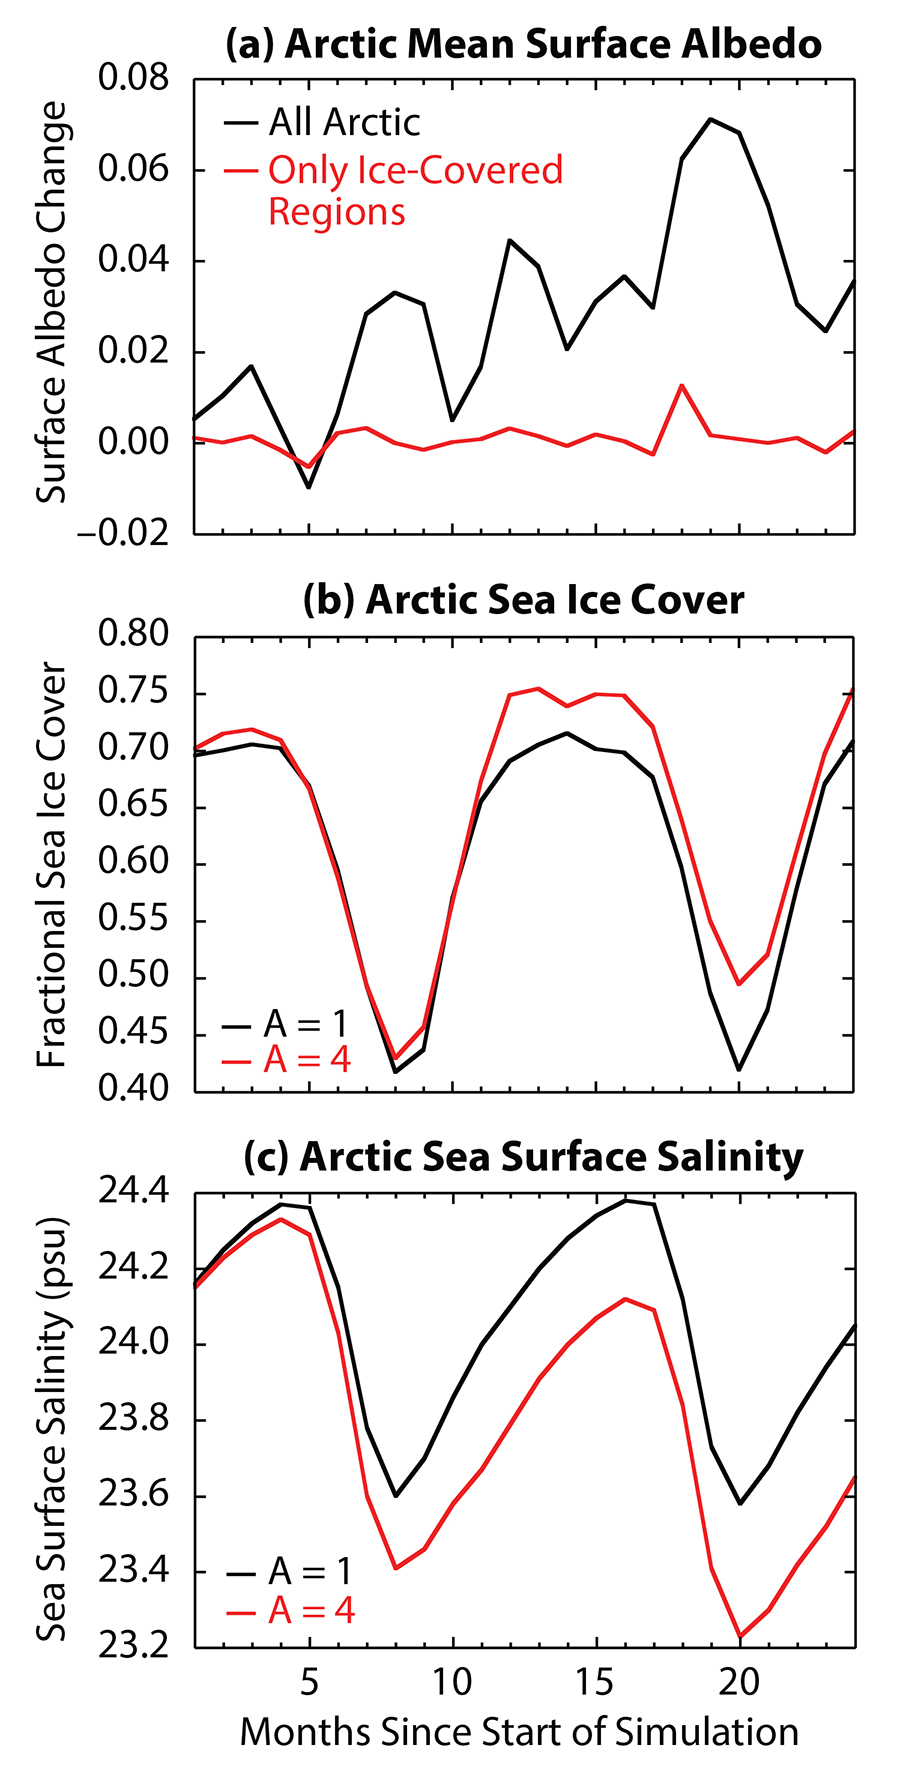
Figure 3. (a) Changes in Arctic mean surface albedo (case A = 4 minus case A = 1) over the first two years of simulation. Black represents the entire Arctic (70°–90°N). Red represents only the regions for which sea ice is present in both cases. (b) Arctic mean sea ice cover (fractional). Black is the A = 1 case, red the A = 4 case. (c) Arctic mean sea surface salinity (psu). Black is the A = 1 case, red the A = 4 case. > High res figure
|
Precipitation falling over open water will immediately lead to freshening of the upper ocean, but even enhanced snow accumulation over sea ice can lead to lower salinity values later in the season when the sea ice and overlying snow melt away (although sea ice drift may cause the locations of extra precipitation and its effect on salinity to differ). We therefore examine the first two years of sea surface salinity (SSS) in the Arctic including the response to A = 4 forcing (Figure 3c). Clearly, an increase in Arctic precipitation leads to an immediate reduction in Arctic mean SSS. As a result, surface ocean density will decrease, leading to a more stable vertical density gradient. This stable vertical density gradient in turn reduces the vertical mixing of heat (and other quantities) in the ocean surface layer and, hence, the depth of the mixed layer, especially in the North Atlantic and the Norwegian Sea (Figure 4). This region is—apparently—extremely sensitive to precipitation changes, with strong reductions in vertical mixing occurring in the open ocean bordering the sea ice pack.
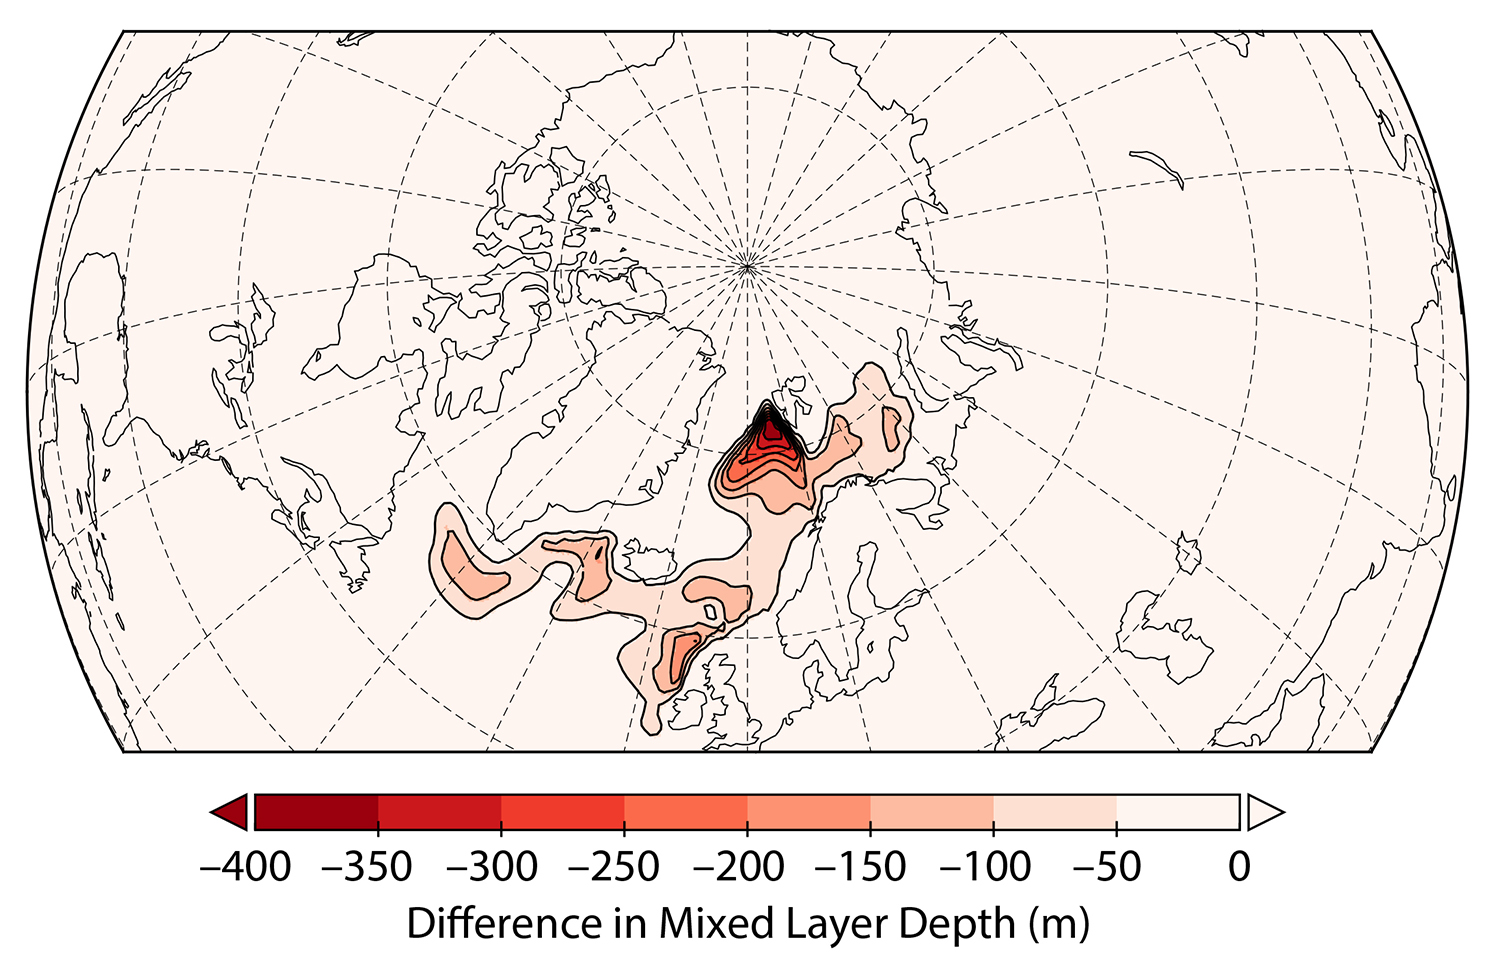
Figure 4. Geographical distribution of the difference in annual mean mixed layer depth (MLD) between cases A = 4 and A = 1, averaged over the last 20 years of the simulations. Negative numbers mean shallower MLDs in the case A = 4. > High res figure
|
The inferred reduced upward mixing of heat (not shown) thus immediately leads to cooling of the upper ocean layers (Nummelin et al., 2015) and to warming of the deeper ocean layers (Figure 5a), and hence to a stronger thermocline. Initially (the first two years), cooling is confined to the top 50 m of the ocean (Figure 5a). This depth roughly coincides with the depth of the salinity anomaly (Figure 5b) and is governed by the background density profile and the strength of the freshwater forcing (the extra precipitation). Interestingly, the initial salinity forcing extends over the entire Arctic north of 70°N, hence, even in regions where sea ice is prevalent (although the strongest freshening occurs at lower latitudes, near the sea ice margin, and over the Norwegian Sea). Perhaps leads in the sea ice pack, especially in summer, permit the extra precipitation to directly affect SSS, so that the precipitation-induced freshwater forcing is “felt” in the entire Arctic Ocean, similar to surface meltwater (Eicken at al., 2002). Alternatively, transport of freshwater from the ice margins or the Nordic Seas, or reduced upward diffusion of relatively salty water, may contribute to the presence of a freshwater layer underneath the sea ice pack. Eventually, the salinity anomaly expands downward, but nonetheless remains confined to the uppermost 100 m (Figure 5c) in the final stages of the simulations (the final 20 years).
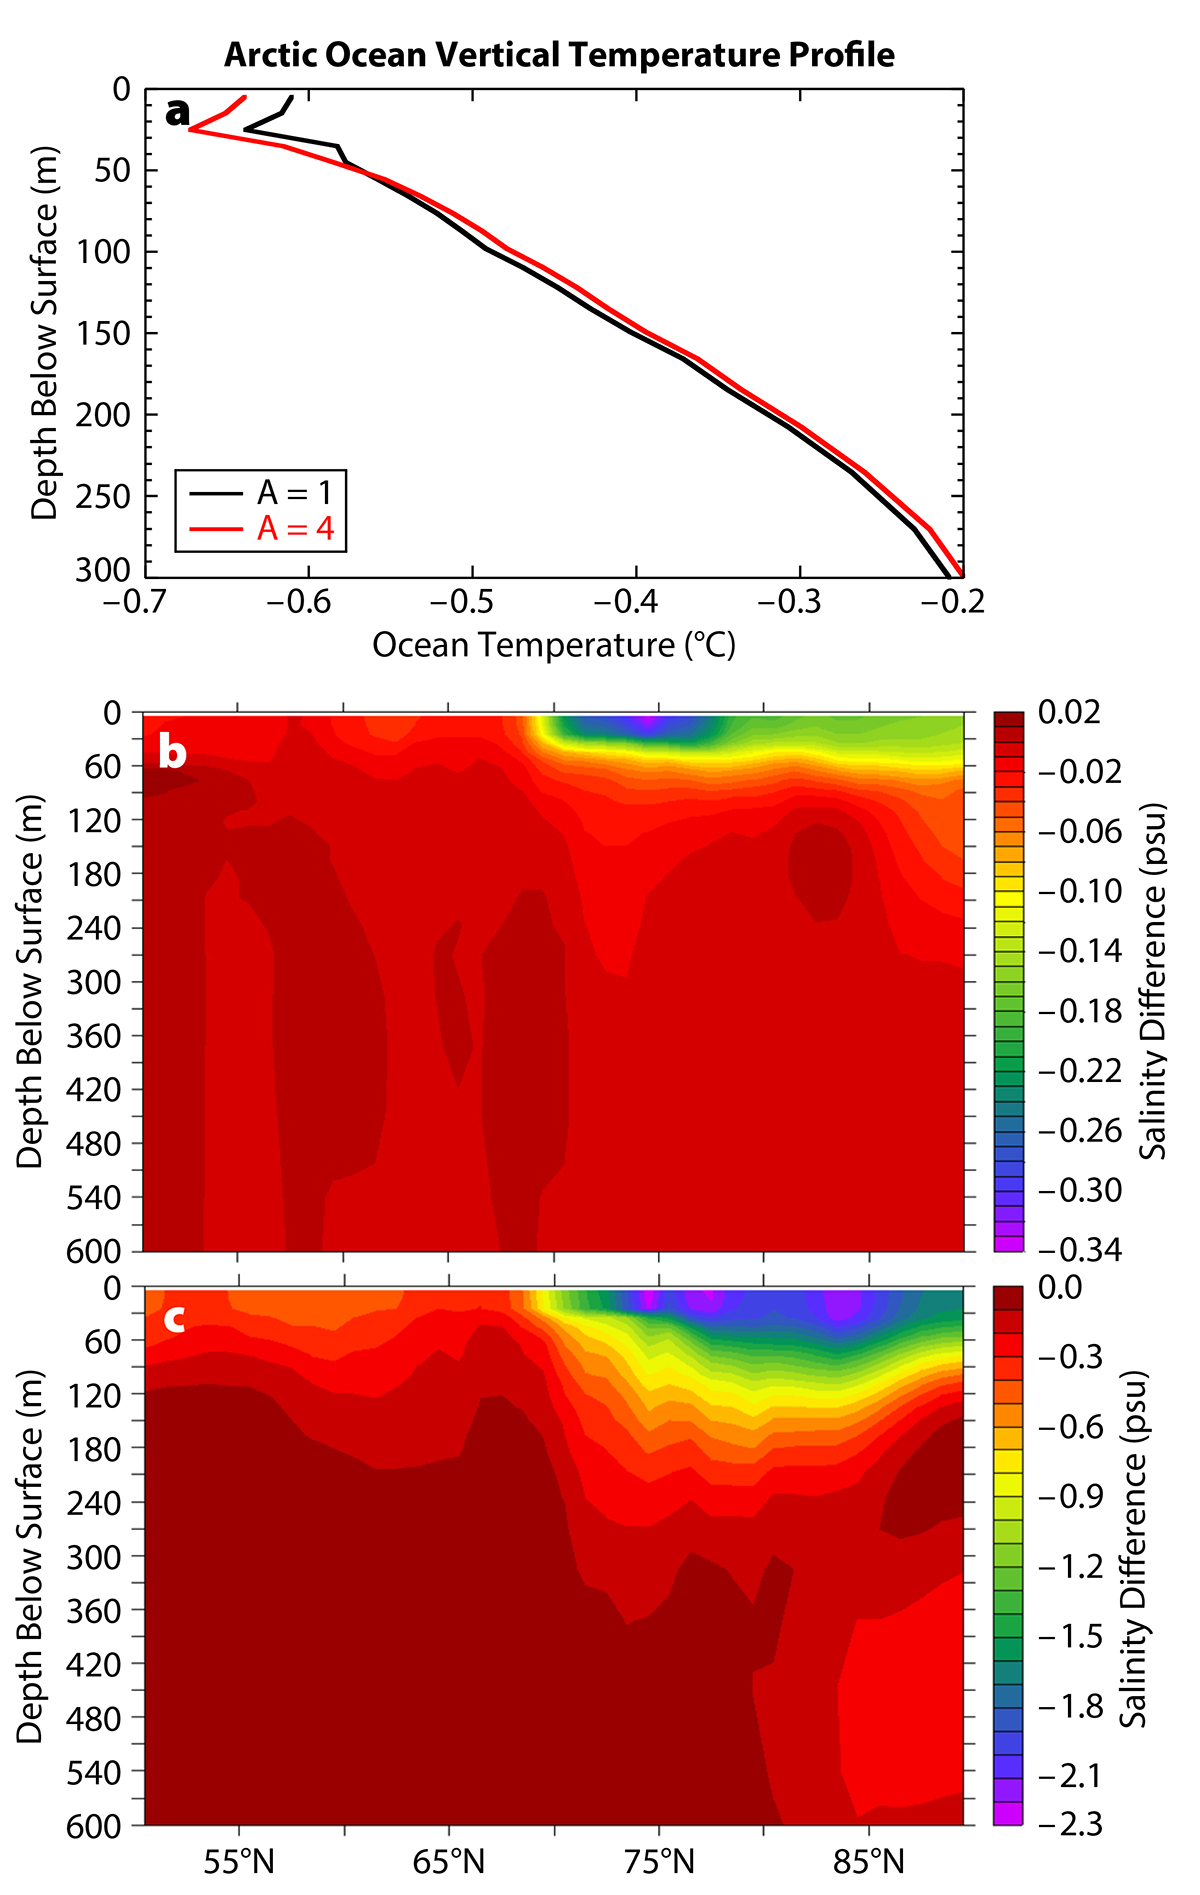
Figure 5. (a) Arctic Ocean (70°–90°N) mean vertical temperature profile, averaged over the first two years of the simulations. Black is the A = 1 case, red the A = 4 case. (b) Zonal mean salinity difference between the A = 4 and A = 1 cases, averaged over the first two years of simulations. (c) Same as in panel b but for the final 20 years of the simulations. Note the different color scales in panels b and c. > High res figure
|
Part of the additional precipitation (applied to all regions north of 70°N) will fall on land, and will thus lead to enhanced runoff that potentially affects Arctic Ocean salinity, especially in coastal seas. Compared to the extra precipitation entering the Arctic Ocean, this additional runoff is a relatively small amount (about 25%), even though absolute precipitation rates are usually higher in the subarctic regions compared to those in the cold and dry central Arctic.
The final climate response (evaluated as the means over the last 20 years of the simulations) shows strong cooling throughout the Arctic, in particular in the North Atlantic and Barents Sea regions (Figure 6), corresponding to regions where the mixed layer depth (MLD) response is maximum (Figure 4). Eventually, the reduced MLD-related cooling causes sea ice to expand, further amplifying the response. Some of the cooling is even “transported” to southerly regions, such as the area surrounding Greenland in summer, where reinforced export of sea ice (and freshwater) may cause reduced temperatures locally. The final temperature response exhibits a marked seasonal cycle that resembles the “normal” climate response to radiative (e.g., greenhouse) forcing: strong in winter, moderate in summer (e.g., Collins et al., 2013). The insulation feedback related to expanding sea ice is clearly strongest in winter, when temperature differences between atmosphere and ocean surface are largest (Bintanja and van der Linden, 2013). This cooling response effect is only partially related to the direct effect of the initial reduction in ocean vertical mixing. In addition, the subsequent expansion of sea ice strongly reduces upward surface heat fluxes, reinforcing near-surface atmospheric cooling. Hence, a precipitation-induced response mimicking a greenhouse-forcing-induced response (of opposite sign) is largely due to the fact that both trigger sea ice changes that amplify the climate response with a largely similar seasonal signature: maximum in winter, minimum in summer (e.g., see Screen and Simmonds, 2010).
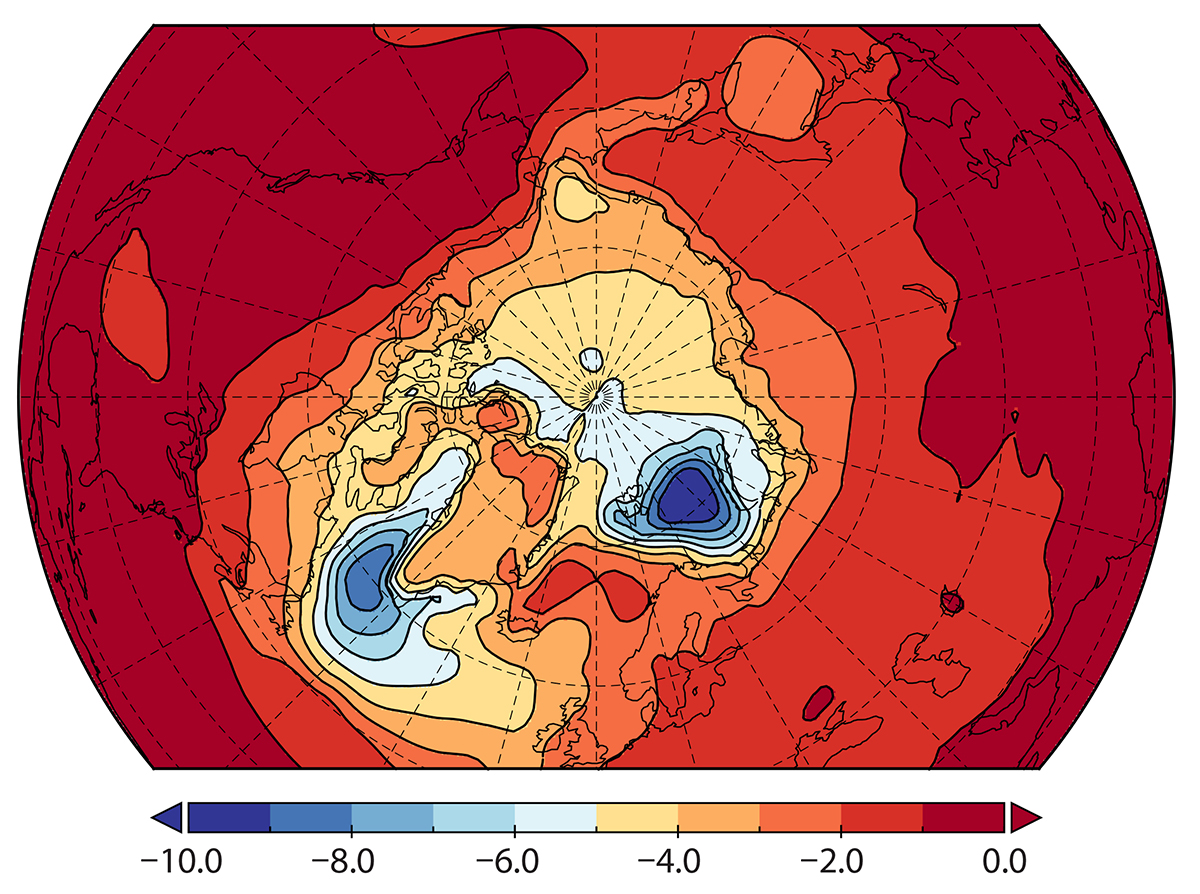
Figure 6. Difference in annual mean surface air temperature between the A = 4.0 and A = 1 cases, averaged over the final 20 years of the simulations. > High res figure
|
The long-term response is also evident in the ocean, through reduced MLDs and vertical mixing rates, especially in non-summer seasons (Figure 7a) in the North Atlantic Ocean and the Norwegian Sea (Figure 4). This seasonality reinforces the seasonal climate response, with maximum cooling in winter as the upward oceanic mixing of heat is reduced. Maximum Arctic precipitation occurs in winter (minimum precipitation in summer), which largely explains the wintertime MLD response. Long-term reduction in ocean density is greatest at the surface, meaning that the vertical density gradient will increase (Figure 8). The maximum change in vertical density gradient occurs at 40 m depth, suggesting stronger decoupling of the surface and subsurface waters in the Arctic Ocean. As shown above, while the surface cools due to the extra precipitation, the deeper ocean layers warm considerably (Nummelin et al., 2016). Ocean heat transport from lower latitudes into the Arctic continues to warm the deep layers of the Arctic Ocean, especially once the reduced upward mixing of heat (aided by the increased sea ice cover) diminishes the heat loss to the overlying atmosphere.
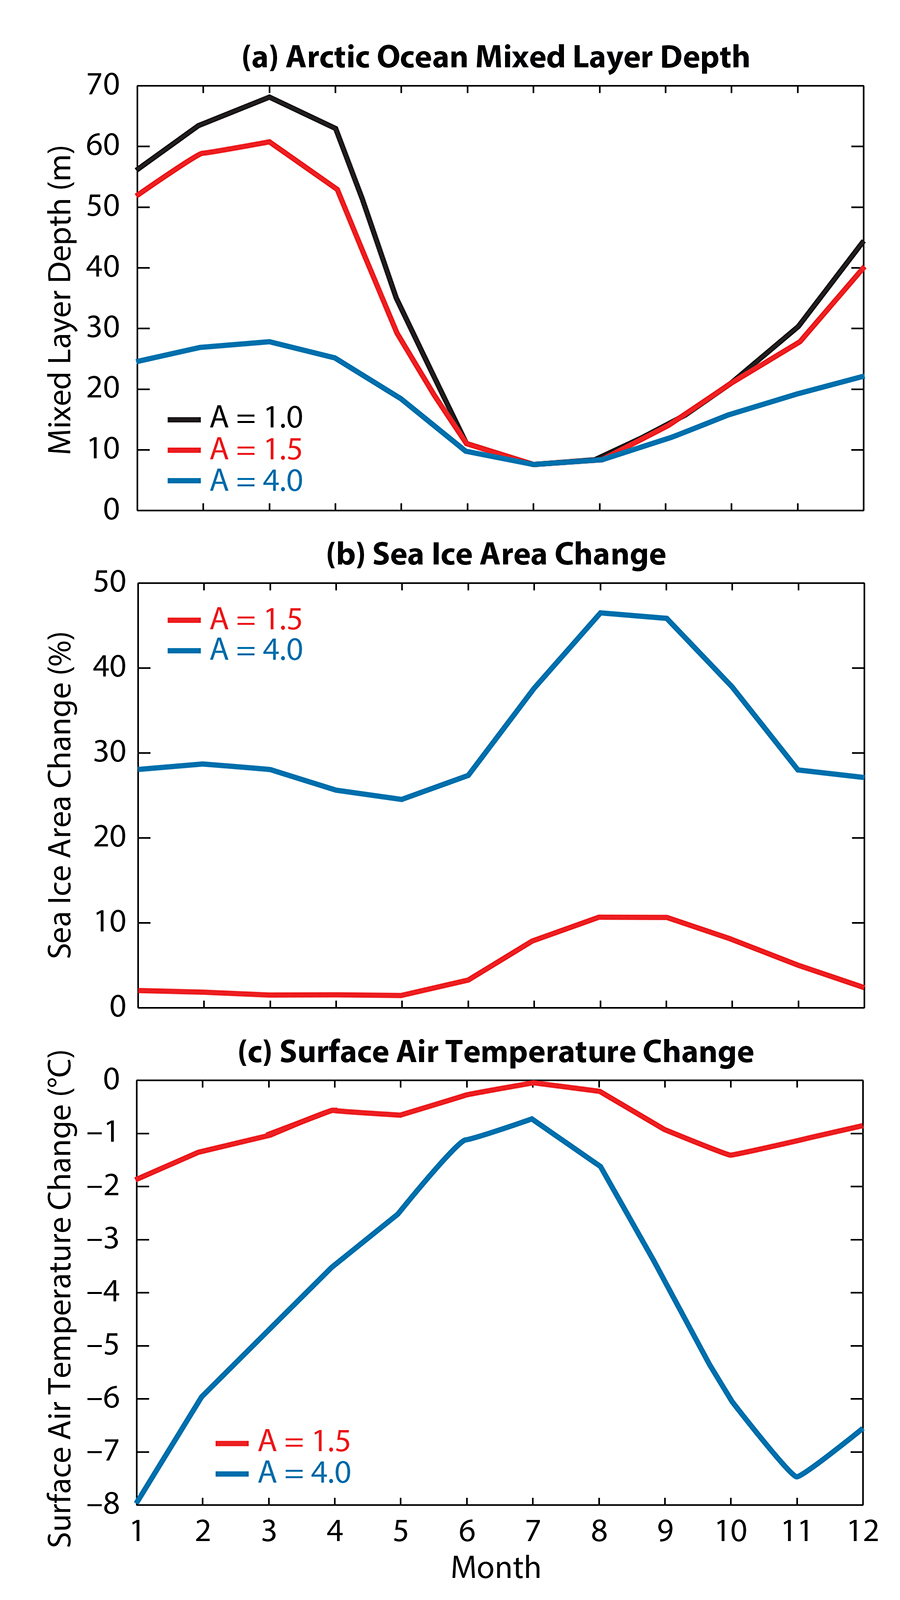
Figure 7. (a) Seasonal cycle in mean Arctic Ocean (all ocean north of 70°N) mixed layer depth, averaged over the final 20 years of the simulation (black: A = 1, red: A = 1.5, blue: A = 4). (b) Response in Arctic sea ice cover for A = 1.5 relative to A = 1 (red) and A = 4 relative to A = 1 (blue). (c) Response in Arctic mean surface air temperature for A = 1.5 relative to A = 1 (red) and A = 4 relative to A = 1 (blue). > High res figure
|
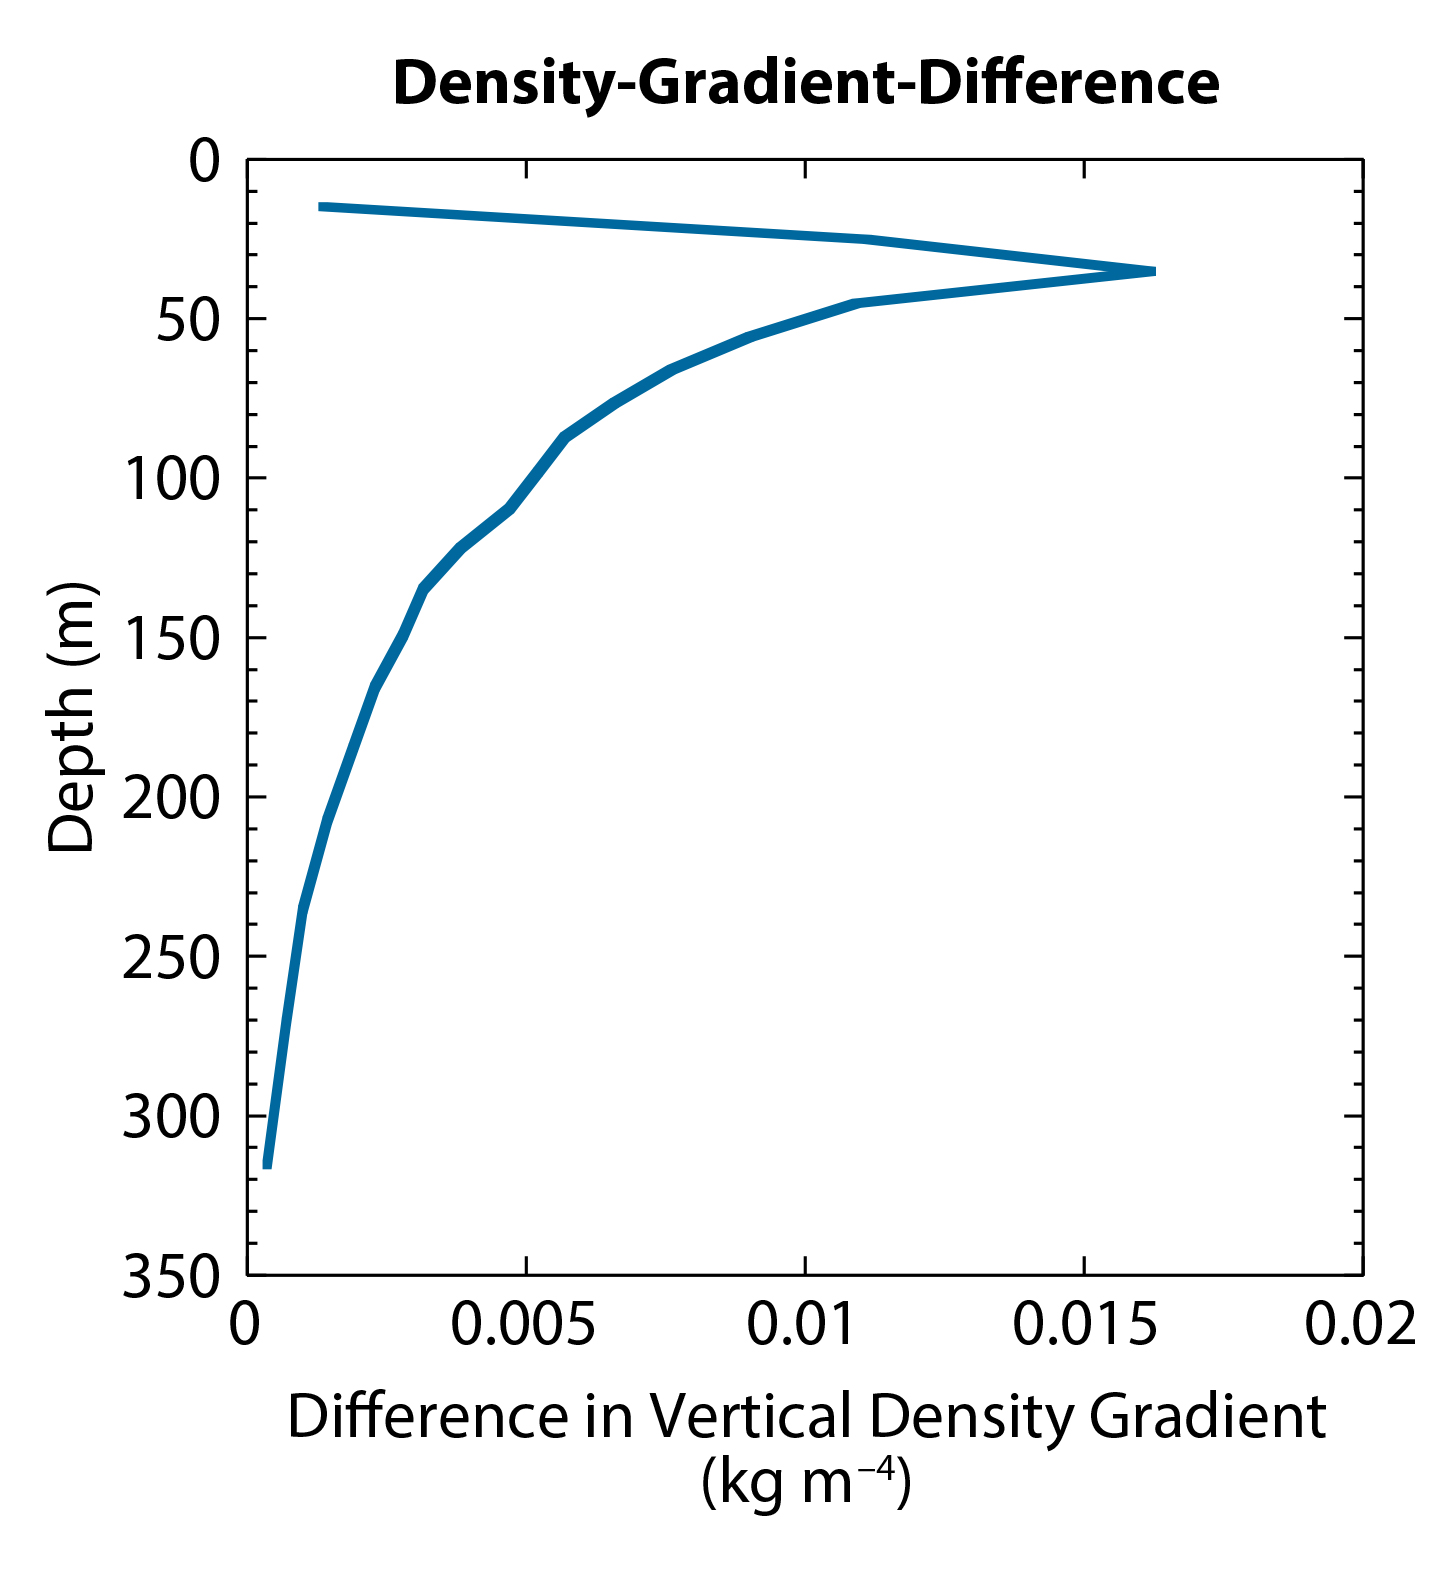
Figure 8. Arctic Ocean (all ocean north of 70°N) mean difference (A = 4 minus A = 1) in ocean vertical density gradient, averaged over the final 20 years of the simulation. > High res figure
|
The long-term sea ice response shows a considerable increase in sea ice extent that peaks in autumn (the sea ice expansion season; Figure 7b), and is similar to how sea ice reacts to freshwater forcing in Antarctica that is caused by enhanced ice shelf melt (Bintanja et al., 2013). The freshening of the upper ocean layers and the concurrent cooling cause earlier and more extensive freezing over of the Arctic Ocean at the beginning of winter. The seasonal response is in accordance with seasonally varying radiative forcing simulations designed by Bintanja and Krikken (2016) to elucidate the Arctic climate response. They found that radiative forcing in any season resulted in sea ice response that always peaked in autumn. This suggests that the seasonal sea ice response to freshwater forcing, as shown in Figure 7b, is the Arctic’s “system” response to any type of forcing, which can be attributed to the fact that relatively fresh water freezes over more easily. For the “realistic” case (A = 1.5), the additional precipitation-induced sea ice extent response varies between 3% and 11%. Hence, the global/Arctic warming induced sea ice retreat will be reduced by 3%–11% due to the increase in Arctic precipitation that accompanies the warming under the assumption of a linear response of the Arctic climate to various forcings (Notz and Stroeve, 2016).
The long-term temperature response (Figure 7c) also exhibits a clear seasonal cycle, with strong cooling during winter and very moderate cooling in summer. This seasonal cycle is characteristic of the temperature response of the Arctic to radiative forcings, and can be attributed to changes in heat gain (in summer, mainly due to shortwave absorption) and loss (in winter, due mainly to enhanced non-solar upward surface fluxes) in the Arctic Ocean that are related to changes in sea ice (Bintanja and van der Linden, 2013). In the “realistic” case A = 1.5, the precipitation-induced cooling varies between 0.1°C and 2°C, which means that for RCP8.5-induced Arctic forcing, precipitation changes will oppose the warming by roughly 10%. In other words, in the hypothetical situation for which Arctic precipitation would not change under climate warming, Arctic warming would be 10% stronger. Hence, the projected extra precipitation falling in the Arctic region as a by-product of Arctic warming will act as a negative feedback, leading to slower sea ice melt and reduced warming. Note that the precipitation-induced cooling exhibits a distinct geographical response (Figure 6) that seems largely connected to changes in MLD (Figure 4), as opposed to the average twenty-first century warming simulated by 36 CMIP5 climate models that peaks in the central Arctic (Figure 1). This suggest that the specific signature of precipitation-induced cooling might be discernible from the generic simulated warming in the Arctic, even though the seasonal cycle is very similar.
Conclusions
It is well established that Arctic warming will lead to an intensified hydrological cycle, with a considerable increase in Arctic precipitation (50%–60%) projected for the year 2100 under the RCP8.5 scenario. However, the climate effects of this additional precipitation are so far poorly known. We analyzed climate model simulations using the state-of-the-art global climate model EC-Earth with Arctic precipitation artificially altered. These simulations allow us to isolate the climate effects of changing precipitation from other feedbacks and to quantify the contribution of the precipitation-induced feedbacks in a scenario-like climate response.
It might be expected that additional Arctic precipitation (snowfall) will increase the surface albedo. However, snow-covered sea ice already has a high albedo, thus additional snowfall would not lead to a strong albedo increase (fresh snow on fresh snow). At least for snow-covered Arctic sea ice, any increase in albedo due to increased snowfall turns out to be negligible and thus this does not contribute to Arctic cooling. In contrast, the effect of extra precipitation (through leads in the pack ice) as well as the effects of drainage of melt ponds and advection of freshwater from the sea ice margin on sea surface salinity are immediate, yielding fresher ocean surface layers. This freshening stabilizes the water column (Nummelin et al., 2015, 2016), thereby reducing the upward mixing of heat from the deep ocean to the surface. Without this heat, the surface layers cool, which then leads to expanding (and thicker) sea ice (especially near the sea ice margin in the Barents Sea), a strong reduction in ocean-atmosphere heat fluxes, and hence a strong cooling of the lower atmosphere. Thus, the effect of precipitation on the climate response is governed by changes in Arctic Ocean vertical mixing and amplified by a reduction in the sea-ice-expansion-related ocean-atmosphere heat fluxes.
The overall conclusion is that enhanced Arctic precipitation leads to expanding sea ice, to cooling of the atmosphere and the upper ocean layers, and to warming of the subsurface layers of the ocean. In the framework of future projections of Arctic climate, in which enhanced greenhouse forcing leads to a warming Arctic, to reduced sea ice, and to more precipitation, this negative feedback will dampen the climate response. In case of the strongly warming RCP8.5 scenario, for which Arctic precipitation increases by 50%–60%, this feedback will reduce atmospheric surface warming by about 10% (throughout the year) and will increase sea ice cover by 3%–11%, depending on the season (maximum increase in autumn). Note that these numbers should be interpreted as valid within the framework of the setup and the artificial nature of the simulations (especially the spatial/seasonal distribution of the additional precipitation, and the extra source of precipitation) and the specifics of the climate model used (EC-Earth). While we believe that the associated mechanisms/feedbacks are qualitatively robust, quantifying the effects of Arctic precipitation may well be model-dependent and susceptible to the specifics of the details of the extra precipitation forcing, to the control (present-day) state of Arctic sea ice, and to the control state of the ocean model (i.e., the background ocean vertical density profile). For instance, models with a cold bias, more sea ice, and a relatively fresh upper ocean (and smaller vertical density gradient) may be less sensitive to freshwater/precipitation changes, and vice versa for excessively warm-biased models. Another aspect not addressed in this study is that in a future warmer climate, most additional Arctic precipitation will likely fall in liquid form (Bintanja and Andry, 2017), which will reduce the surface albedo of ice- and snow-covered surfaces. As such, this extra rain will reinforce sea ice melt and thus counteract the negative feedback put forward in this paper.