Introduction
Summer internships, such as the Research Experience for Undergraduates (REU) programs sponsored by the US National Science Foundation (NSF), offer an excellent opportunity for students to gain hands-on research experience, along with a number of career-building opportunities. These intensive internships often occur in locations that are new to the students and cover cutting-edge research topics that are not typically addressed in undergraduate curricula. When REU students become members of active laboratories, they are exposed to professionals across career stages (graduate students, postdoctoral fellows, laboratory technicians, research scientists, and professors) and learn what it might be like to be a scientist. Frequently, students receive their first intensive research training and chances for peer collaboration as REU fellows. For many, an REU internship can be foundational to a career path and may be a life-altering event.
The summer of 2020 was remarkable and unorthodox for many REU fellows across the United States, especially for students in oceanography and other sciences that incorporate strong elements of observation and fieldwork or experimentation. However, the willingness, enthusiasm, imagination, and involvement of many researchers ensured opportunities for students to participate in summer internships despite the restrictions imposed by the pandemic. Here, we wish to share details of one such project at the University of Rhode Island’s Graduate School of Oceanography (URI-GSO). The pivot to socially distant and remote learning required the REU advisors to reflect on which aspects were essential and would be most useful to pursue. Revamping the REU experience on short notice with entirely new approaches (e.g., no in-person contact, no access to facilities or equipment for the student) was the foundation for an intense collaboration among us and provided the student researcher and coauthor of this article, Andria Miller, with far more responsibility and agency to lead her research project. Constant adaptation and communication were keys for making the REU experience a success. The pandemic required re-prioritizing the multi-layered goals of the REU program. The main challenge was to identify strategies that would ensure the project would support immersive, student-led research, and development of analysis skills, agency, and autonomy.
Background
The REU at URI-GSO, known as SURFO (Summer Undergraduate Research Fellowship in Oceanography), emphasizes math, engineering, and data science (https://web.uri.edu/gso/academics/surfo/). It has been held every summer since 1985. Because participating faculty recognize that oceanographers traditionally do not reflect the diverse spectrum of humanity and that oceanography needs to be strengthened by contributions from a broad range of perspectives, SURFO particularly welcomes applicants from groups historically underrepresented in our field, and the program has successfully recruited diverse students.
The NSF-funded SURFO aims to provide a pathway for students into research and graduate school. The pivot to online instruction was directed at maintaining the strengths of the program, not only to support the individual student’s research project but also to include the many auxiliary opportunities the program provides, including networking and exposure to the diverse career paths open to oceanographers. While it was going to be difficult to replace living shoreside in beautiful Rhode Island and enjoying the in-person interactions on our splendid Bay Campus, much could be offered remotely: roundtable discussions with representatives from industry, nongovernmental organizations, government scientists, and graduate students; networking with peers; and professional development workshops.
The decision to move the program online was not an easy one. Uncertainties on the trajectory and spread of SARS-CoV-2 abounded in spring 2020. Like many REU sites across the United States, SURFO directors considered a variety of options from business-as-usual following student quarantines after arrival, to a hybrid online/in-person program, to an entirely virtual program, to outright cancellation. Subsequent to consultations with state and university authorities, and with the dozen Bay Campus laboratories that had offered summer research projects, URI-GSO decided in late April on a remote and thus virtual SURFO program as the only practical option to ensure the health and safety of all involved. With just a little over one month to the official start of the program, SURFO advisors adjusted or fully changed their research projects to give selected REU students a meaningful experience. Thanks to NSF’s flexibility, SURFO directors were able to modify the grant budget to ensure that students would have the resources needed to be successful. With REU students spanning 11 time zones from Puerto Rico to Guam, scheduling online events became a challenge, but everyone involved, from REU students to advisors to guest speakers, came through with goodwill and compromises. Below is a description of the research project that gave one student, Miller from Mississippi, hands-on research experience, while collaborating with a team of mentors based in Rhode Island.
Research Question
Our plankton ecology laboratory has worked with eight REU students since 2010. To ensure a meaningful research experience, we have always placed the highest priority on helping students develop quantitative research and analysis skills, as well as autonomy. For summer 2020, this necessitated some flexibility with respect to details of the research project, especially if we were to include fieldwork. Most importantly, we wanted the REU fellow to follow his/her scientific interests, while discovering how to be creative in science. Typically, students admitted to the SURFO program rank different projects and labs with which they may want to engage, and this information is used to match potential mentees with mentors. In the past, the projects our laboratory offered always included exposure to a broad range of questions and methods and emphasized skill building. This was achieved through supporting students with collection of several different types of data (e.g., climate, water column properties and chemistry, species identity and characteristics, continuous vs. discrete data). The main learning objectives were to record and manage large volumes of data, analyze them through different statistical techniques, visualize the findings, and present a synthesis of the results both in writing and orally. The main goal for summer 2020 was to maintain this emphasis. Therefore, for the research component, we prioritized experimental design, data collection and analysis (including statistics), and communication.
The scientific question posed for this year’s project was whether differences in freshwater plankton communities in three different bodies of water in Mississippi, both over time and location, are due to differences in environmental conditions. The main questions included:
1. What is the abundance and distribution of plankton types in dissimilar bodies of water (e.g., a recreational lake and a reservoir)?
2. What are co-occurring environmental conditions and water column properties (e.g., nutrient loading)?
3. Are there discernible patterns in both community composition and environment that reflect the sites’ uses for recreation or as a municipal water source?
The project was constrained by safety and equipment availability. Because of the pandemic, there could be little reliance on local research facilities, which URI-GSO typically makes available (e.g., cruise opportunities on a coastal vessel or on R/V Endeavor along with state-of-the-art equipment in Bay Campus centers and principal investigators’ laboratories). Thus, one major learning objective included fundamental oceanographic (i.e., life) skills, such as making do and winging it. The pivot to online learning made it clear just how important these REU opportunities are for allowing students to demonstrate the many soft skills internships require, including teamwork, reliability, flexibility, and effective communication.
Activity
The chronological steps for Miller’s research activity were:
• Identify suitable sampling locations, within 30 minutes driving distance that could be visited safely (e.g., a sparsely populated recreational lake; Figure 1).
• Develop a sampling plan with documentation in appropriate sampling records (Supplementary Table S1 – 14 KB Excel Spreadsheet).
• Purchase and construct needed equipment (e.g., Secchi disk, plankton net; Supplementary Table S2 – 278 KB pdf).
• Test equipment and procedures to determine the suitability of instrumentation and methodology.
• Execute the sampling plan at identified locations.
• Build an image database of plankton and a data record of environmental observations.
• Apply the latest advances in image analysis and automated computation to the image database in order to categorize and size thousands of plankton cells.
• Categorize plankton types based on criteria of shape, size, and color.
• Examine data for associations among plankton community structure, environmental parameters, locations, and times.
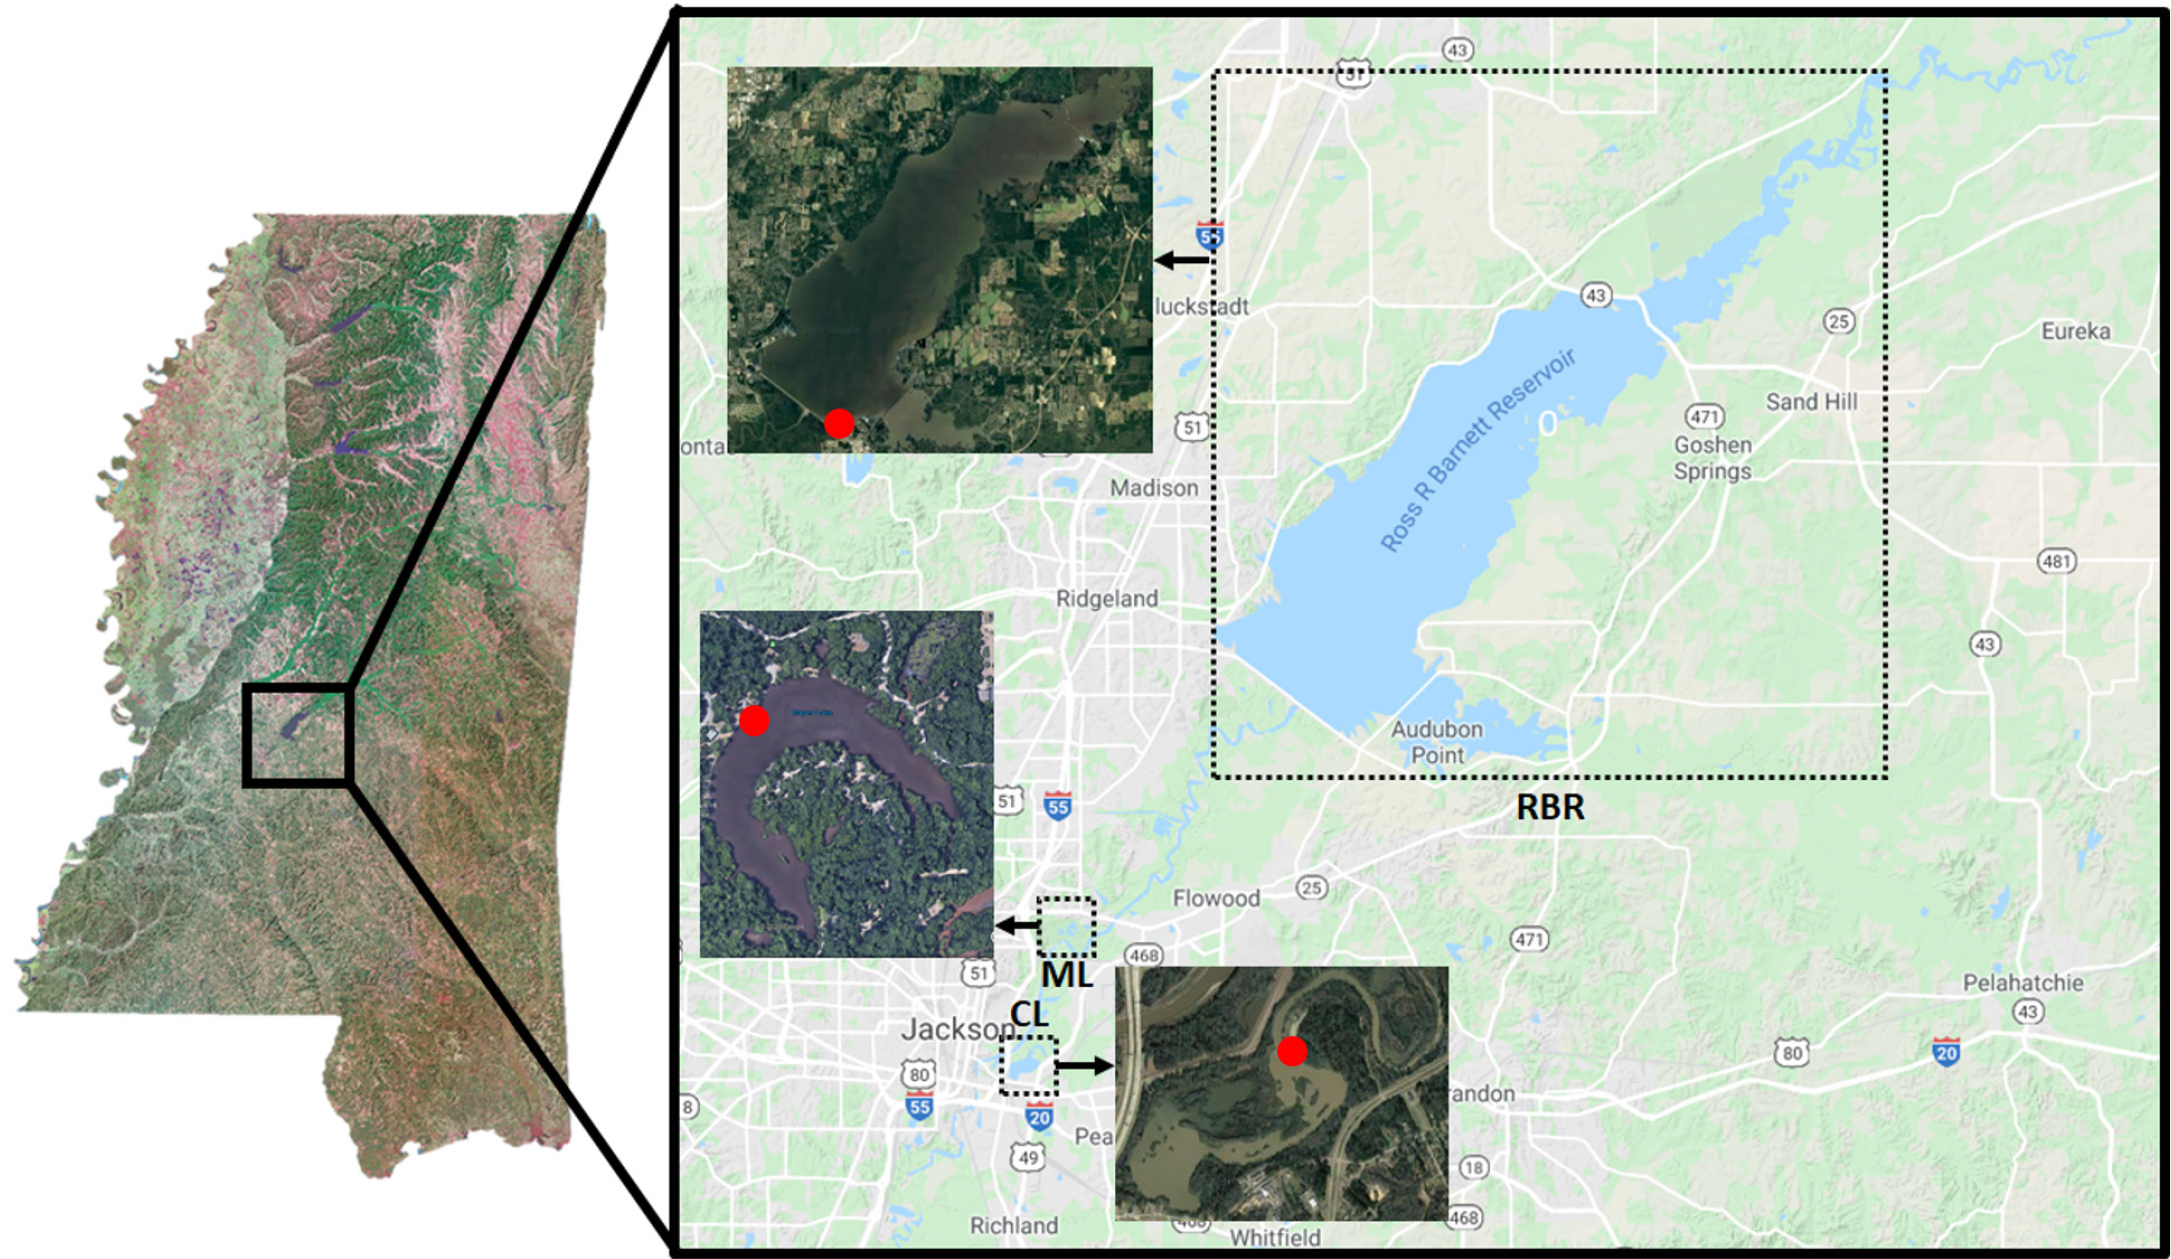
Figure 1. Satellite images of the sampling sites located in central Mississippi: Ross Barnett reservoir (RBR, 32°23’20.50’’N, 90°2’53.71’’W), Mayes Lakes (ML, 32°19’48.19’’N, 90°9’34.49’’W), and Crystal Lake (CL, 32°17’26.02’’N, 90°9’34.49’’W). Red dots on the satellite images indicate sampling locations. > High res figure
|
Ultimately, the work allowed for repeated environmental assessments of several primary water sources that serve Mississippi’s state capital, along with identification of the most relevant drivers of plankton community dynamics in these water bodies for a better understanding of the roles of these drivers and their consequences in a wider socioeconomical context.
One-hour mentee/mentor meetings were scheduled twice a week via an online communication platform. The use of a dedicated Slack channel to communicate and keep constant contact between the mentee and the mentor was particularly useful for daily, rapid exchanges when needed. In addition, regular weekly lab meetings provided exposure to other researchers and their projects and fostered integration of the SURFO student into the lab community. Miller also had scheduled meetings with members of the lab to learn about other research projects and the experiences of graduate students and postdoctoral fellows. In addition, along with her SURFO peers, Miller attended online seminars on oceanographic topics and participated in training workshops on ethics in research, scientific writing, oral presentations, and blogging, among others. The project ended with Miller giving a public (remote) presentation to the whole URI-GSO community and writing up the project.
Materials
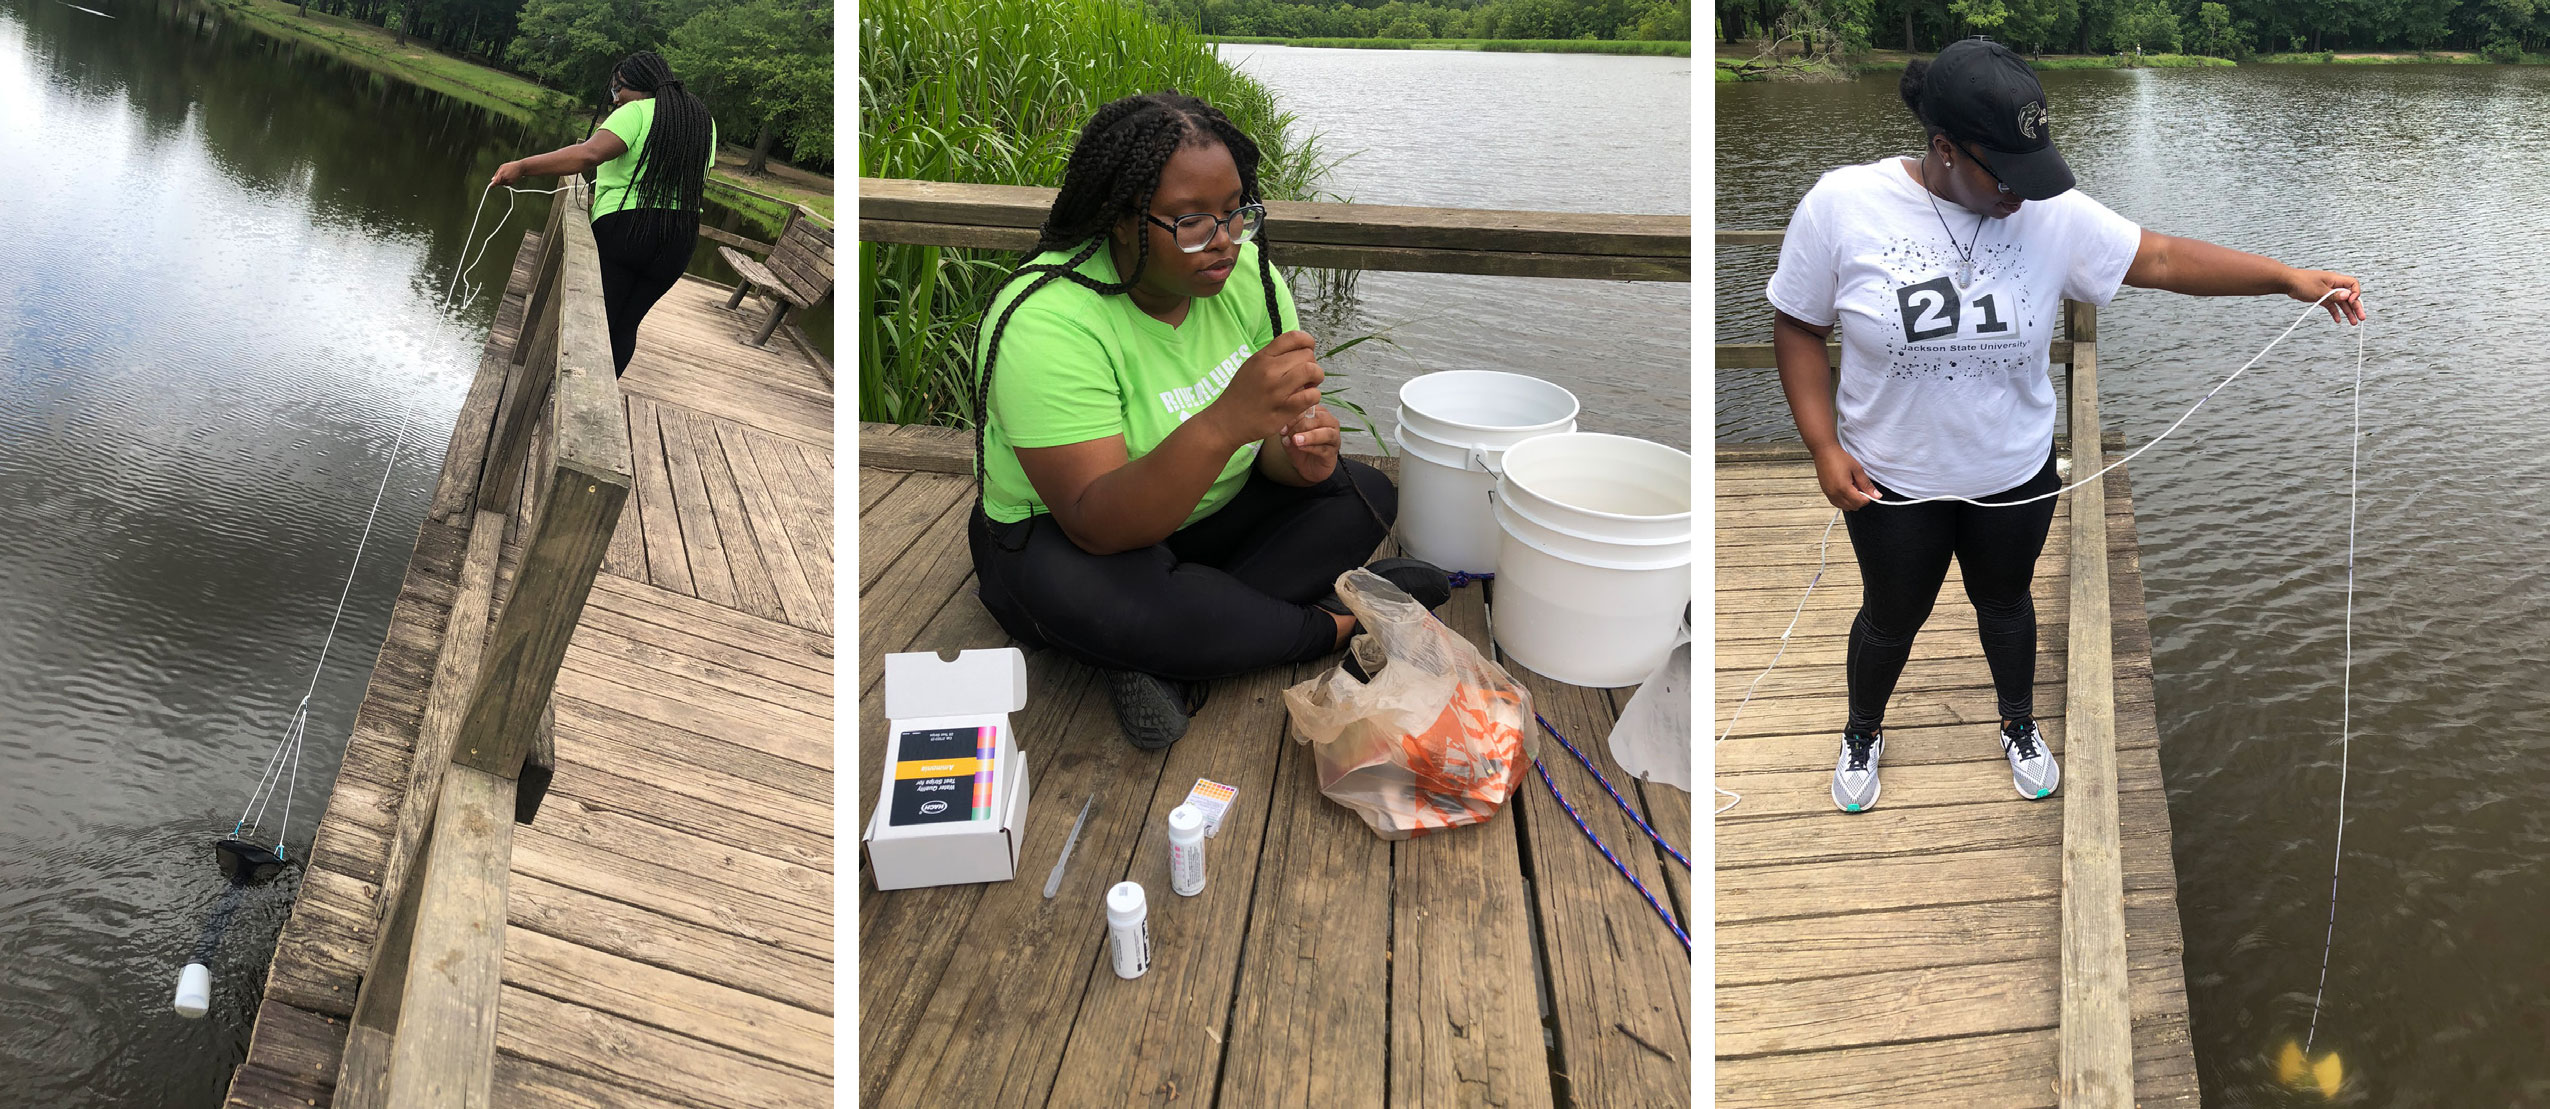
The required materials had to be accessible and affordable (Supplementary Table S2 – 278 KB pdf) and relied heavily on a do-it-yourself approach. It is well established that simple materials can be turned into a meaningful research project or outreach activity in aquatic sciences. A Secchi disk was built based on instructions provided by the Secchi Disk Foundation for its seafarer, citizen Secchi Disk Study (Lavender al., 2017). We added a temperature and light data logger controlled via Bluetooth for mounting on the Secchi disk to record temperature and light profiles during deployment. The recorded light intensity (in Lux) is in the visible light spectrum (400–700 nm), in a range similar to that of photosynthetically active radiation (PAR). A second temperature and light data logger was used for continuous measurements at a fixed outside location (the roof of Miller’s garage) during the entirety of the study (the month of July 2020). In this manner, we collected one continuous data record, purposefully different from the discrete data collected at the sampling sites. We followed Matthew Rossi’s instructions on the Microcosmos Foldscope Community website to build a plankton net (https://microcosmos.foldscope.com/?p=17431). All the items necessary for building the net (e.g., metal ring from an old lampshade, small metal keyrings, nylon stocking, ropes) were found at home by Miller. We provided 200 µm mesh netting, disposable pipettes, and petri dishes. Miller also got a bucket, a rope, and coffee filters from home to complete the material list. Macronutrient concentrations were measured using test strips, including nitrate, nitrite, ammonium and phosphate concentrations, and pH. We agreed that a life vest would always be worn during all sampling and an acquaintance should accompany Miller so that she would not be in the field alone. The plankton community was observed using a secondhand basic microscope (LW Scientific® Revelation III) obtained from an acquaintance of Miller after an inexpensive, digital microscope failed to provide the appropriate resolution. Plankton images were taken directly with a smartphone mounted to the eyepiece of the microscope. Purchase of a headset to improve the quality of our communications rounded out the equipment acquisition. Overall, the costs were <$400. The cost of the project outlined here could have been cut in half with omission of the data loggers, but collection of continuous data supported a key analysis learning goal.
Additional environmental parameters were retrieved from US federal agency monitoring programs during the project. Gauge height and total discharge of the water bodies were obtained from the US Geological Survey National Water Information System (https://waterdata.usgs.gov/nwis). Meteorological data (wind speed, precipitation, and temperature) were retrieved from the NOAA National Weather Service (https://www.weather.gov/).
Sampling Sites and Procedures
We identified three sampling sites (Figure 1) that provided easy and safe access to the water from piers. The main sampling site was the Ross Barnett Reservoir north of Jackson, Mississippi (32°23'20.50''N, 90°2'53.71''W), a major drinking water reservoir that also provides outdoor recreation for central Mississippi. It was identified as a prime sampling location because of previous work carried out on its plankton community (Sthapit et al., 2008; Sobolev et al., 2009). The other two sampling sites, Crystal Lake (32°17'26.02''N, 90°9'34.49''W) and Mayes Lake (32°19'48.19''N, 90°9'34.49''W), two small recreational lakes in Jackson and Flowood, Mississippi, were subsequently selected in order to include different characteristics from the reservoir. Sampling was performed twice a week, depending on weather conditions. The Ross Barnett Reservoir was always sampled, whereas Mayes Lake and Crystal Lake were sampled alternately. Miller obtained data covering the full range of environmental parameters on five occasions between July 9 and July 22, 2020 (Figure 2). She sampled the Ross Barnett Reservoir five times and Crystal and Mayes Lakes twice each.
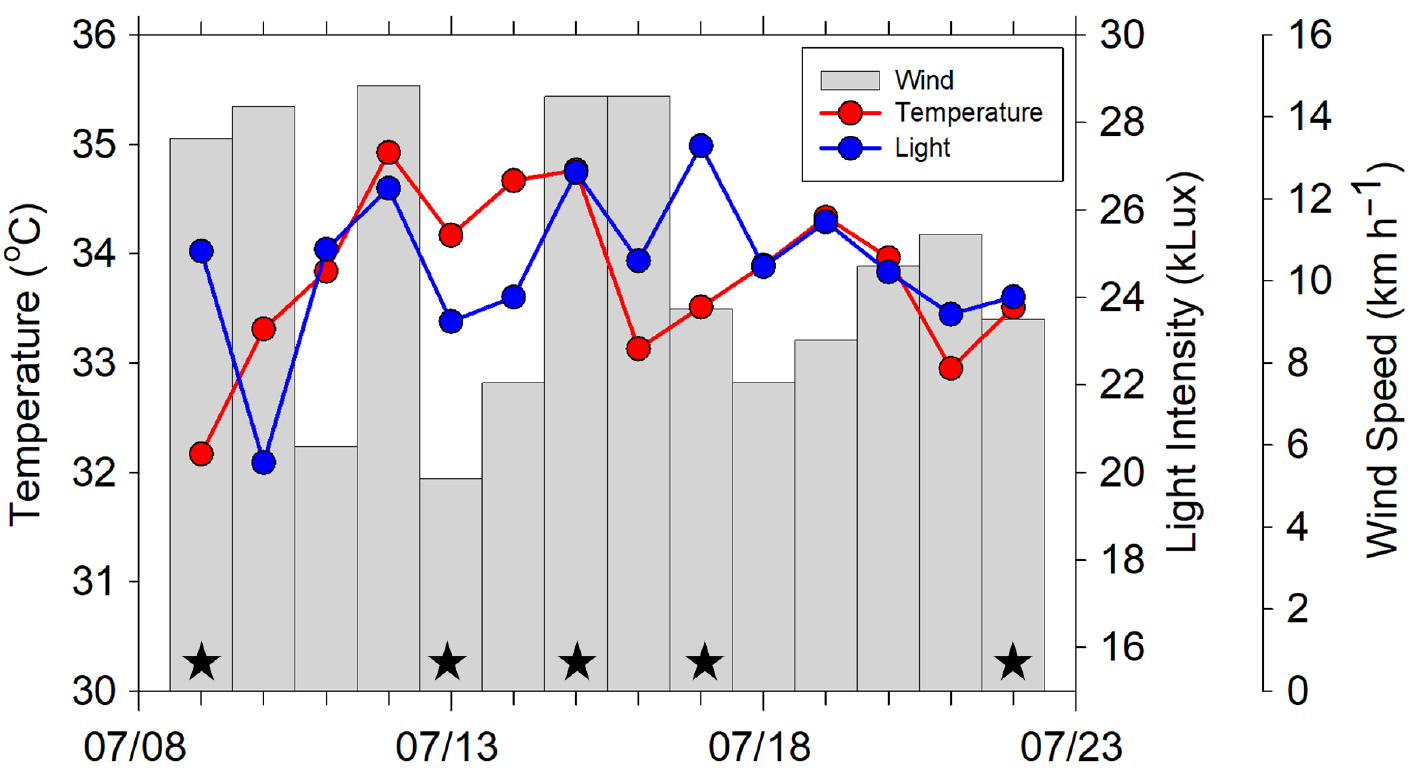
Figure 2. Mean daily outdoor temperatures (red dots and line), light intensity (blue dots and line), and wind speed (gray bars) in central Mississippi during the month of July 2020, with sampling dates indicated (black stars). > High res figure
|
Before departing for a sampling trip, Miller would alert members of her family and her remote mentors about the sampling duration and location and would contact everyone again upon completion. Each sampling trip was conducted with one additional person, a family member or a friend of Miller, for safety. Air temperature and light intensity were recorded upon arrival at each sampling site. Other environmental indicators such as wind conditions, wind direction, water surface and waves, water scent, and water color were also recorded. Total depth, Secchi disk depth, and temperature and light profiles were measured simultaneously using the homemade Secchi disk equipped with a mounted temperature and light data logger. Profiles were taken by deploying the Secchi disk at 0.1 m intervals for 10 seconds from the surface down to 1 m depth and at 0.5 m intervals after the first meter down to the bottom. The light attenuation coefficient (Kd, m–1) was determined from the linear relationship of the natural logarithm of light intensity against depth according to the Beer-Lambert-Bouguer law (Equation 1):

where Iz is the light intensity (lux) at depth z (m) and I0 the light intensity just below the surface (lux).
Miller collected water samples using a bucket from the surface. She measured nitrate, nitrite, ammonium, phosphate, and pH using the test strips. Sampled water was transferred into a one-gallon (3.785 L) plastic bottle through a 200 µm mesh net fixed at the end of a funnel to remove large zooplankton. The plastic bottles containing samples were kept on ice in a dark cooler until transported to Miller’s home. Plankton samples were not preserved to avoid safety complications in handling hazardous materials. To increase plankton concentration and facilitate sufficient sample acquisition, one-gallon samples were concentrated using a coffee filter, ensuring a sufficient volume of water to keep specimens afloat above the filter. Ten milliliters of the concentrated sample were pipetted into a petri dish, and a maximum of four drops of vinegar were added to observe plankton cells under the microscope by limiting their movement. The volume concentration was done precisely to maintain quantitative accuracy of the counts.
Plankton Image Analysis
With remote guidance and support from a mentor (author Marrec), Miller analyzed plankton images using a MATLAB routine developed for automated analysis. A micrometer ruler was used to convert pixels to size. Over 1,300 raw photographs were taken during the study. The raw images were first adjusted to enhance the contrast of the pictures and to reveal the color of the plankton cells. Then images of plankton cells were automatically cropped and their associated size properties (height, width, and area) were retrieved. After manual selection of all raw cropped photographs, we obtained a total of 100–200 individual plankton photographs, with associated size properties for each sampling site and day. While we used the URI-supplied MATLAB license, it is worth noting this basic image analysis can easily be performed using open access programing languages such as R or Python or using the dedicated image processing library provided by MorphoCut (https://morphocut.readthedocs.io/en/stable/).
Data Analysis and Interpretation
After each sampling day, Miller retrieved data from the data logger, maintained the database, and stored all images taken on a shared drive. Data management was an essential part of the project. The SURFO student had the opportunity to work with NES-LTER (North East Shelf Long Term Ecological Research) information manager Stace Beaulieu of Woods Hole Oceanographic Institution to better understand the challenges associated with data management.
The light profiles obtained during Secchi disk deployment represented a good introduction to aquatic optics. We were impressed by the quality of the light profiles obtained by the concocted Secchi disk light and temperature “profiler.” The simple system permitted excellent characterization of the water column physical (temperature) and optical (light attenuation as a proxy of chlorophyll a concentration) properties, and it represented an inexpensive and efficient alternative to a CTD profiler. In situ light data were well approximated by Equation 1 (Figure 3) and enabled robust estimates of the light attenuation coefficient Kd. As light availability is a key driver of phytoplankton dynamics, profiles of light availability (%) were computed from the Kd values for each sampling site and date to compare water column optical properties. Finally, we observed a significant linear correlation between Secchi disk depths and Kd values (n = 9, R2 = 0.80), which highlighted the strength of using this simple device. Secchi disk depth has been used by many aquatic biologists as a useful and informal visual index of the trophic activity, or trophic status index (TSI), of a lake or oceanic region (Carlson, 1977; Preisendorfer, 1986; Lavender et al., 2017; Pitarch, 2020). Following established relationships, we were able to estimate chlorophyll a and phosphorus concentration from Secchi disk depth (Carlson, 1977). Measurements of phosphorus concentrations observed using test strips were in the same range as phosphorus concentrations estimated from the Secchi disk depths.
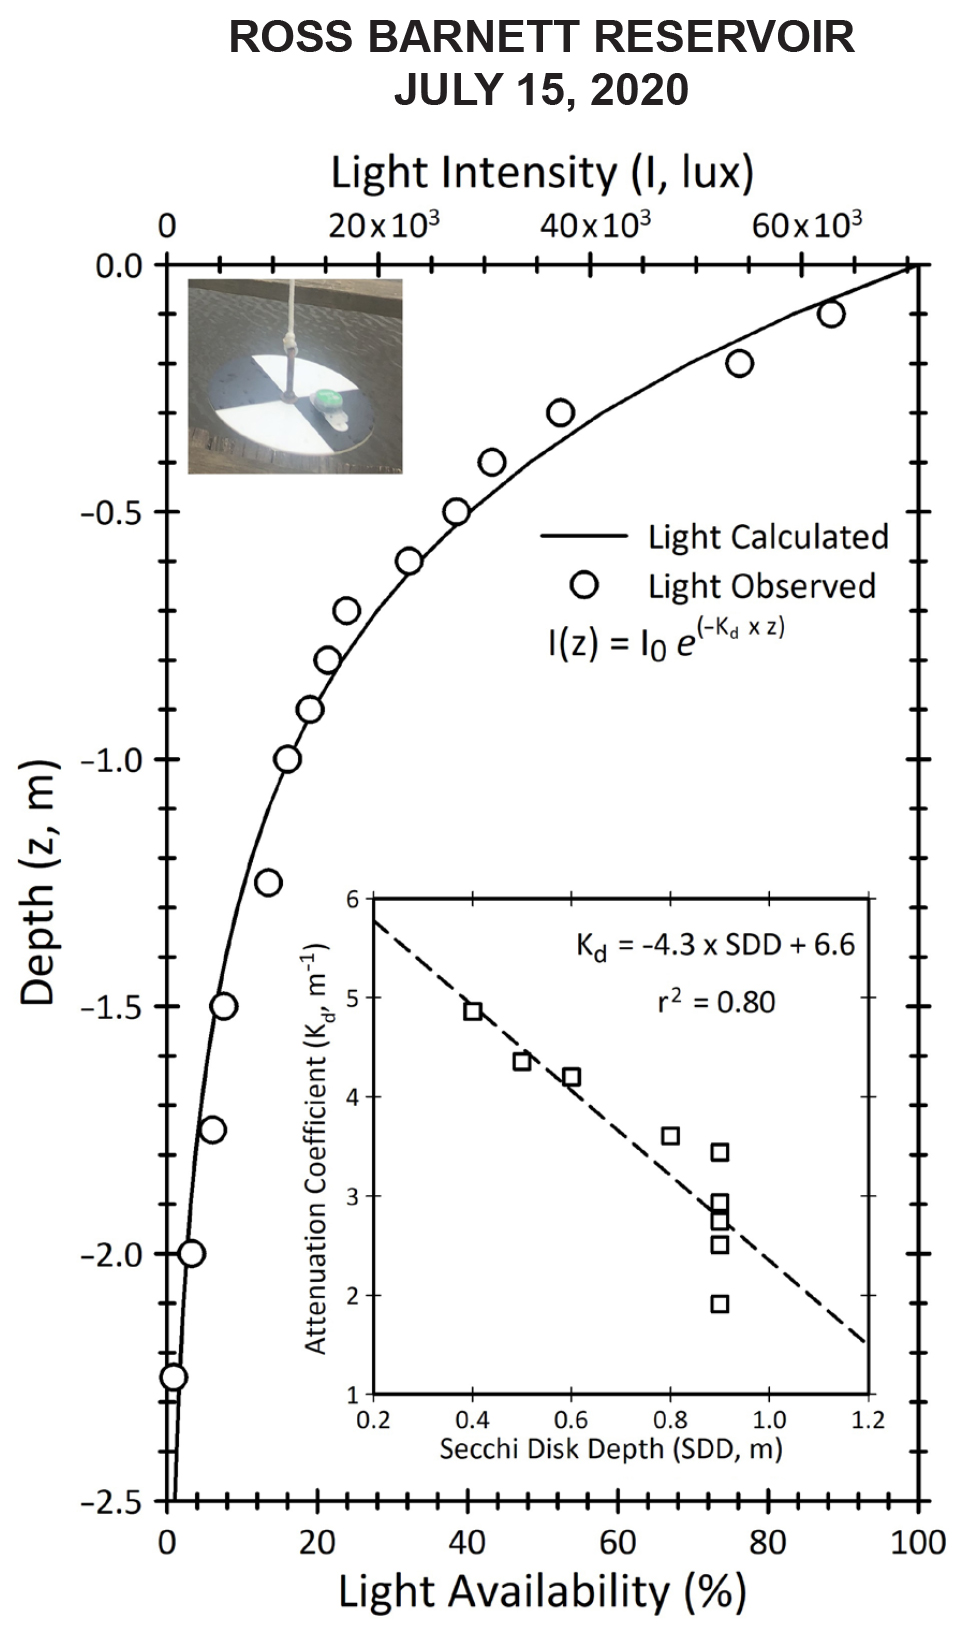
Figure 3. Light attenuation in the Ross Barnett Reservoir on July 15, 2020, as measured with a lux-meter (HOBO) attached to a homemade Secchi disk (top left inset). The data inset represents the linear regression obtained between Secchi disk depth (m) and light attenuation coefficient Kd (m–1) computed from the light profiles using Equation 1. > High res figure
|
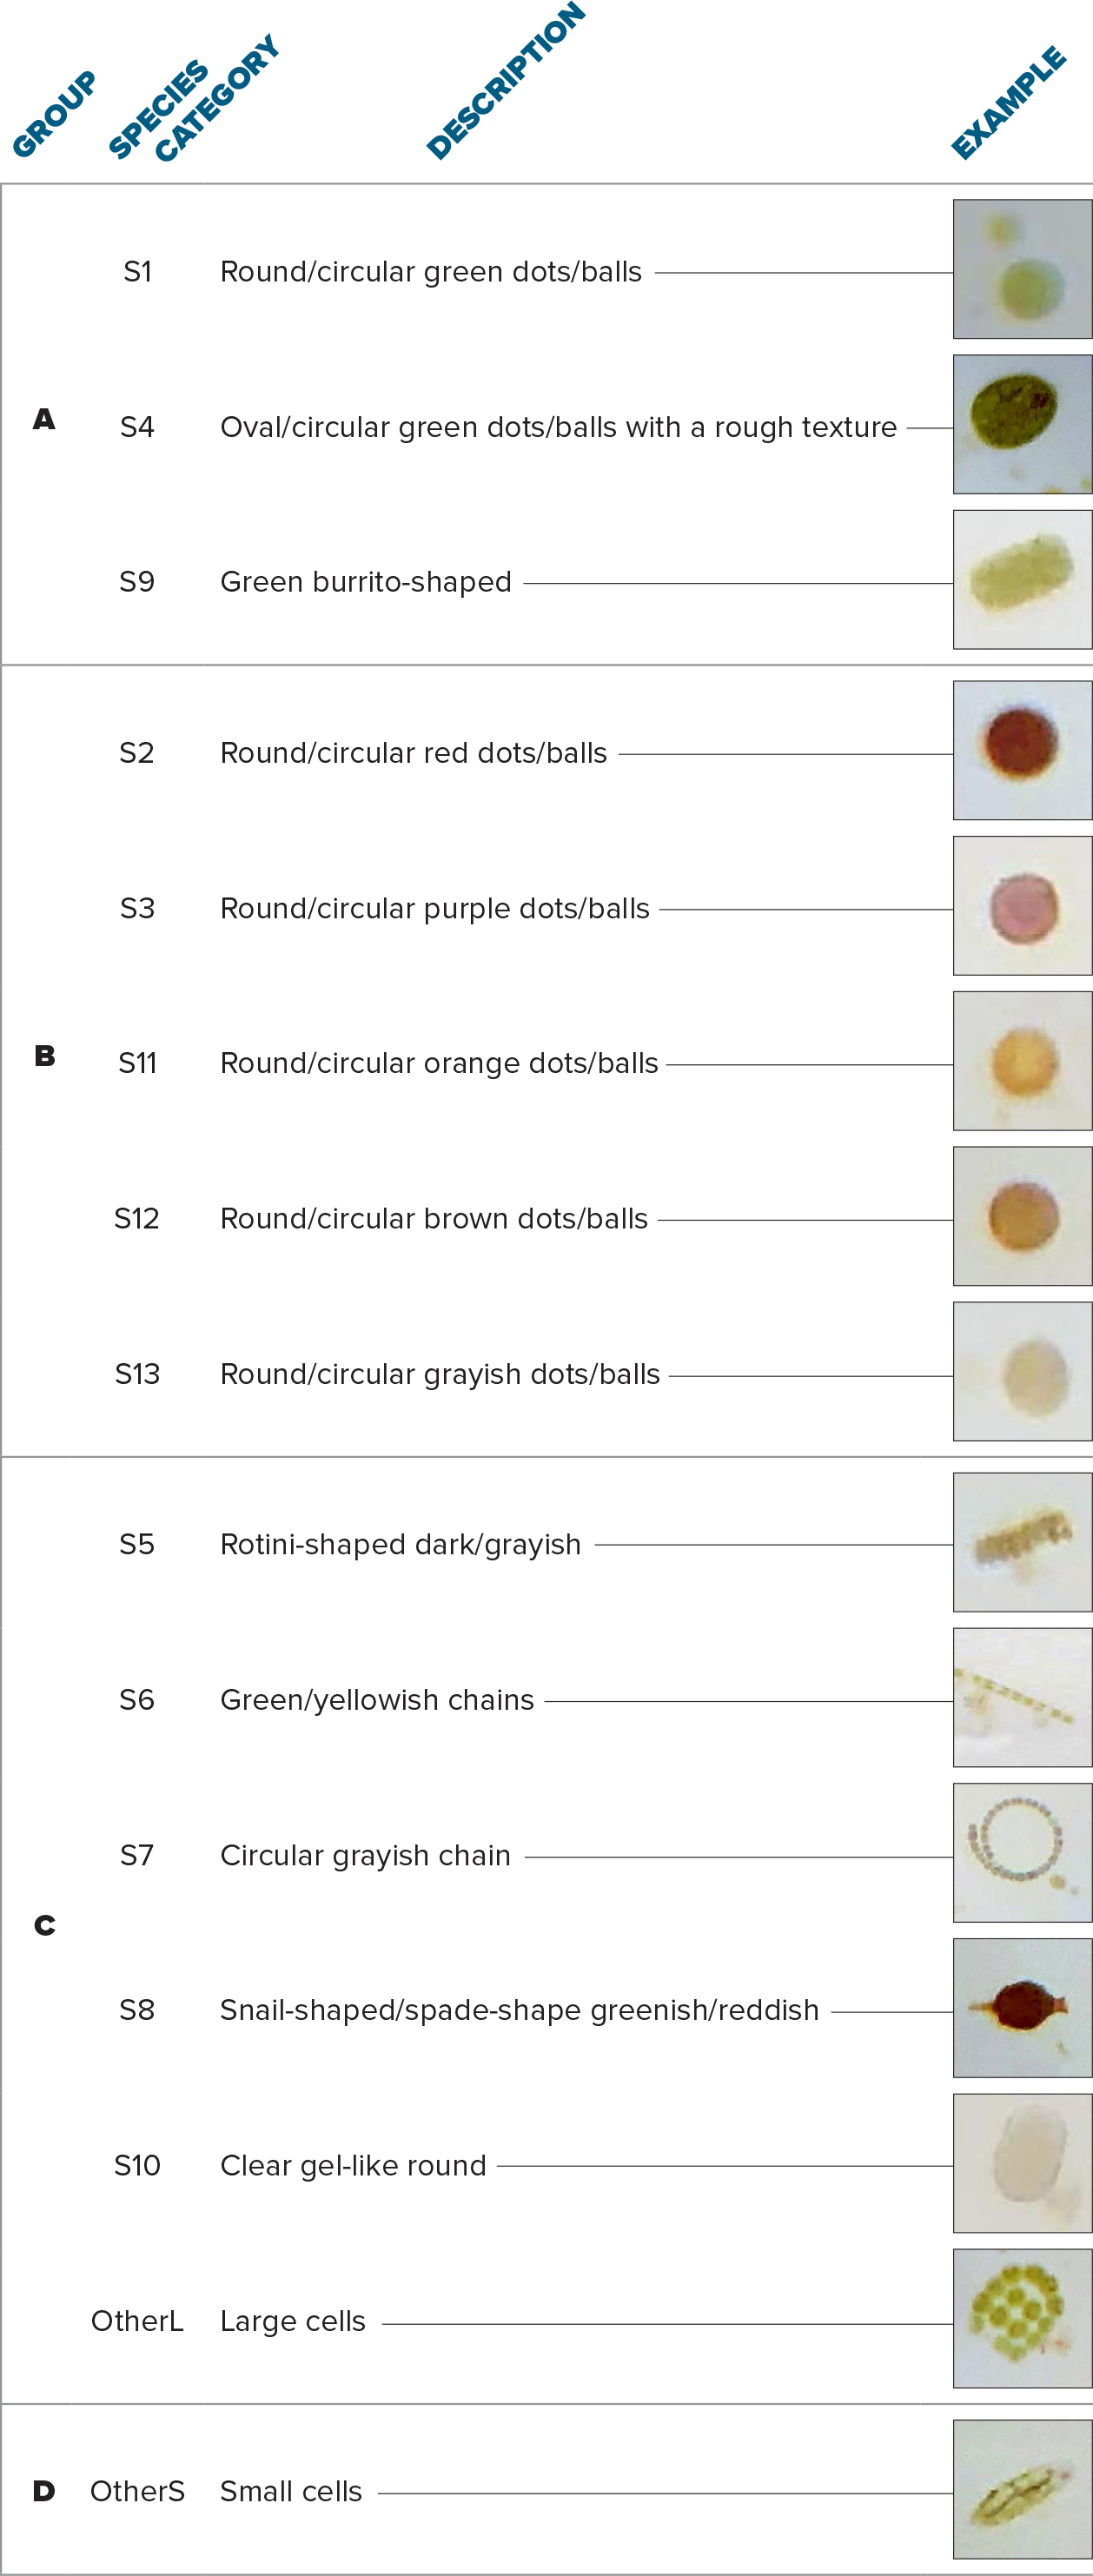
Observed plankton cells were sorted into 15 categories by color, shape, and size (Figure 4, Table 1). While building taxonomic expertise was not an explicit goal of the project, we did aim to have a high-quality data set and leveraged similarities among species categories to combine them into four groups. Group A represented small green cells; Group B was composed of red, brown, and purple cells; Group C comprised cells with special shapes and larger sizes; and Group D represented the other small (OtherS) cells observed during our study. The categorization was sufficient to document that the plankton community structure, based on the four groups, varied among sampling sites both in terms of abundance and composition. Moreover, monitoring of the Ross Barnett Reservoir on five occasions provided clear indications of the temporal variability of the plankton community structure.
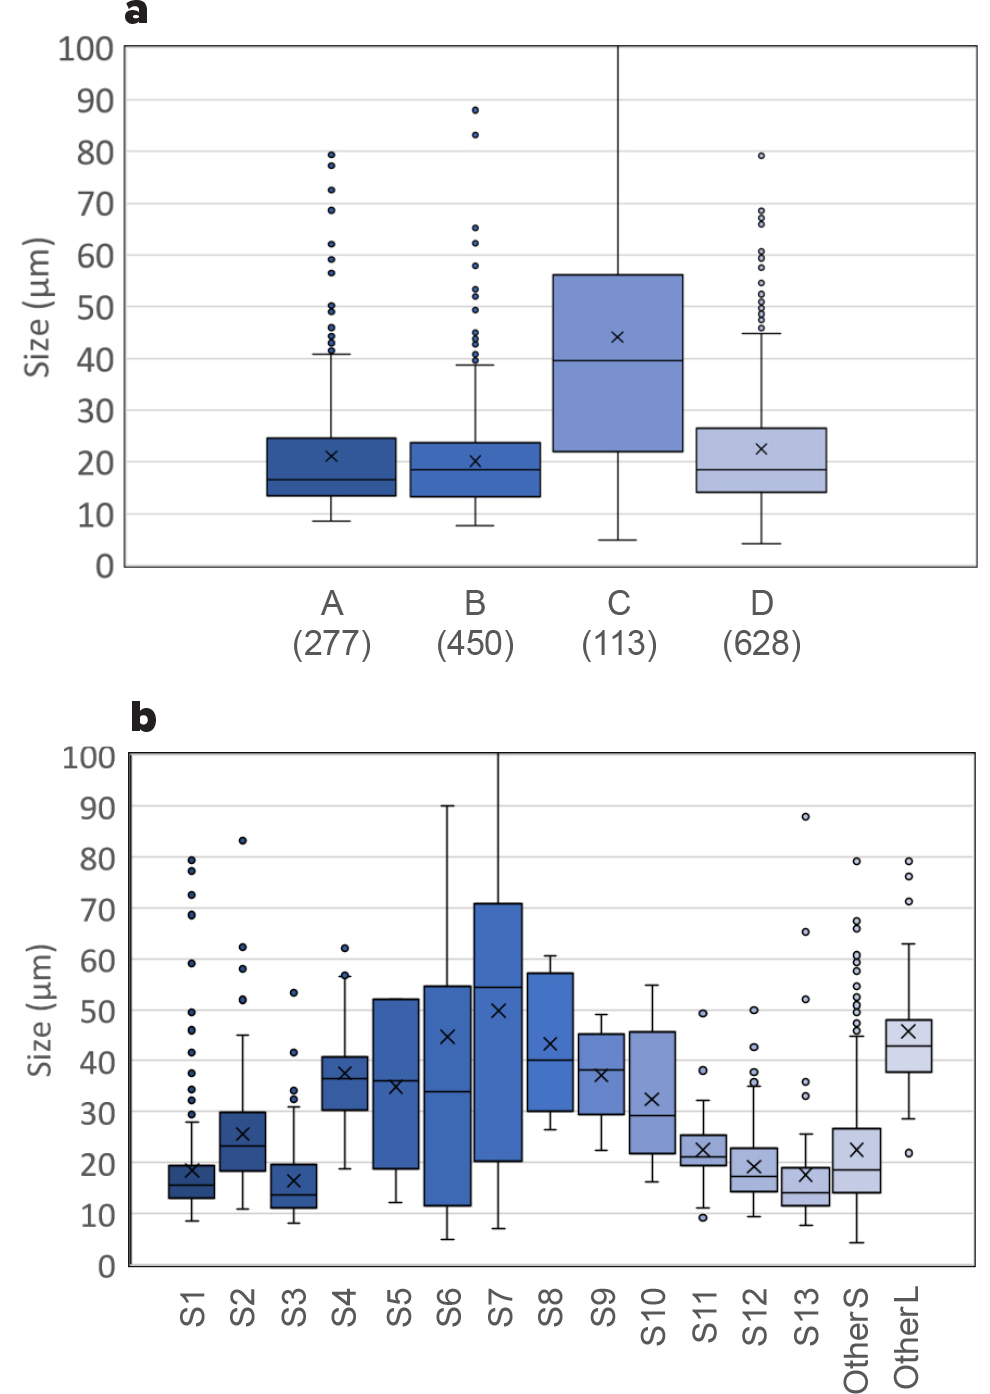
Figure 4. (a) Box plot of A, B, C, and D group sizes (µm) corresponding to the height/length of the cell. The number for each category indicates sample size. (b) Box plot of category sizes (µm). Refer to Table 1 for group and category identification. The boundary closest to zero indicates 1st quartile, the black line within the box marks the median, the x indicates the mean, and the boundary furthest from zero is the 3rd quartile. Error bars represent the lowest and largest data points, excluding any outliers, and outlying points are represented. > High res figure
|
Table 1. Classification of organisms based on shape, color, and size. Taxonomic identification was deliberately avoided due to limited observation capacity. > High res table
|
 |
The scientific goal of this research was to investigate linkages between plankton community structure and environmental conditions using multivariate statistical techniques. For pedagogical purposes, we stepped through this process by first establishing paired relationships. This allowed Miller to discover that the highest plankton abundances were observed during peak wind conditions, and led her to ask the question: what were the relationships among the studied parameters? Further analysis resulted in a correlation matrix representing the Pearson’s correlation coefficients between each variable (Figure 5). During the study, wind was observed to be the main environmental driver of the plankton community, with the highest abundances occurring during high wind events. The water column at the Ross Barnett reservoir was stratified, with warm surface waters having low nutrient concentrations. Presumably, during high wind events, the water column became mixed, bringing nutrients to the surface from bottom waters. This new nutrient supply likely favored the growth of phytoplankton, which in the absence of predation would increase in concentration. The research effort was not necessarily aiming to reveal the underlying mechanisms of plankton dynamics but rather to reveal testable hypotheses. Even by adopting a simplistic approach for plankton identification, Miller was able to assess essential aspects of plankton ecology, such as identifying how different environmental variables can affect plankton abundance and community composition.
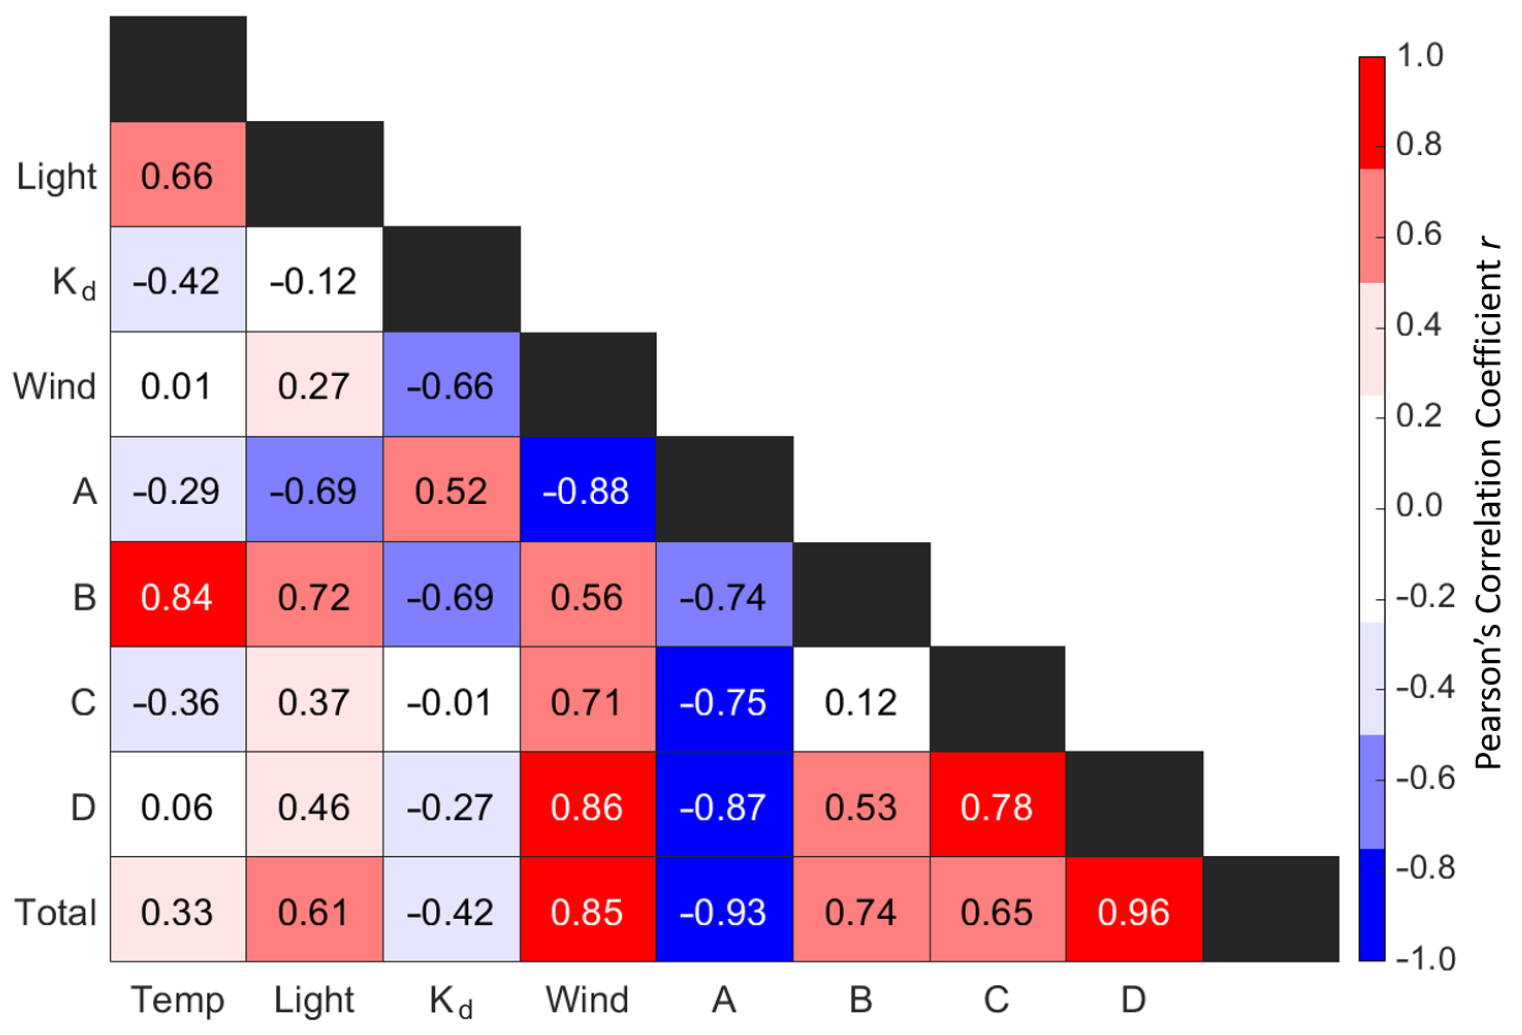
Figure 5. Pearson’s coefficients quantifying associations between environmental conditions (temperature, light intensity, Kd, and wind) and plankton community structure (abundances of Groups A/B/C/D and total abundance). > High res figure
|
Concluding Remarks
Based on the unique achievements of this project, Miller has been selected to participate in the virtual ASLO Aquatic Sciences meeting in Palma de Mallorca, Spain, in June 2021 to show that hands-on research training can be performed safely during a pandemic with limited and affordable materials. Most importantly, we were forced to identify key learning objectives and had the opportunity to turn challenges into achievements.
The 2020 SURFO students were grateful for the opportunity to participate in the REU experience, although all would have preferred an in-person program. They missed cohort interactions and integration into the Bay Campus community. However, the experience showed that some opportunities can be easily changed to a remote instruction model and provided ideas for outreach, for example, to high school or college groups that do not typically gain exposure to oceanography. The project outlined here could easily be part of a semester course in aquatic ecology. Additionally, the virtual approach could benefit future REU students under circumstances that prohibit in-person participation.
Refocusing a project as we did under pandemic circumstances demonstrates that compromising some aspects of a research question (e.g., replacing marine with freshwater) can still expose the student to the process of formulating a scientific question and nurture the development of fundamental research skills. The virtual approach was beneficial for the student, as she was able to develop an independent project with remote guidance. The DIY approach provided Miller with the confidence to claim ownership of the work accomplished and involved the development of many soft skills, such as budget and time management, creativity, adaptability, and communication. It was a unique opportunity for empowerment. In this manner, this virus has helped us focus on the essentials, which will promote continued delivery of a high caliber REU program at URI-GSO.
Acknowledgments
Andria Miller was supported by a Summer Undergraduate Research Fellowship in Oceanography (SURFO), National Science Foundation REU grant OCE-1950586. Pierre Marrec was supported by the National Science Foundation Long Term Ecological Research program at the North East Shelf site, NES-LTER, grant # 1655686. Further support came from a National Science Foundation Biological Oceanography OCE-1736635 grant to SMD. We thank Lisa Rom, the program manager of the National Science Foundation - Ocean Sciences Site REU program for facilitating a remote but hands-on summer REU. The contributions of David Smith and Brian Heikes, SURFO coordinators and project PIs, are appreciated, as is input from information manager Stace Beaulieu (Woods Hole Oceanographic Institution) within the NES-LTER. We are very grateful to the three anonymous reviewers for improving the overall quality of the manuscript and to the editorial team of Oceanography for their support.