Full Text
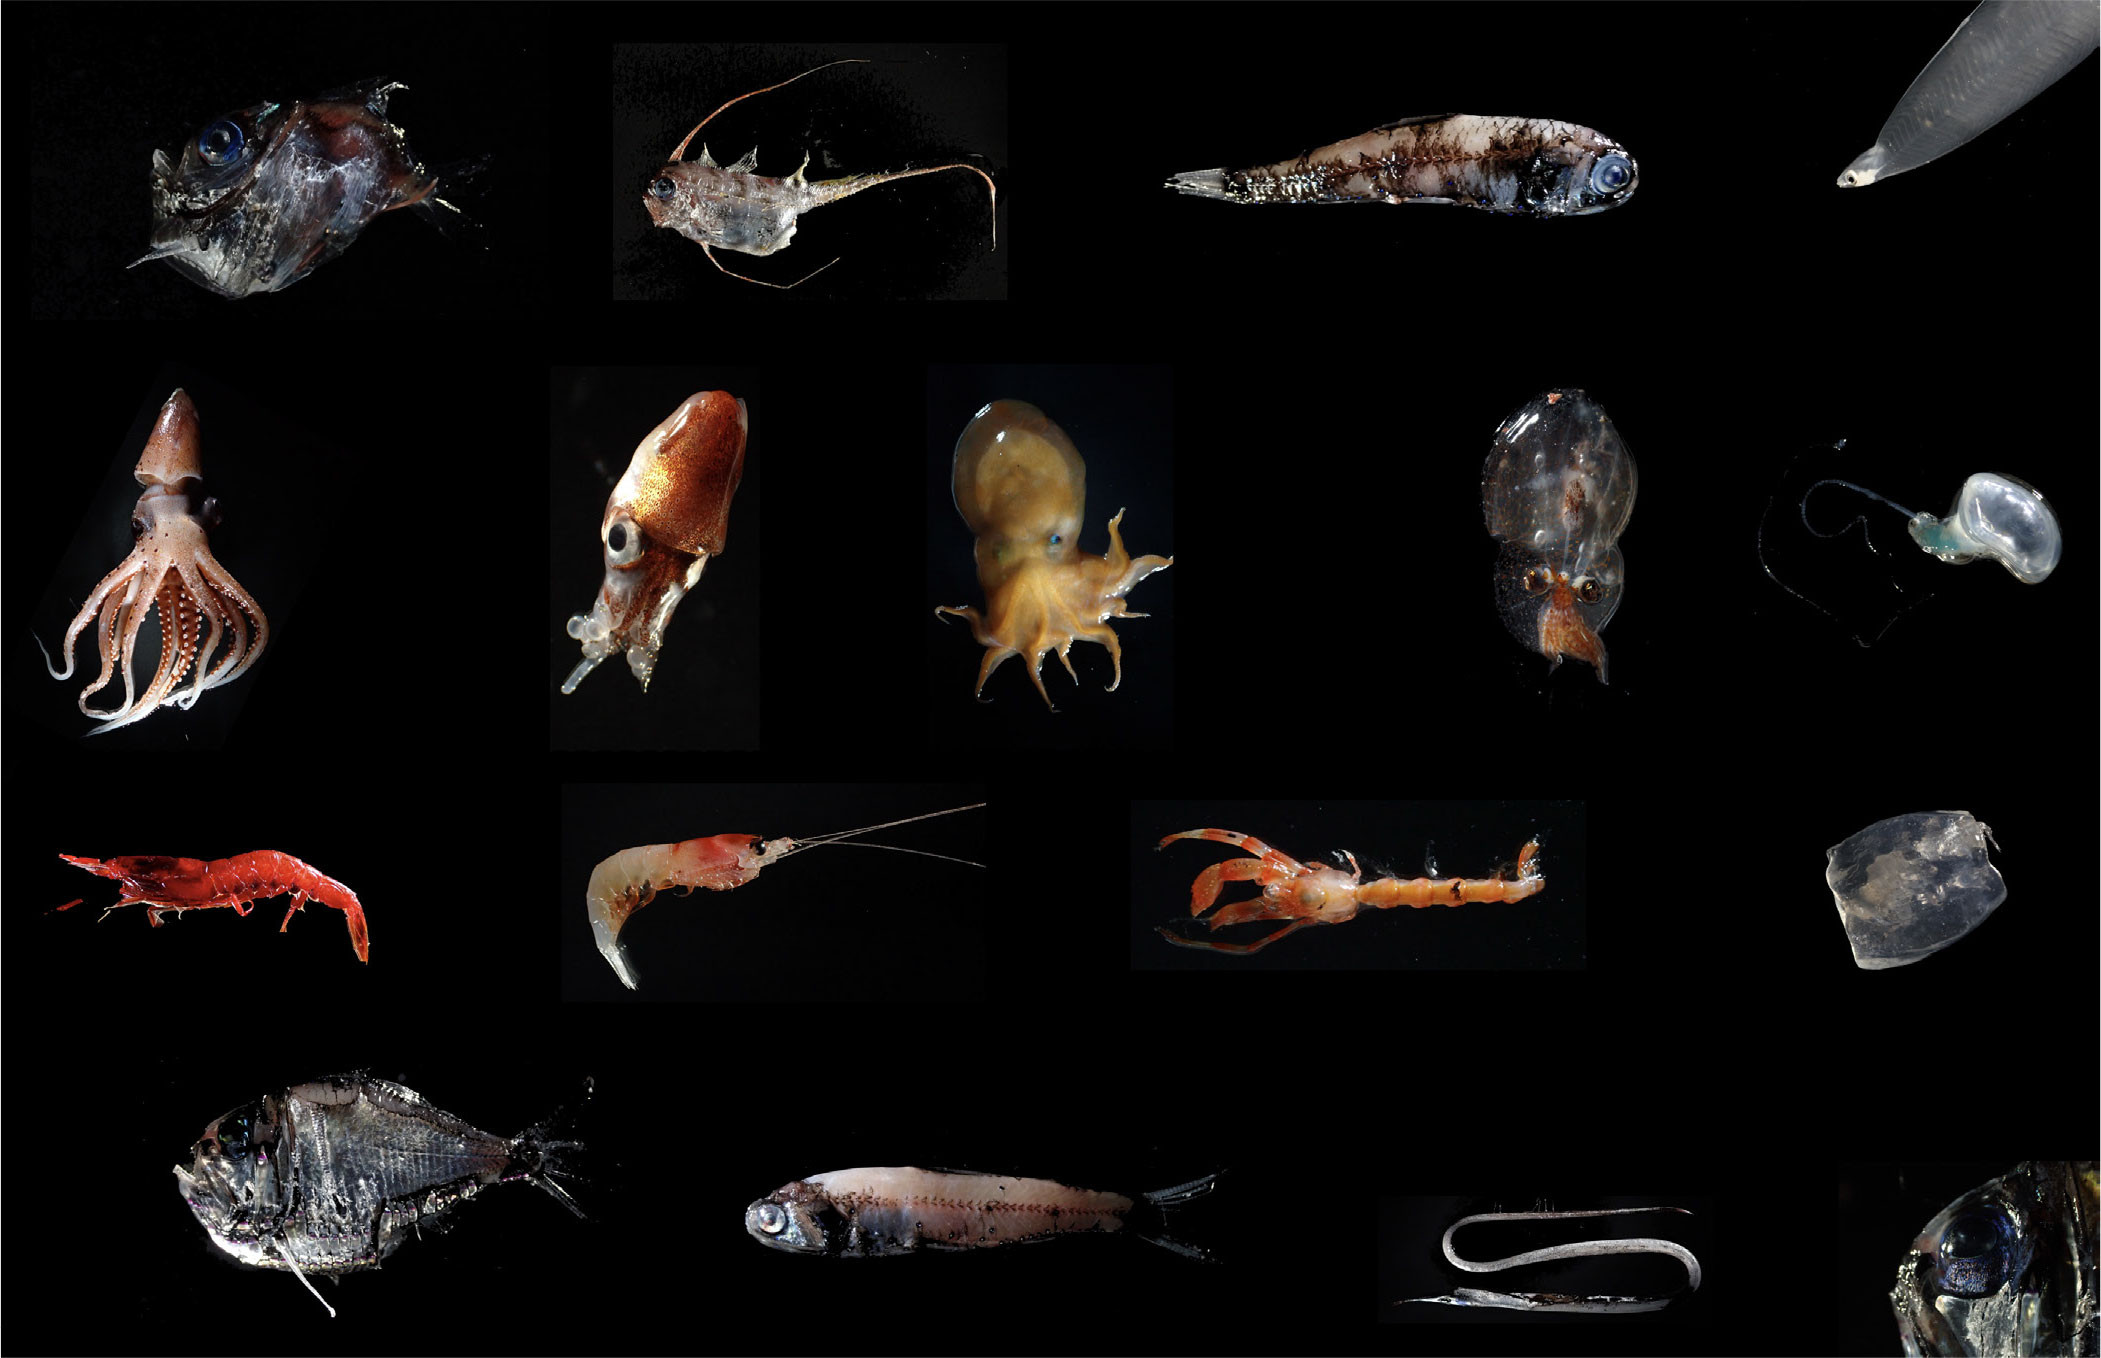
Micronekton consist of crustaceans, cephalopods, gelatinous organisms, and fishes that are 2–20 cm in size (Figure 1). These organisms have unique functional traits that impact their vertical migration patterns and ecosystem processes (Aparecido et al., 2023). Our understanding of their potential carbon transport and sequestration from the epipelagic (upper 200 m) to mesopelagic zones (200–1,000 m) or deeper (e.g., Boyd et al., 2019; Le Moigne, 2019; Cavan et al., 2019) is limited by the tools traditionally used to assess their biomass, diversity, and varied migration patterns (e.g., Annasawmy et al., 2019, 2024; Barbin et al., 2024; Eduardo et al., 2024). These knowledge gaps are notable considering that micronekton are ubiquitous throughout the world ocean.
|
|
Major Uncertainties in Micronekton Research
After 200 years of oceanography, the answers to the following major questions remain incomplete due to the limitations of existing conventional approaches used to investigate micronekton such as trawl (and net) sampling and active acoustics:
- What is the global biomass of micronekton?
- What are their ecological patterns, including species richness, functional diversity, and vertical migration?
- What is their role in the biological carbon pump?
Biomass and biodiversity estimates of mesopelagic communities in the ocean vary by an order of 5 to 58 (e.g., Kloser et al., 2009; Irigoien et al., 2014; Dornan et al., 2022) because of net selectivity and catchability limitations (Annasawmy et al., 2019; Kwong et al., 2022; Barbin et al., 2024) and because active acoustics lack taxonomic resolution and do not give direct biomass measurements. Novel eDNA methods offer the potential to fill in knowledge gaps in micronekton diversity and distribution left by traditional tools. However, variations in eDNA sampling collection and analysis methods may influence results and conclusions (Govindarajan et al., 2023a). To bridge the current methodological gaps and for global-scale comparisons, it is crucial to construct open access micronekton DNA reference libraries, establish consensus on optimal primers for detecting micronekton, and integrate eDNA with active acoustics and trawls.
Although contemporary eDNA methods can detect species presence and absence (Govindarajan et al., 2023b), they often rely on ship-based platforms (similar to shipborne active acoustics and nets) that offer only limited temporal and spatial sampling resolutions. When autonomous platforms are used, knowledge and expertise are currently restricted to larger, northern institutions, generally limiting scientists from the Global South from participating as leaders in deep-sea research (Bell et al., 2023). Research on the biological carbon pump is primarily focused on planktonic organisms and concentrated in the Global North (Pacific and Atlantic Oceans), leaving substantial geographical gaps in the Southern Hemisphere (Kwong et al., 2022; Yang et al., 2024). Technological and geographical gaps in deep-sea research constitute major knowledge gaps, resulting in significant uncertainties regarding the role of micronekton in the biological carbon pump, and, consequently, in climate regulation (Pillar et al., 2024).
Case Study: Project NEAT and the Integration of Traditional and Contemporary Tools
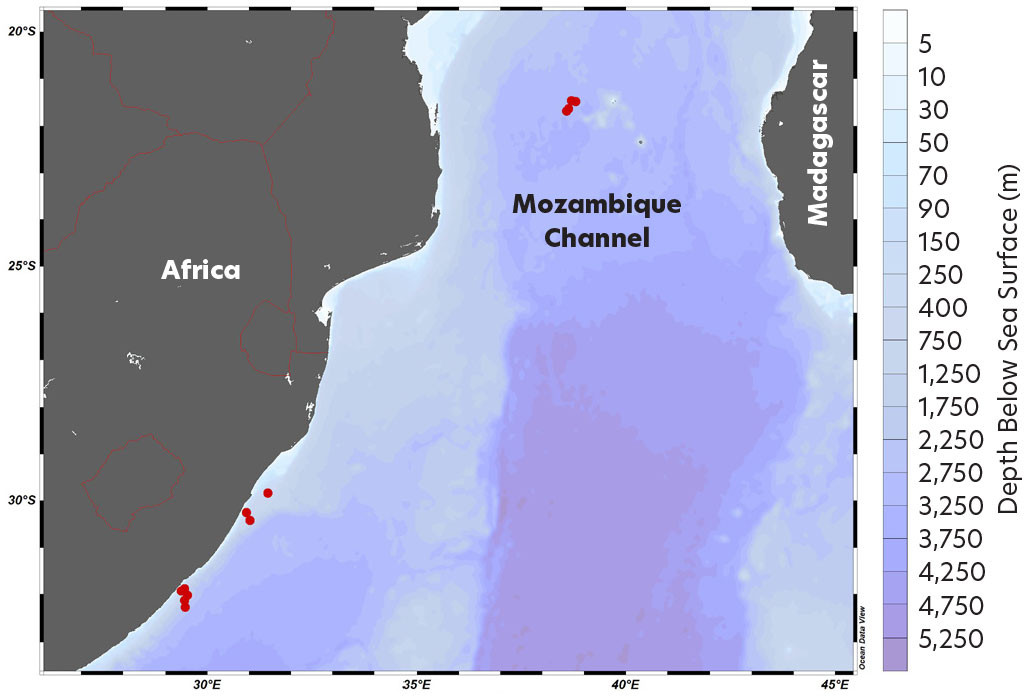
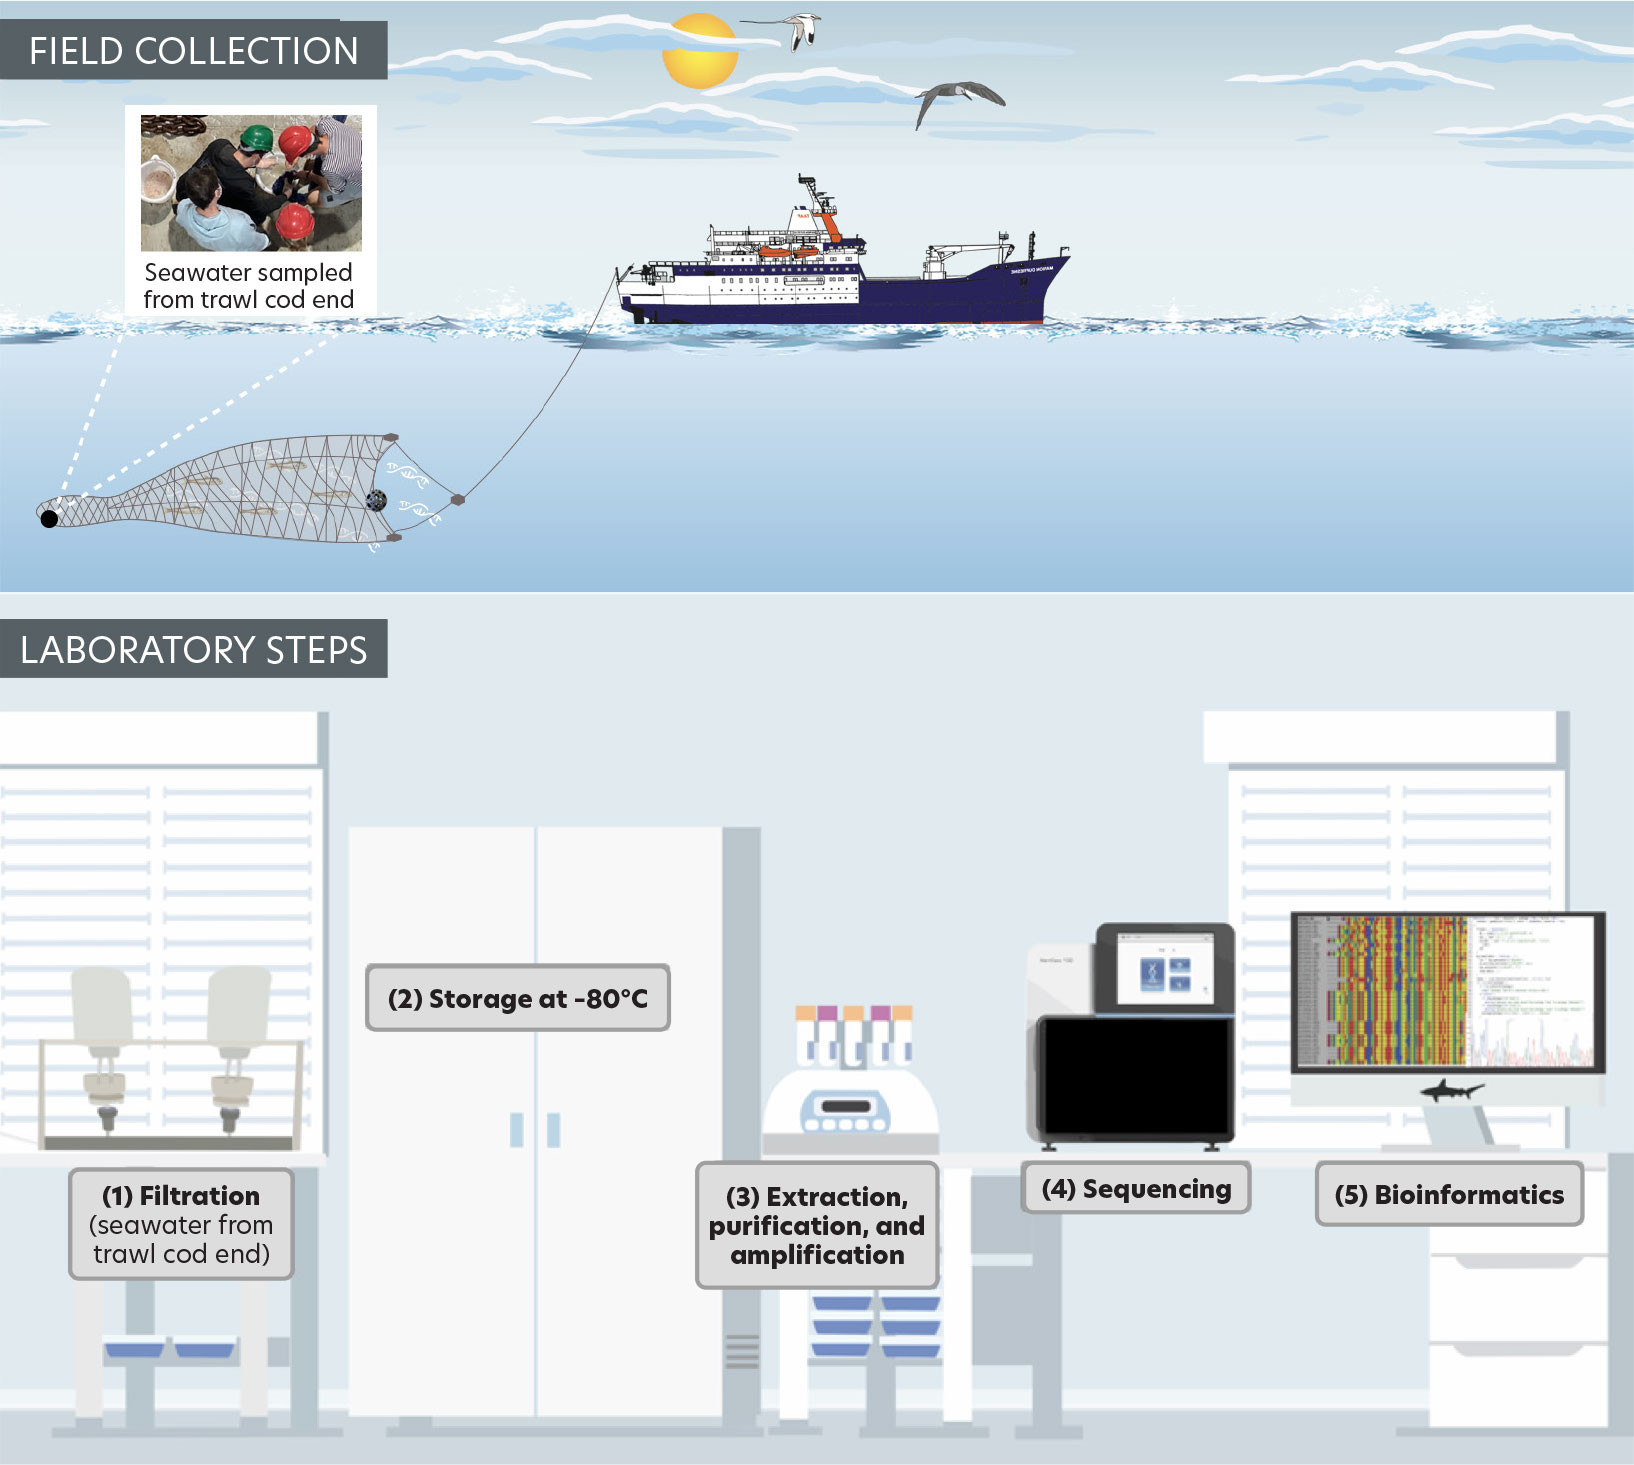
The project NEAT, funded by the European Marine Research Network (EuroMarine), investigates micronekton ecology in the Western Indian Ocean. Samples were collected in April to May 2022 during the RESILIENCE (fRonts, EddieS and marIne LIfe in the wEstern iNdian oCEan) cruise (Figure 2). The project objective was to integrate the eDNA, acoustic, and trawl data collected to investigate the diversity, abundance, biomass, and distribution of micronekton in the Western Indian Ocean. Migration patterns of the different species were not assessed due to the unbalanced trawl and eDNA sampling designs.
|
|
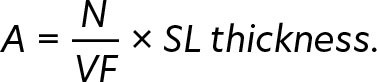
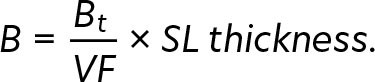
Micronekton specimens were collected using a Mesopelagos trawl net (mean vertical opening: 7 m; horizontal opening: 12 m; mouth area: 65 m2; length: 44 m; mesh nettings: 30 mm at the front and 4 mm at the cod end) towed at a ship speed of approximately 1.2 knots for a fishing duration of 30 min and at a maximum depth of 70 m. Specimens were divided into four broad categories: fishes, crustaceans, cephalopods, and gelatinous. Wet weight measurements of each broad category were recorded. Organisms are being identified to the lowest taxonomic level possible at the CITEB laboratory (Centre technique, de recherche et de valorisation des milieux aquatiques, Reunion Island). Organism abundance (A, ind. m–2) was calculated using the number of individuals captured in each tow (N), volume of water filtered (VF; m–3), and the thickness of the scattering layer (SL thickness of 20 m) according to Kwong et al. (2022):
 |
Dry mass was calculated from wet mass using the percentage water content from each broad category according to Cotté et al. (2022): 75% for fishes and crustaceans, 80% for cephalopods, and 94% for gelatinous organisms. The percentage of C in dry mass was also calculated for each group according to Cotté et al. (2022) as follows: 50% for fishes, 40% for crustaceans, 35% for cephalopods, and 15% for gelatinous organisms. The biomass (mgC m-2) was calculated using the total biomass (Bt) of each broad category per net tow, VF and SL thickness according to Kwong et al. (2022):
 |
Seawater from the trawl net cod end was filtered on Millipore cellulose filters of 47 mm diameter and 0.45 μm pore size. The filters were stored at −80°C before being analyzed using the “MiFish-E” primer amplifying a 170 bp fragment of the 12S rRNA gene (Miya et al., 2015), and the “mlCOIintF” primer targeting a 313 bp fragment of the COI (mitochondrial Cytochrome c Oxidase subunit I) gene (Leray et al., 2013). Metabarcoding analyses were conducted at the ADNId laboratory (Montpellier, France). Bioinformatics were conducted using the FROGS pipeline (Escudié et al., 2017; Figure 3). Sequences were clustered into operational taxonomic units (OTUs) using the SWARM v2.1.10 algorithm (Mahe et al., 2015).
|
|
In an effort to identify the organisms reflecting the transmitted sound waves, and layers of scattering organisms, a backscatter classification approach based on pairwise frequency differences (Sv18-38, Sv70-38, and Sv120-38), called the Ellipsoid score (Escore) algorithm, was developed and used to classify the multifrequency acoustic data (18, 38, 70, 120 kHz) collected using a shipborne SIMRAD EK80 echosounder (Annasawmy et al., 2024). Annasawmy et al. (2024) describe the Escore algorithm in more detail, and the open access code and manual for its implementation are available through the IRD (Institut de recherche pour le développement) Forge website.
The Escore algorithm classified the RESILIENCE cruise acoustic backscatter into groups corresponding to zooplankton-like organisms (echo-class 1); small gelatinous organisms (e.g., siphonophores with pneumatophores) and small gas-bearing fishes of juvenile stages (echo-class 2); organisms with gas bubbles, siphonophores with pneumatophores, and gas-filled swimbladdered mesopelagic fish (echo-class 3); and siphonophores of small sizes (echo-class 4) (Annasawmy et al., 2024; Figure 4).
|
|
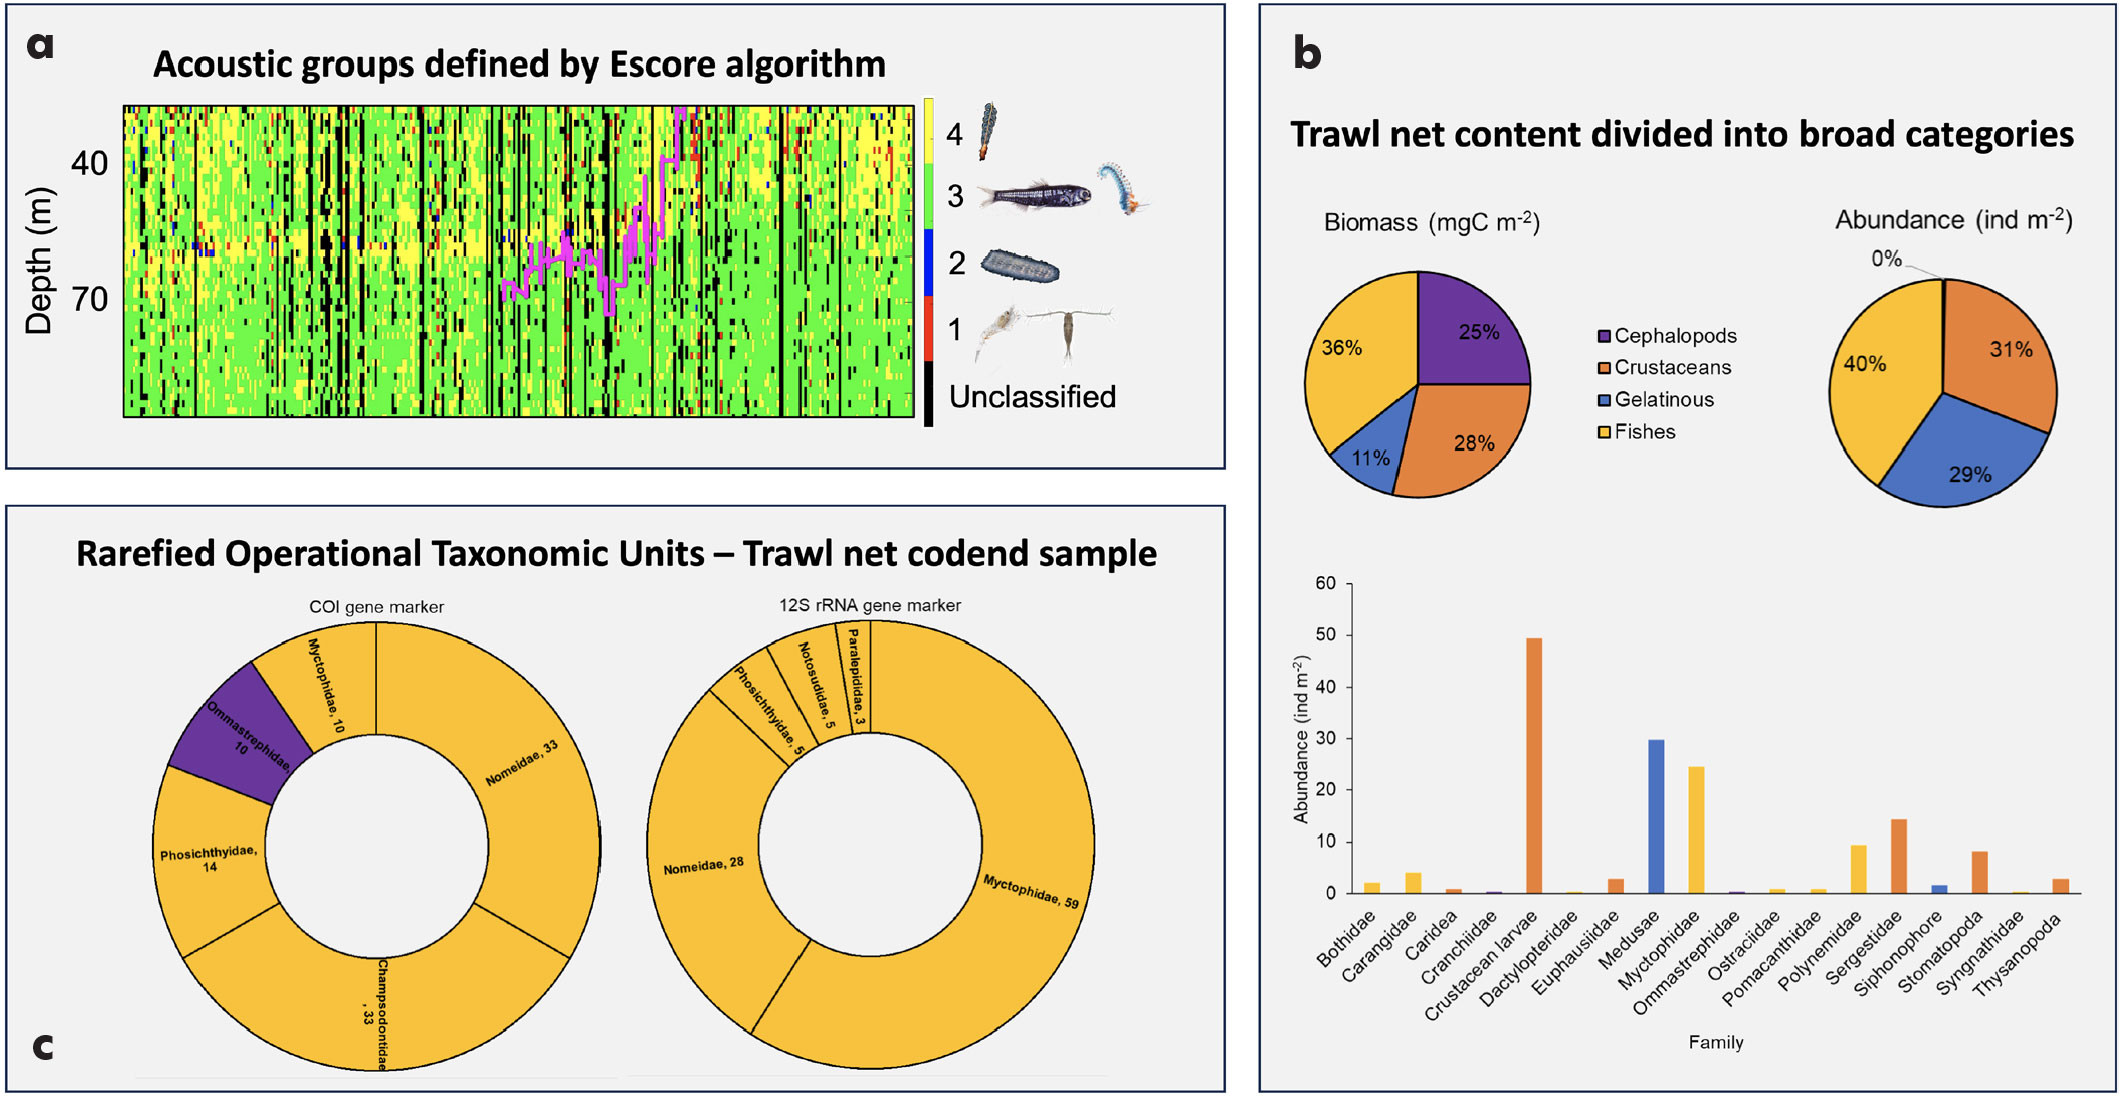
Fishes were well represented by the Escore algorithm, trawl relative abundance and biomass estimates, and the trawl net cod end eDNA analyses (Figure 4). Cephalopods, although caught in very low numbers, accounted for the majority of the trawl net biomass estimates. In contrast, crustaceans were abundant in the net but contributed the least to the overall biomass estimates. Cephalopods were underrepresented by the Escore algorithm and minimally detected in the eDNA analyses with the primers used in this study. Crustaceans and gelatinous organisms were also completely overlooked in the metabarcoding analyses, despite gelatinous organisms being a dominant group detected by both the Escore algorithm and in trawl net samples.
Future work will investigate species richness from the eDNA samples compared to trawl data. Although cephalopods are often underrepresented in acoustics, trawl, and eDNA data, biomass estimates, and bioenergetic and trait-based models of carbon transport (Aumont et al., 2018; Woodstock et al., 2022), they are significant contributors to carbon transport, as this study demonstrates. The use of a cephalopod-specific universal primer set could enhance the detection of cephalopods in eDNA samples. To be able to estimate cephalopod biomass, it is crucial to improve trawl net sampling and acoustic backscatter classification techniques because squids are weak scatterers and distribute sparsely under natural conditions (Chen et al., 2014).
Biomass and abundance estimations from trawls are limited by net efficiency. Future work will refine biomass estimates by classifying captured organisms into acoustic groups based on their backscattering properties using established acoustic backscattering models for “gas-bearing,” “fluid-like,” and “elastic-shelled” categories. The relative abundance of each group, determined from net catches, will be used to assess their contribution to water column backscattering. Sonar observations will permit the extrapolation of abundances based on actual measured backscattering levels. Biomass will be estimated by combining these abundance estimates with the average wet weight from net catches. Some parameters used to model the organisms’ echoes are not known at the species level. The literature offers various hypotheses such as the shape of gas inclusions, the orientation of organisms, and the density contrast with the surrounding medium. To address these uncertainties, scattering models will be run using bootstrapping (1,000 iterations), randomly varying these parameters. Accurate biomass estimations are the major limiting factor in trait-based, bioenergetic, and ecosystemic models of micronekton carbon transport. The approach described above will enhance the accuracy of biomass estimations for micronekton communities, including those underrepresented in trawl samples, while identifying sources of variability and quantifying uncertainties, a necessary first step in quantifying the role of micronekton in the biological carbon pump.
By integrating eDNA, acoustics, and trawl data, NEAT is an example of how traditional tools such as active acoustics and trawls could be used in conjunction with novel eDNA methods to provide information on species presence and absence, abundance, biomass, and distribution in the deep ocean.
Pushing Micronekton Research Past the Current Bottlenecks
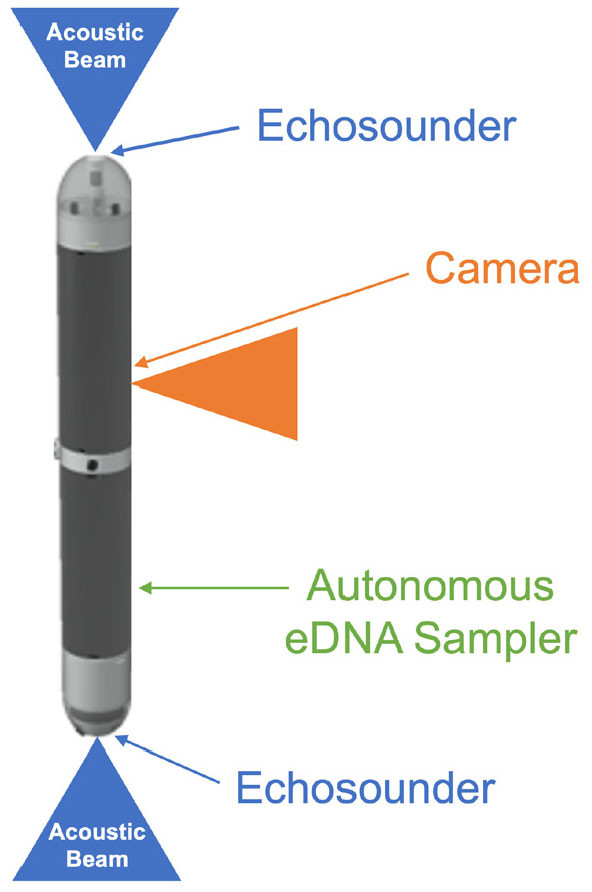
While NEAT represents a significant step forward in integrating traditional and novel technologies and addressing key methodological and knowledge gaps, substantial geographical gaps remain because observations have been vessel-based in a localized region of the Indian Ocean and limited to the year 2022. The next step should be to develop a fleet of cost-effective autonomous underwater vehicles (AUVs) each equipped with “acoustic intelligence” (i.e., a computer to process and transmit acoustic data in real time), a camera, and an autonomous eDNA sampler for daily monitoring of micronekton (Figure 5). Commercial autonomous samplers are often not cost-effective due to high proprietary costs. Our approach aims to bypass the expense of commercially developed vehicles by investing in research-driven prototypes that could offer greater sensor flexibility, autonomy, and spatio-temporal sampling capacity, allowing for tailored solutions that better serve specific research needs (Le Mézo et al., 2020).
|
|
The use of cost-effective AUVs could achieve finer spatial and temporal sampling resolutions by increasing the density of measurements in areas of interest, allowing for year-round investigation of diversity and migration patterns of micronekton taxonomic groups, which has never before been accomplished. Presently, we do not know how the biomass, migration patterns, and carbon transport by micronekton varies year-round. Existing sampling approaches are limited by the high cost of data acquisition, resulting in small temporal sampling resolution with insufficient day-night, monthly, seasonal, or multi-year sampling frequency at any single location done aboard research vessels. Existing models of carbon transport do not incorporate micronekton’s migration patterns, accurate biomass estimates, and diets. Development of cost-effective AUVs that integrate active acoustics, optical, and eDNA sensors is crucial for advancing micronekton research in order to address the major questions related to their biomass, diversity, and migration. Answering these questions is a necessary step before tackling more complex issues, such as their role in carbon transport out of the euphotic zone.
Acknowledgments
We thank the anonymous reviewers for their careful reading of our manuscript and their many insightful comments and suggestions. The authors acknowledge the captain, crew, and scientific staff of R/V Marion Dufresne for their assistance during the research cruise RESILIENCE. The chief scientist, Jean-François Ternon (IRD, Sète, France), and co-principal investigators, Margaux Noyon (Nelson Mandela University, South Africa), Steven Herbette (Laboratoire d’Oceanographie Physique et Spatiale, Brest, France) and Pierrick Penven (IRD, Brest, France) are further acknowledged for their support and assistance with biological and environmental data acquisition during the cruise. We extend our gratitude to Arthur Blanluet (University of Queensland, Australia), Anne Lebourges Dhaussy (IRD, Brest, France), and the master’s students from the ISblue (Interdisciplinary graduate School for the blue planet) floating university (Université de Bretagne Occidentale, Université du Littoral Côte d’Opale, Université Côte d’Azur) and their coordinators, for their help with the trawl and acoustic data collection. Micronekton taxonomic identification is being conducted by Evgeny Romanov (CITEB, Reunion Island). The RESILIENCE oceanographic cruise was supported by the French National Oceanographic Fleet, by the Belmont Forum Ocean Front Change project, implemented through the French National Research Agency (ANR-20-BFOC-0006-04), by the ISblue project, Interdisciplinary graduate school for the blue planet (ANR-17-EURE-0015) and co-funded by a grant from the French government under the program Investissements d’Avenir embedded in France 2030. The eDNA analyses were partly supported by the French National program LEFE (Les Enveloppes Fluides et l’Environnement) coordinated by the CNRS (Centre national de la recherche scientifique) through a grant awarded in 2022. The eDNA analyses were also supported by EuroMarine Association, through its 2023 funding programme for Cooperation Projects led by Early Career Researchers, managed by OYSTER (Orienting Young ScienTists of EuromaRine).