The Brazil Current Region and Its Particularity
Surface circulation in the western part of the South Atlantic Subtropical Gyre is dominated by the poleward-flowing Brazil Current (BC), a warm and saline western boundary current (WBC). The BC originates at the bifurcation of the South Equatorial Current around 14°S and extends to approximately 500 m deep in the water column. At ~20°S, the BC encounters the Vitoria-Trindade Ridge, a chain of submerged seamounts that acts as a barrier, forcing the current to flow through narrow channels (see Figure 1a) before reorganizing into a more coherent WBC further south. Near 22°–23°S, the BC exhibits intense mesoscale variability (Mill et al., 2015) associated with eddy formation and recirculating gyres, and interacts with localized coastal upwelling and equatorward-propagating coastal trapped waves (Freitas et al., 2021), resulting in highly complex hydrodynamics.
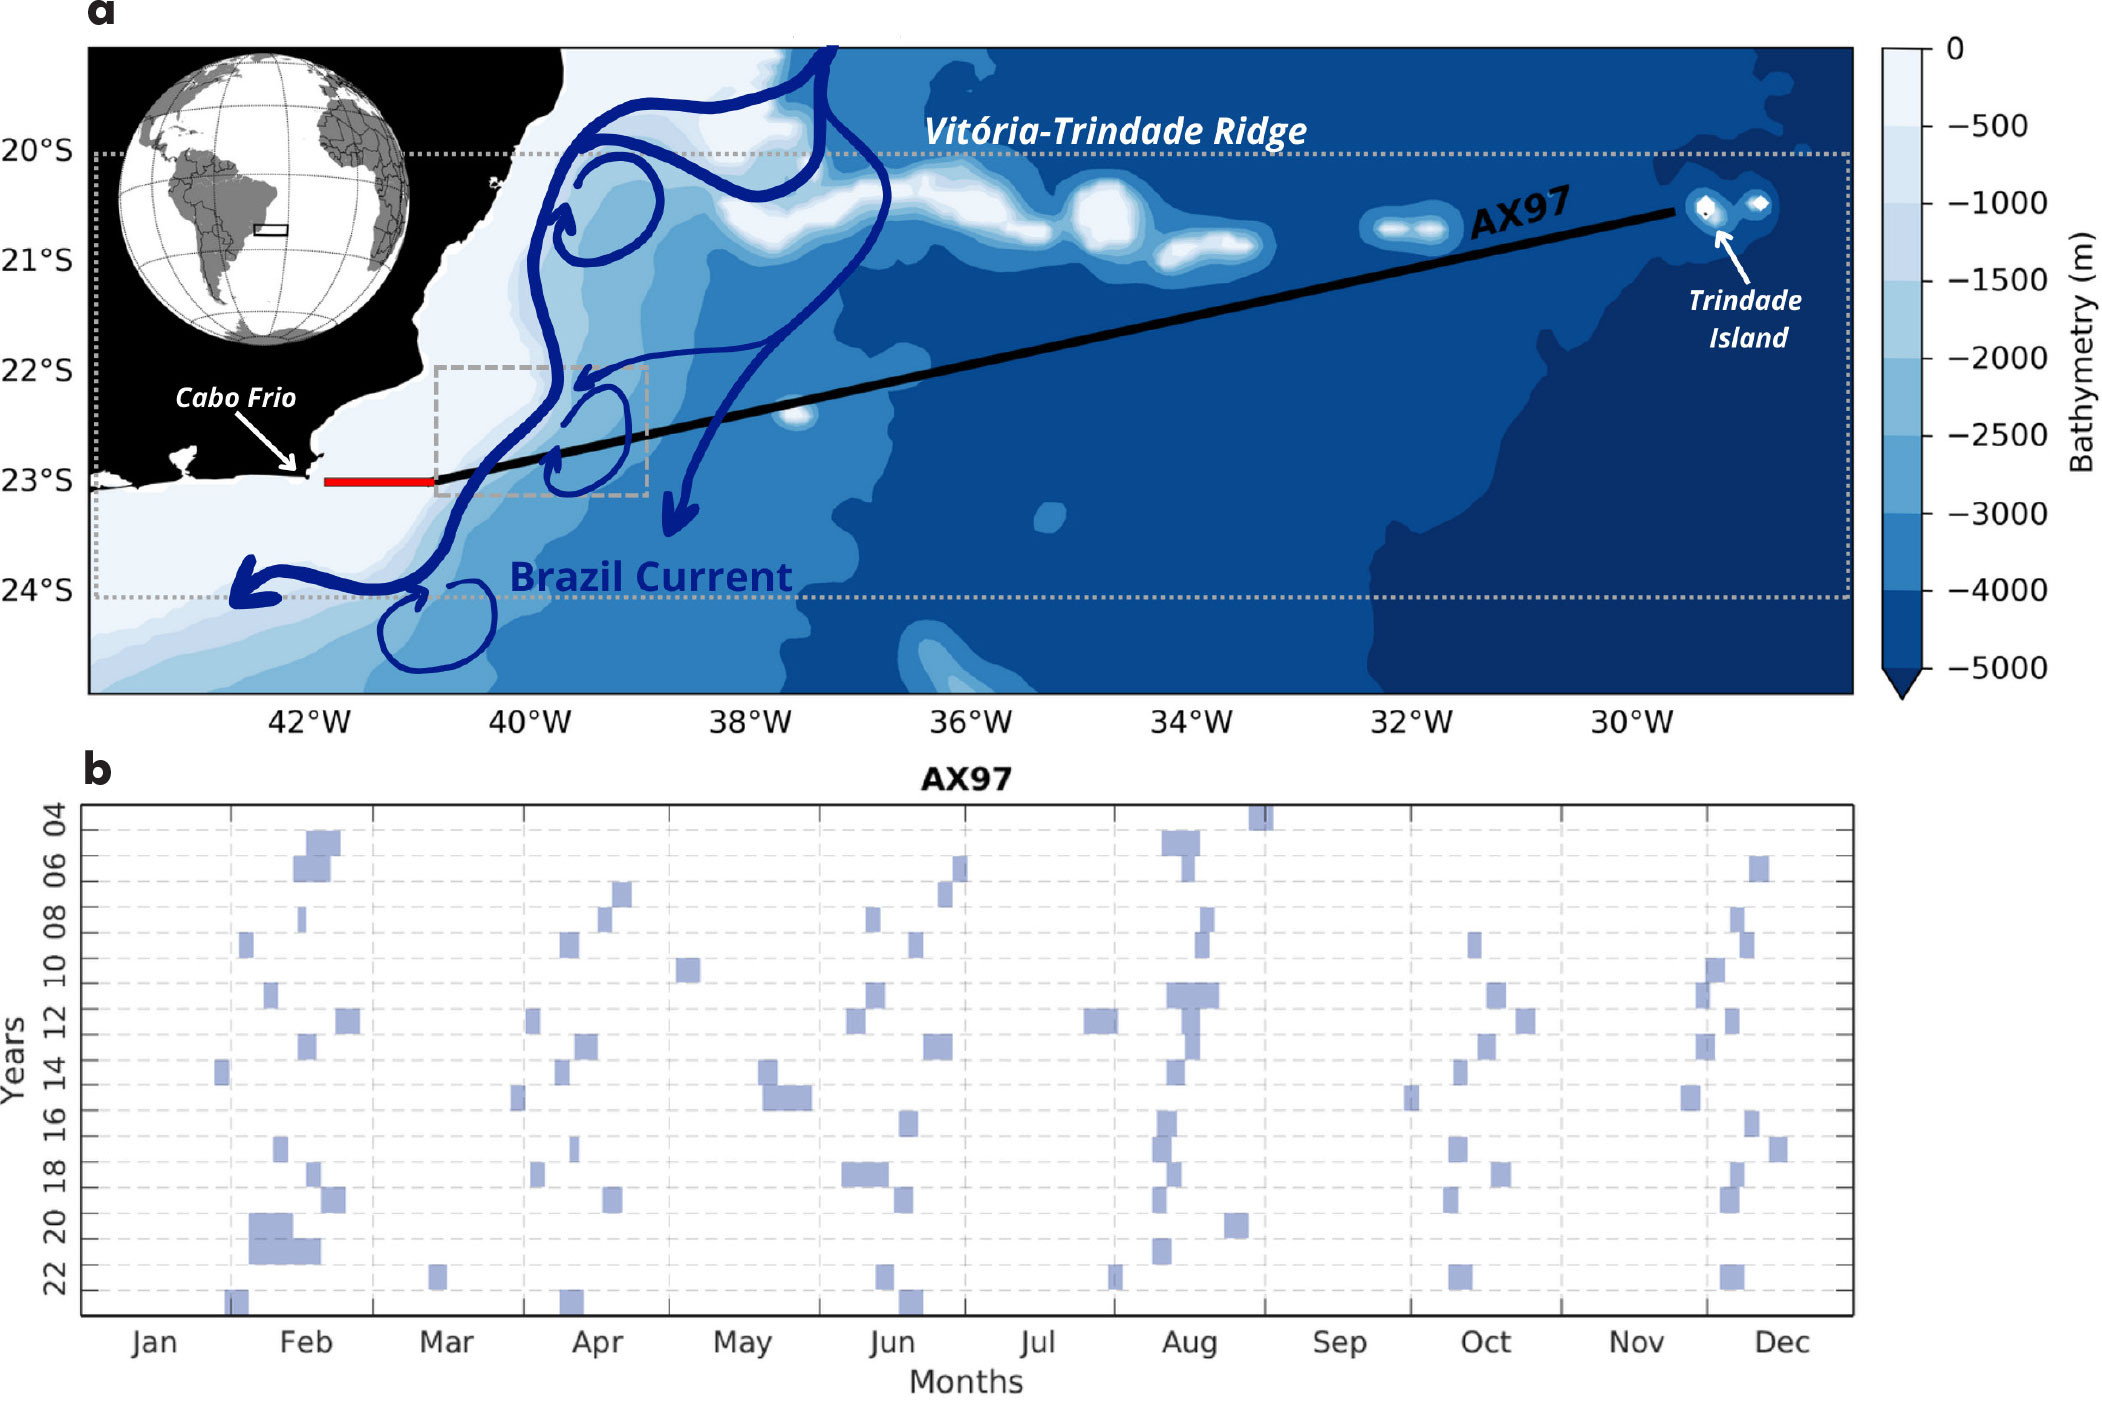
FIGURE 1. (a) Circulation scheme in the Brazil Current (BC) region, according to studies available in the literature. The thick blue line shows the BC mean path. The black line indicates the AX97 eXpendable BathyThermograph (XBT) reference transect overlaid on the contours of the local bathymetry in meters. The red line indicates a zonal coastal transect extension that connects the western end of the AX97 reference transect to the vicinity of Cabo Frio. The gray dashed and dotted boxes mark the area used to identify eddy occurrence and sea surface temperature anomalies, respectively, during 2004–2023. (b) Monthly distribution of cruises over the 20 years. > High res figure
|
This region is a crucial area for research and monitoring. Most of Brazil’s oil and gas production originates in the Espírito Santo, Campos, and Santos sedimentary basins, located around these same latitudes, and includes recently discovered pre-salt oil reserves in deep waters. The associated risks of oil spills and the continuous development of adjacent coastal areas pose severe environmental challenges, demanding forecast capabilities and continuous monitoring of the circulation in shelf and deep waters. In addition, this region is characterized by high coastal productivity and unique ecosystems, influenced by the Cabo Frio upwelling system to the south and the Abrolhos Bank coral reef complex to the north. Studies indicate that cross-shelf fluxes that may impact coastal productivity are strongly affected by BC meandering and eddy formation (Aguiar et al., 2014). The BC also plays an important role in extreme events such as the marine heatwaves by advecting anomalies across different latitudes (Goes et al., 2024), with possible ecological impacts along the Brazilian coast.
Historical sparsity of in situ data in the Western South Atlantic Ocean poses challenges for studying the climate dynamics of the BC region. The longest sustained monitoring system of the BC, the US NOAA/Atlantic Oceanographic and Meteorological Laboratory (AOML) AX97 high density XBT transect (hereafter AX97), was initiated in 2004. Part of a global network of XBT transects (Goni et al., 2019), AX97 is conducted in cooperation with the Brazilian regional office of the Global Ocean Observing System (GOOS) and a partnership that includes Brazilian universities (Federal University of Rio de Janeiro and Federal University of Rio Grande), the Brazilian Navy, and the Brazilian Ministry of Science, Technology, and Innovation (MCTI), with additional support from the National Council for Scientific and Technological Development (CNPq).
Since August 2004, AX97 has conducted bimonthly sampling, measuring the upper ocean temperature structure between Rio de Janeiro (22.9°S, 43°W) and Trindade Island (20°S, 30°W) (Figure 1a). AX97 is part of the Ship of Opportunity Program and is generally executed in even months (Figure 1b) following the supply schedule of the Brazilian Navy ships to the Trindade Island. The sampling route crosses the BC region and the 200 m isobath around 22.8°S. This area is noted for intense mesoscale activity, typically associated with cyclonic (clockwise) meanders that give rise to recurring eddy formation (generally referred to as the São Tomé eddy). This study aims to assess the vertical structure and variability of the BC under extreme warm and cold scenarios, spanning the 20-year period, where composites of sea surface temperature (SST), anomalies of sea surface height (SSH), and the BC structure were analyzed.
Data and Methods
Our analysis is restricted to the region west of 38°W, comprising most of the BC mean flow and mesoscale variability for the period August 2004 to August 2023. Five cruises with spurious data were excluded after quality control, resulting in a total of 80 cruises. The AX97 transect starts offshore of the 200 m isobath and monitors upper ocean temperatures from the surface to approximately 800 m, with an average spatial resolution of 27 km, and increased resolution of 18 km near the shelf-slope regions. Salinity was estimated from a historical temperature-salinity relationship for the region (Goes et al., 2018).
Geostrophic velocities were calculated, and the absolute dynamic height (DH(z)) was estimated following the methodology described by Goes et al. (2019). This approach begins with the computation of relative dynamic height from temperature and salinity profiles using a reference depth of z = 500 m. Subsequently, DH(z) was refined by combining the monthly climatological absolute dynamic topography (ADT) with the relative dynamic height at the reference level. The ADT data were sourced from the International Pacific Research Center (IPRC), which integrates gridded satellite altimetry with Argo float data. Once the DH along the AX97 transect was determined, it was extrapolated to shallower depths (<200 m, as indicated by the red line in the upper panel of Figure 1) using altimetry data. This approach enabled the computation of extrapolated DH for the entire AX97 transect.
Altimetry was further used, together with SST data, to visualize circulation features, including the BC front and mesoscale eddies sampled by the XBT data. SSH and sea level anomaly (SLA) relative to mean dynamic topography data, available at 1/4° horizontal resolution, were obtained from the Archiving, Validation, and Interpretation of Satellite Oceanographic data (AVISO), produced by SSALTO/DUACS and distributed by the Copernicus Marine and Environment Monitoring Service (CMEMS). Altimetry, and absolute geostrophic velocity derived from SSH were used to identify eddies in the region using the Okubo-Weiss parameter (OW; Okubo, 1970), which expresses the strain-vorticity balance in the horizontal flow field. Eddies were considered to occur for OW ≤ 2 × 10–12 s–2, in the region bounded by longitudes 41°W and 39°W and latitudes 22°S and 23°S (gray dashed box in Figure 1a).
The SST data used in this study were sourced from the Operational Sea Surface Temperature and Sea Ice Analysis (OSTIA) dataset (Good et al., 2020) for 2004 to 2023. The Global Ocean OSTIA SST data, provided by CMEMS and accessible through the Marine Data Store (MDS), offers high-resolution (1/20°) daily global SST maps. In addition to identifying eddies, SST data were used to detect extreme temperature anomalies in the AX97 region, from 20°S to 24°S and 44°W to 28°W (gray dotted box in Figure 1a). Warm (cold) anomalies were computed, taking into account the 90th (10th) percentiles, and warm (cold) composites were generated for the entire region.
Results and Discussion
Figure 2a presents the average SSH over the period 2004–2023, along with the corresponding mean surface geostrophic velocity from AVISO during the days of the AX97 cruises. The averaged SSH is very similar to the mean dynamic topography, indicating that the AX97 sampling strategy is capable of representing the region’s mean dynamics. This similarity allows us to interpret the processes observed during the AX97 cruises as proxies for the local BC conditions. Analogous to the BC scheme (Figure 1a), the mean path of the BC is observed to follow the shelf break, with slight variations in areas such as Cabo São Tomé (~22.5°S) and Cabo Frio (~23.5°S). As previously mentioned, this region is characterized by high BC variability and eddy genesis, with the São Tomé eddy being the prevailing mesoscale feature in the AX97 region that could contribute to a reduction in the overall mean SSH.
The vertical structure of the mean geostrophic velocity (Figure 2b) reflects the surface signal of the BC and features two distinct cores, one that corresponds to the mean flow of the BC (located west of 40°W) and the other that is associated with cyclonic meanders (around 40°W). The vertical velocity structure of these mesoscale features extend through the first 400 m of the water column, influencing and modulating exchanges between the oceanic region and the continental shelf. The dynamics of these processes will be discussed in detail later.
Comparison of panels a and b in Figure 2 indicates that the BC primarily flows where SSH gradients are most pronounced. This observation is further supported by the DH calculated from AX97 transect profiles. The DH derived from XBT data aligns closely with the SSH obtained from altimetry (Figure 2c), a consistency that is also evident in the extrapolation to the shelf, indicating the effectiveness of the methodology. The highest values of SSH and DH, along with the most pronounced variations, are observed in the BC region between 41°W and 39°W. Within this area, there is a difference of approximately 15 cm between maximum and minimum values, which reflects the distinct signature of the BC pathway (Figure 2c).
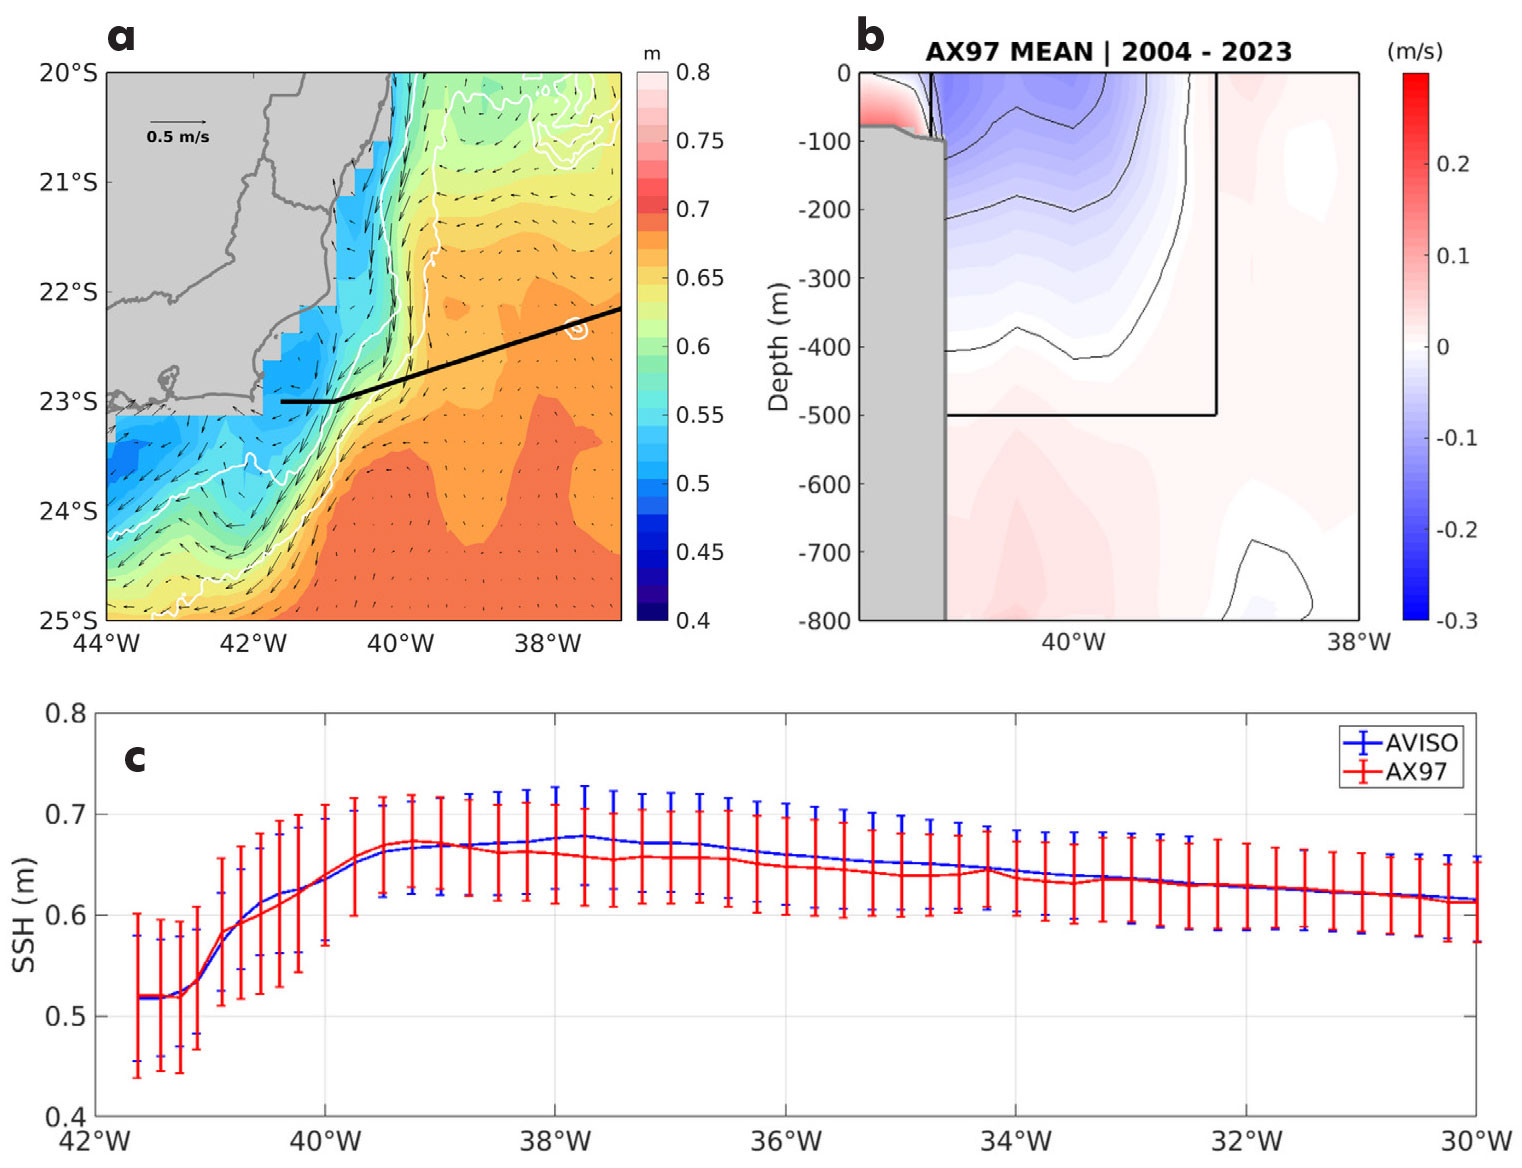
FIGURE 2. (a) Mean sea surface height (SSH) for the 20-year period analyzed considering only dates that coincide with the AX97 cruises. The black arrows illustrate the associated mean geostrophic velocity from AVISO. (b) The mean geostrophic velocity derived from XBT data for the BC region. Negative values (blue) indicate southward velocities. The black box marks the area used to evaluate the transport in Figure 3b. (c) Mean SSH along the AX97 reference transect and its standard deviation (blue line) compared to the mean dynamic height evaluated from AX97 cruises and its standard deviation (red line). > High res figure
|
The mean BC volume transport and its associated standard deviation observed from AX97 was –4.96 ± 2.69 Sv (horizontal gray line in Figure 3a), in line with previous estimates made by Goes et al. (2019). This transport was evaluated based on the southward (negative) geostrophic velocities in an area between 41°W and 39°W, from the surface to a depth of 500 m (black box in Figure 2b). The transport data were organized by season, and subsequent average values were calculated in order to highlight seasonal variations in BC transport. The highest transport of –6.51 ± 1.91 Sv was observed in austral spring (SON), while the lowest transport of –4.02 ± 2.54 Sv occurred in austral winter (JJA). Transport values for austral summer (DJF) and autumn (MAM) were –5.67 ± 2.64 Sv and –4.37 ± 2.87 Sv, respectively. The different scenarios (positive/negative SST anomalies and SSH eddy track) analyzed in this study are identified on the transport time series (Figure 3a).
From the total of the 80 cruises analyzed between 2004 and 2023, 25 cruises or 31.2% reported the presence of eddies, identified by black dots on the southward transport time series in Figure 3a. More than half of these eddies (52%) occurred during summer, and the rest were evenly spread among the other three seasons (16% each). This indicates that mesoscale activity is most intense during summer, given that the cruises were evenly distributed throughout the seasons.
Figure 3b illustrates one eddy event, where BC meandering generated a São Tomé eddy during the summer of 2019 (pink dot on the transport series in Figure 3a). A depression in the SSH signal characterizes the São Tomé eddy as a cyclonic eddy whose vertical velocity structure indicates two opposing cores that modulate the water column to a depth of 500 m (Figure 3c). The offshore core represents the BC front when displaced from the shelf break, characterized by an intense southward geostrophic velocity that exhibited a maximum near the surface (~0.6 m s–1). The inner core of the cyclonic recirculation is less intense (~0.4 m s–1) and directed northward. Considering only southward transport, BC transport observed during this cruise was –8 Sv, almost double the average. Some of the eddies identified in this study were also analyzed by Mill et al. (2015), who used a similar method over a larger area. They found that six São Tomé eddies detached from the main BC flow and formed isolated rings between 2005 and 2013. Two of these eddies followed the BC southward, while six moved northward toward the Tubarão Bight (20°S, 39°W). The authors also highlighted the potential of these eddies to transport shelf and slope water properties along or across the BC.
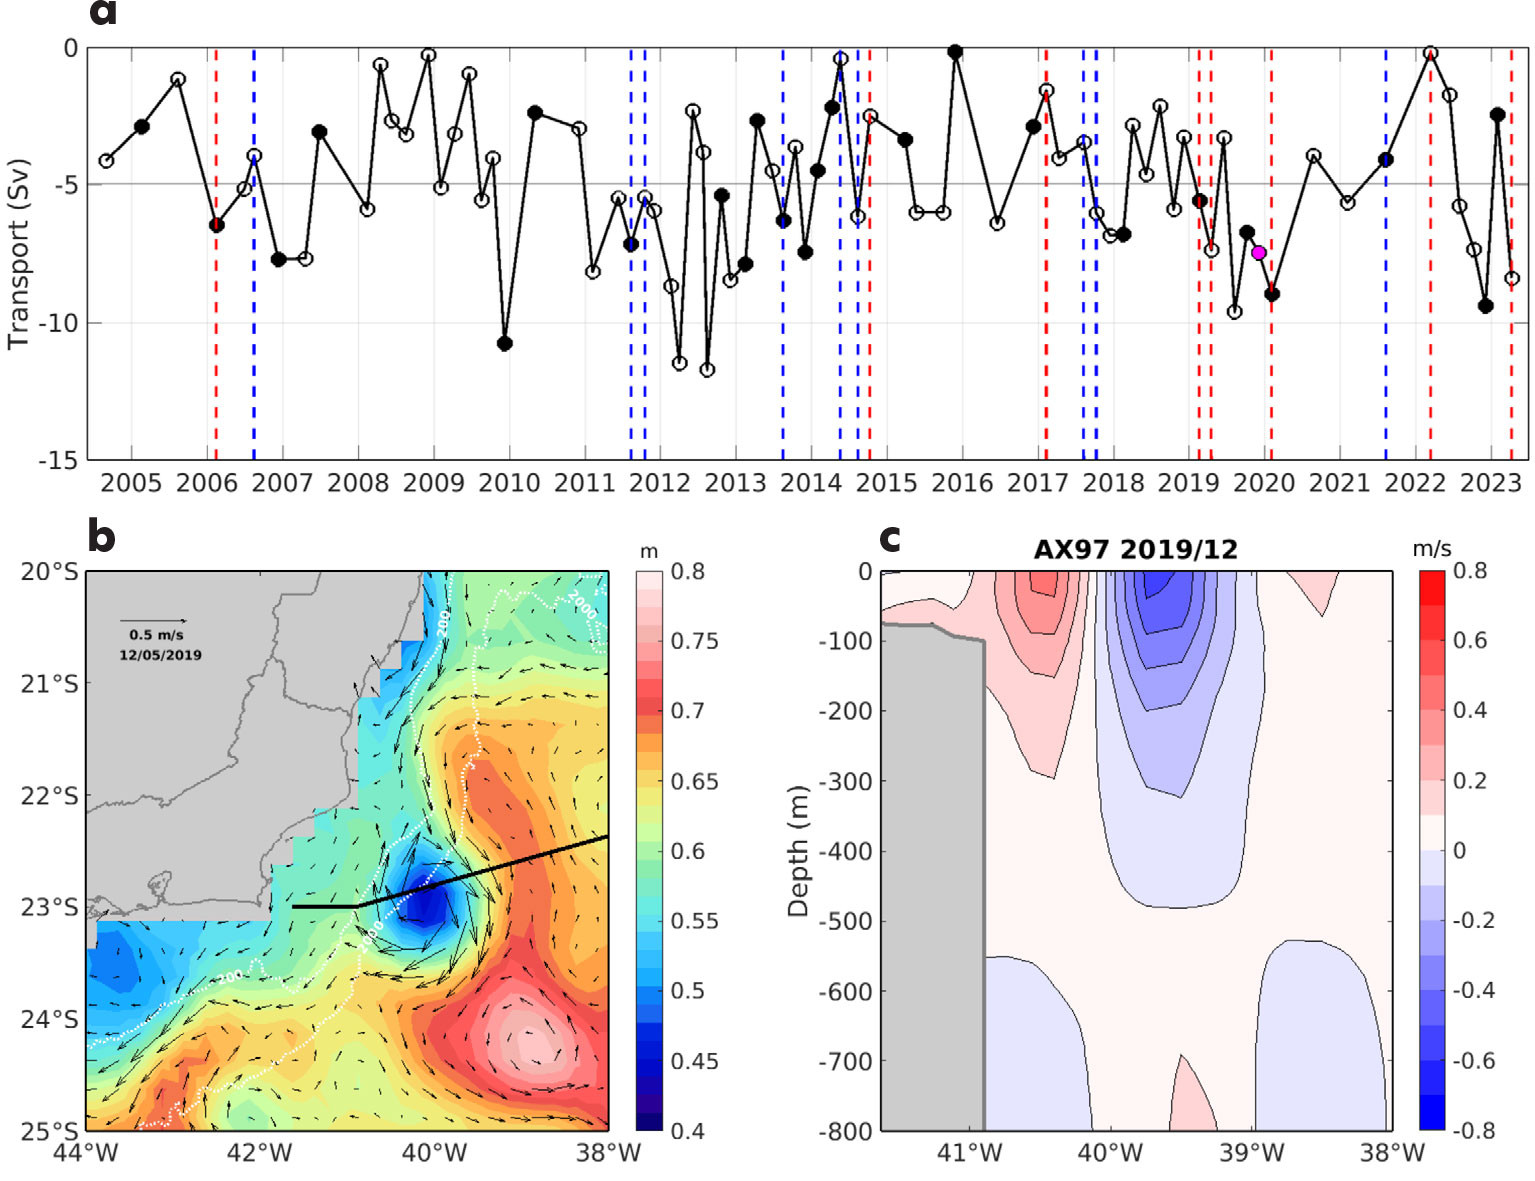
FIGURE 3. (a) Volume transport estimated across the reference transect indicated in Figure 2b. Different scenarios are indicated as follows: presence of eddy (black dots), negative anomalies (dashed blue line), and positive anomalies (dashed red line) in sea surface temperature. The pink dot indicates the eddy event in December 2019 highlighted in panels b and c. (b) Regional sea surface height and associated geostrophic velocities (arrows) illustrate a BC cyclonic eddy examined during the December 2019 cruise. (c) Absolute geostrophic velocity (m s–1) estimated from AX97 data for the December 2019 cruise. Negative velocities (blue) have a southward flow, and positive velocities (red) have a northward flow. The black contours are shown every 0.1 m s–1. > High res figure
|
The extreme cold and warm events in the region were identified using a percentile-based methodology, where area-averaged temperature values for 10th (P10) and 90th (P90) percentiles were –2.11°C and 2.30°C, respectively. Among the 80 cruises analyzed, eight of them (four in February, two in March, and two in April) exhibited P90 anomalies (warm) and nine (five in August and four in October) showed P10 anomalies (cold). Not surprisingly, more than 50% of the warm anomalies were observed after 2019. In contrast, only one negative anomaly was recorded after 2019. This suggests a general warming trend in the AX97 region over the recent years.
The composite of positive anomalies exhibits a spatially warm distribution in the region, with the northern part of the domain being warmer than the southern part (Figure 4a). Additionally, a negative signal is concentrated closer to the coast between 22°S and 23°S, and north of 21°S. To some extent, this agrees with the negative anomalies (Figure 4b), where the major anomalies are concentrated near the coast. These areas are associated with coastal upwelling previously identified in the literature to be driven by northeasterly winds and to be stronger in summer (Aguiar et al., 2014; Goes et al., 2019). As mentioned above, this region is also known for continuous generation of cold-core cyclonic eddies that could contribute to this negative anomaly.
The vertical distribution of temperature anomalies varied along the section and with depth. The composite of warm anomalies (Figure 4c) shows significant warming throughout much of the water column, with positive anomalies extending to 800 m during warmer periods. In contrast, the composite of cold anomalies indicates cooling mainly within the upper 100 m (Figure 4d) and warming at the subsurface. At the surface, a positive anomaly of up to 3°C was observed, accompanied by an intensified temperature gradient near the shelf during warm events. During cold events, this gradient was less pronounced, with anomalies dropping to as low as –2.5°C.
Regarding the vertical structure of velocity anomalies, the BC was observed to intensify during warm events (Figure 4e), consistent with the increased temperature gradient between inshore and offshore areas that results in a more pronounced density gradient. During warmer cruises, a velocity anomaly of 0.2 m s–1 was recorded in the BC region, with its core being shallower and more intense. In contrast, during colder cruises (Figure 4f), the velocity anomaly was less pronounced, peaking at 0.1 m s–1.
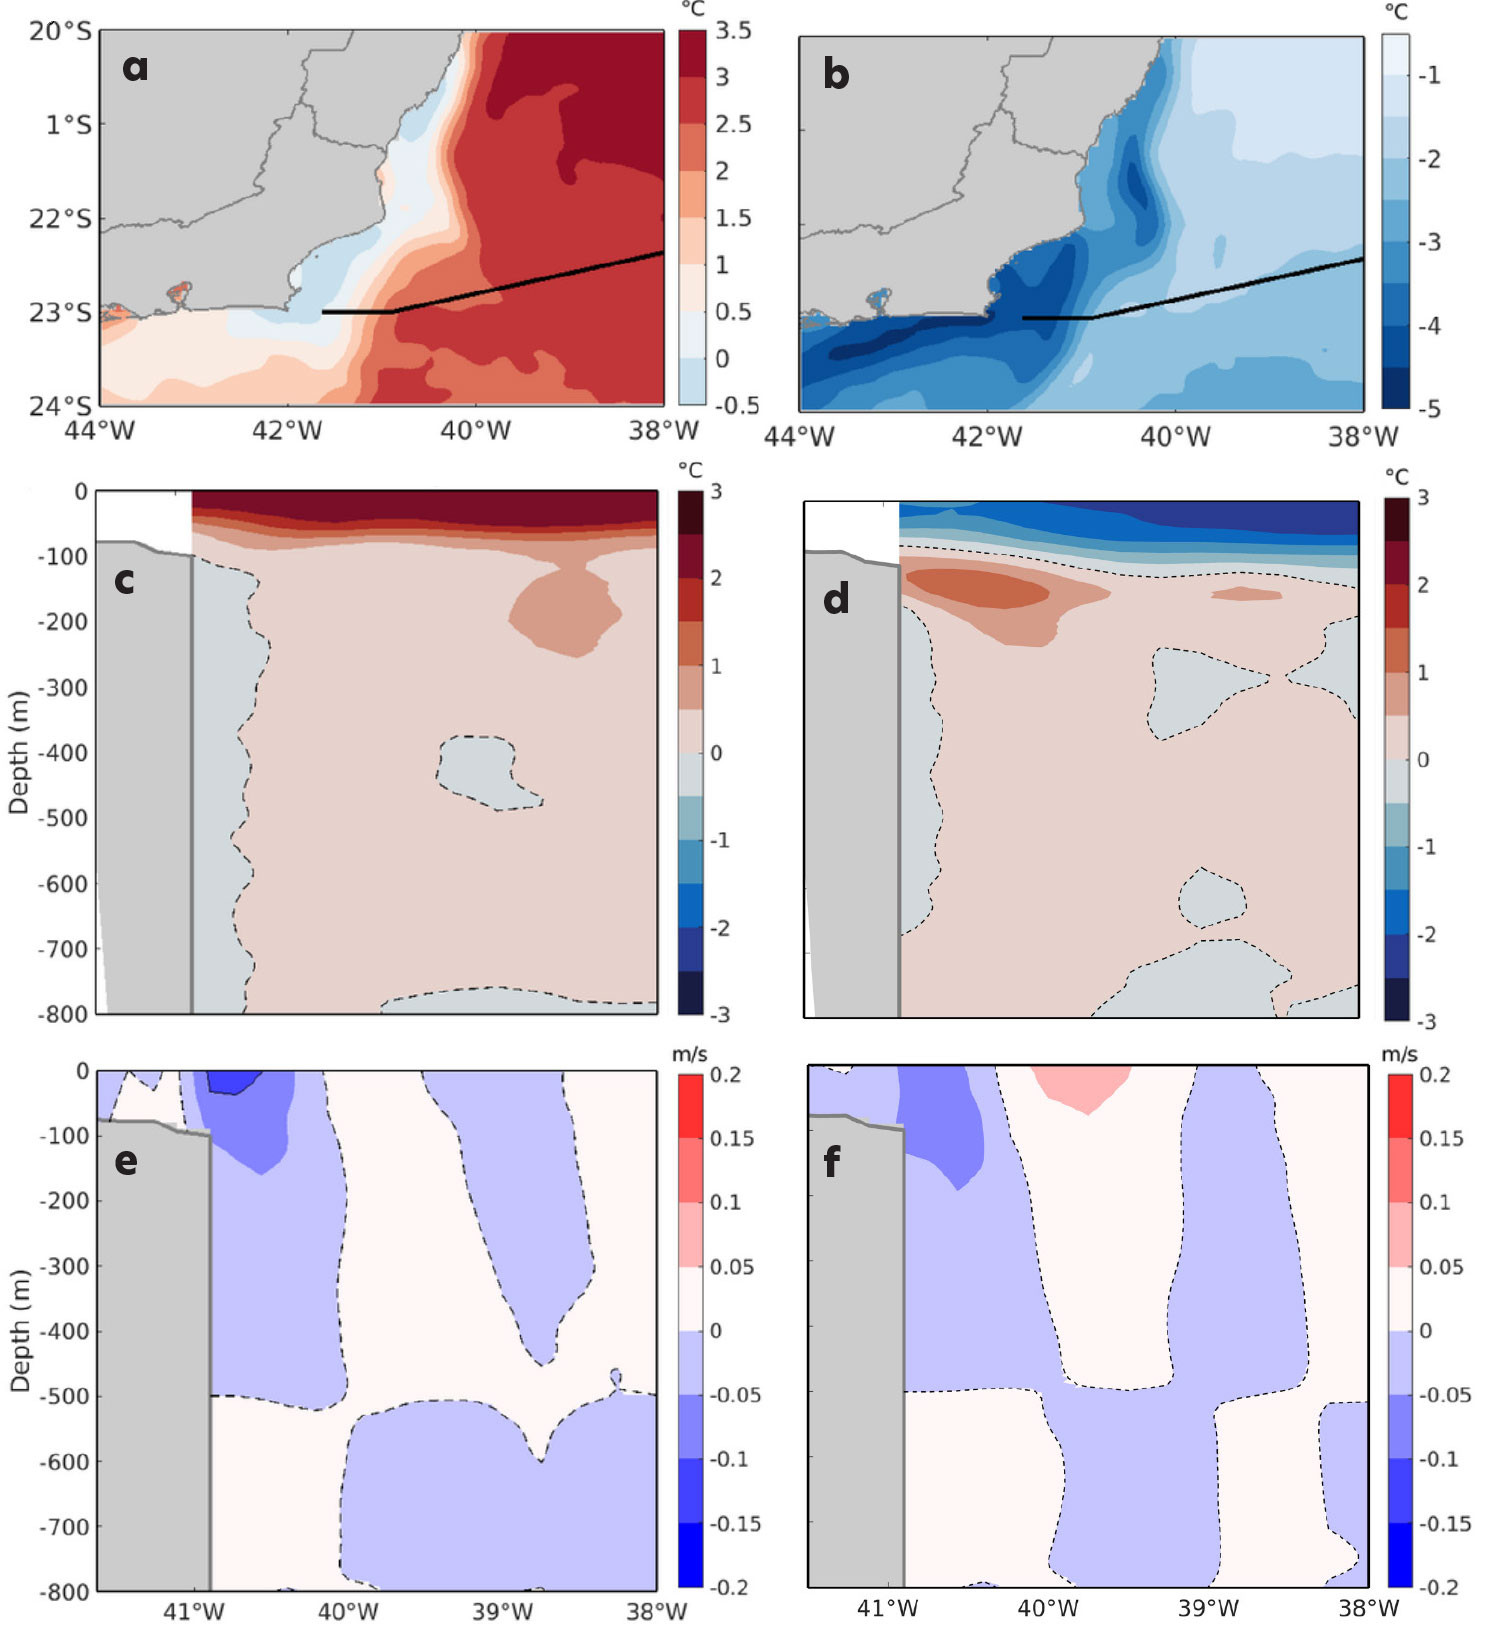
FIGURE 4. (a) Composite of positive sea surface temperature (SST) anomalies (the warmest 10% of cruises). (b) Composite of negative SST anomalies (the coldest 10% of cruises). (c) Vertical structure of temperature anomalies for the warmest 10% of cruises estimated from AX97 data. (d) Vertical structure of temperature anomalies for the coldest 10% of cruises. (e) Vertical structure of geostrophic velocity anomalies for the warmest cruises. (f) Vertical structure of geostrophic velocities anomalies for the coldest cruises estimated from AX97 data. The dashed black lines in panels c–f indicate the zero values in both temperature anomalies and velocities. > High res figure
|
Conclusions
AX97 is the only long-term XBT monitoring system for the BC, having operated continuously for the past 20 years. The data are freely available from NOAA. This study analyzed temperature profiles to assess the BC’s transport and explore its variability, especially in relation to mesoscale eddies and temperature anomalies. The average BC transport was found to be –4.96 ± 2.69 Sv, consistent with previous studies. Seasonal variations were observed, with the highest transport levels occurring in austral spring and the lowest in austral winter. Eddies were detected on approximately 30% of the 80 cruises, mainly during austral summer, and they altered the vertical structure of the BC by creating opposing flows that extended to 500 m depth. Temperature anomalies were classified as either warming or cooling events, revealing extreme thermal patterns. Of the eight warm events observed, five occurred after 2019, indicating a potential regional warming trend. Notably, warm anomalies affected deeper water layers, while cold anomalies were confined to the upper 100 m, suggesting that warming events could have more widespread effects on ocean conditions.
These findings have significant implications for society, as they contribute to a better understanding of ocean processes that influence global climate and weather patterns. The 20 years of AX97 data are being used in key areas such as: (1) improving the accuracy of ocean forecasts through data assimilation by global operational centers, thus enhancing the prediction skill of short-term weather events and long-term climate trends that can inform policy decisions, disaster preparedness, and resource management; (2) study of upper-ocean heat content and the transport of heat in the Atlantic Meridional Overturning Circulation (AMOC), which plays a crucial role in regulating global climate systems that affect agriculture, energy production, and water resources; and (3) assessment of high-resolution ocean forecast systems and Earth system models that provide vital insights for climate change mitigation and adaptation strategies.
Moreover, the ongoing expansion of the AX97 program to include shelf waters and the collection of atmospheric data during cruises ensures the continued enhancement of the dataset, directly benefiting climate science and strengthening the resilience of coastal communities. By improving our understanding of the BC’s behavior, this research supports efforts to predict and manage the impacts of climate variability, contributing to the well-being of society and the protection of vulnerable ecosystems.
Acknowledgments
We thank the MCTI, NOAA/AOML, and the Cooperative Institute of the University of Miami, the Brazilian Navy, the UFRJ and FURG, the AX97 team, and all the volunteers who helped us collect the AX97 data during these 20 years. This research would not by possible without the support from the Petróleo Brasileiro S.A. (PETROBRAS), and the Brazilian Oil Regulatory Agency (ANP) for making the field campaigns possible using the Cooperation Terms SIGITEC 2018/00451-6, 2018/00452-2, and 2024/00240-6. We express our gratitude to the National Council for Scientific and Technological Development (CNPq) for their financial support of the National Ocean Observation and Monitoring Network (ReNOMO), grant number 409666/2022-0. Other important research grants from CNPq that also supported this research are grants numbers 475529/2012-0, 405908/2016-4, 310902/2018-5, 443262/2019-5, 420151/2023-0 and 441729/2024-0.