Full Text
The Roger Revelle Commemorative Lecture Series was created by the Ocean Studies Board of the National Academies of Sciences, Engineering, and Medicine in honor of Roger Revelle to highlight the important links between ocean sciences and public policy. Dr. Larry Mayer, the twenty-seventh annual lecturer, spoke on March 17, 2026, at the National Academy of Sciences.
Introduction: Mapping as Exploration
When asked to give the Revelle Lecture—and come up with a catchy title that would capture the essence of my talk—we came up with “The Quest to Map the Global Ocean.” That sounded good, but it also led me to delve deeper into what a “quest” really is. Drawing on several formal definitions, I arrived at “A long, adventurous search or journey undertaken to find or achieve something important involving challenges and obstacles.” I felt that was an accurate description of what I would talk about, but, in all honesty, I would have to say that when I first entered this field, I was driven less by the altruistic goal of “achieving something important” and more by the more selfish desire of searching for adventure.
From my earliest days growing up in an apartment building in the Bronx, I wanted to be an ocean explorer. Like many of my generation, I was inspired by Jacques Cousteau, and while it was the spectacular images of macrofauna and wrecks that folks like Cousteau and Bob Ballard produced that caught my imagination, I also recognized that these images were only minuscule snapshots of a vastly unknown ocean system—true exploration begins with mapping. This is what the early explorers did as they ventured into the unknown—Lewis and Clark, Magellan, and Captain Cook all started by making maps, establishing the spatial framework for all else that they and others would discover.
|
|
Human Perception, Imagery, and the Primacy of Vision
Mapping, in the context of exploration, is the process of creating a visual representation of spatial data. Visual representation is central to mapping because spatial exploration is fundamentally a sensory process and, among the human senses, vision dominates both perceptually and neurologically. Approximately 30% of the neurons in the human brain are devoted directly to visual processing, and over 60% of the brain is involved in vision directly or indirectly (Billinghurst and Thomas, 2016). Throughout history, exploration has therefore been closely tied to imagery: telescopes pointed skyward, maps sketched from elevated vantage points, and, more recently, satellites imaging Earth from space with remarkable resolution.
Our modern approaches to understanding Earth’s processes reflect this visual bias. Satellite imagery, digital terrain models, and geospatial visualization tools allow researchers to “see” processes unfolding across the continents. High-resolution imagery reveals glacier retreat, forest loss, urban expansion, and geomorphic change with unprecedented clarity. Mapping does not merely document these processes; it provides the spatial context necessary to interpret them quantitatively. Modern satellite-based digital elevation models provide the spatial framework upon which interpretation, navigation, governance, and both resource exploitation and environmental protection depend. Today, for the terrestrial components of Earth, advances in remote sensing, geodesy, and computing have produced near-global, meter-scale representations of Earth’s surface. These datasets now underpin climate science, hydrology, ecology, hazard mitigation, and land-use planning. With a few keystrokes, anyone can extract this remarkable imagery for any terrestrial location with readily available applications like Google Earth. In stark contrast, when focused on the ocean’s surface, the same sensors that spectacularly map terrestrial components provide little information about our ocean, which represents 71% of Earth’s surface and the largest continuous environment on the planet. This disparity is striking and frightening as the ocean exerts a disproportionate influence on our planet. Ocean circulation regulates climate; the seafloor controls deep-water pathways and mixing; maritime trade sustains the global economy; fisheries feed and support hundreds of millions of people; and submerged landscapes host ecosystems, resources, and cultural heritage (Figure 1).
|
|
The Physical Constraint: Why the Ocean Resists Optical Mapping
The principal barrier to comprehensive ocean mapping is physical rather than conceptual. The sensors used for satellite remote sensing typically rely on electromagnetic radiation—visible light, infrared, or radar—that propagates efficiently through air. In seawater, however, absorption and scattering dramatically reduce penetration depth. Even in the clearest open-ocean waters, visible light rarely penetrates beyond ~200 m; in most coastal waters, penetration is typically less than 50 m.
This limitation renders optical imaging ineffective for the vast majority of the seafloor and water column. The mean depth of the global ocean is approximately 3,700–4,000 m, with large areas exceeding 5,000 m; 94% of the world’s seafloor is deeper than 200 m. Beyond these depths (and typically much shallower) the seafloor lies permanently beyond the reach of light-based remote sensing. This does not mean deep-sea optical imaging is impossible; rather, it requires placing sensors very close to the seafloor to overcome rapid light attenuation. As outlined by Chris Scholin in last year’s Revelle Lecture (Scholin, 2025), this can be accomplished using cabled remotely operated vehicles (ROVs) or free-swimming autonomous underwater vehicles (AUVs) that can be operated close to the seafloor and collect high-resolution optical imagery. Unfortunately, these vehicles move very slowly and, given the rapid attenuation of light, can only image a very small portion of the seafloor at a time.
A thought experiment underscores the magnitude of this constraint. What would it take to create a “Google Ocean” of optical images with resolution analogous to that of Google Earth? To collect the optical imagery necessary to obtain the resolution provided by Google Earth, cameras would need to operate within roughly 10–20 m above the seafloor with a very limited field of view (~10 m). Given this limited field of view and the enormous area of the ocean floor, such an effort would require on the order of 34 × 109 images and, given the very slow rate of coverage for these vehicles, tens of millions of years to completely capture these images at realistic acquisition rates. Supporting these estimates, Bell et al. (2025) estimated that, to date, all efforts to image the deep seafloor since 1958 have covered only .001% of the deep seafloor. These order-of-magnitude estimates make clear that optical mapping of the complete deep ocean is not merely impractical, it is physically untenable.
From Touch to Sound: Early Seafloor Mapping
LEAD-LINE SOUNDINGS AND MILLENNIA OF CONTINUITY
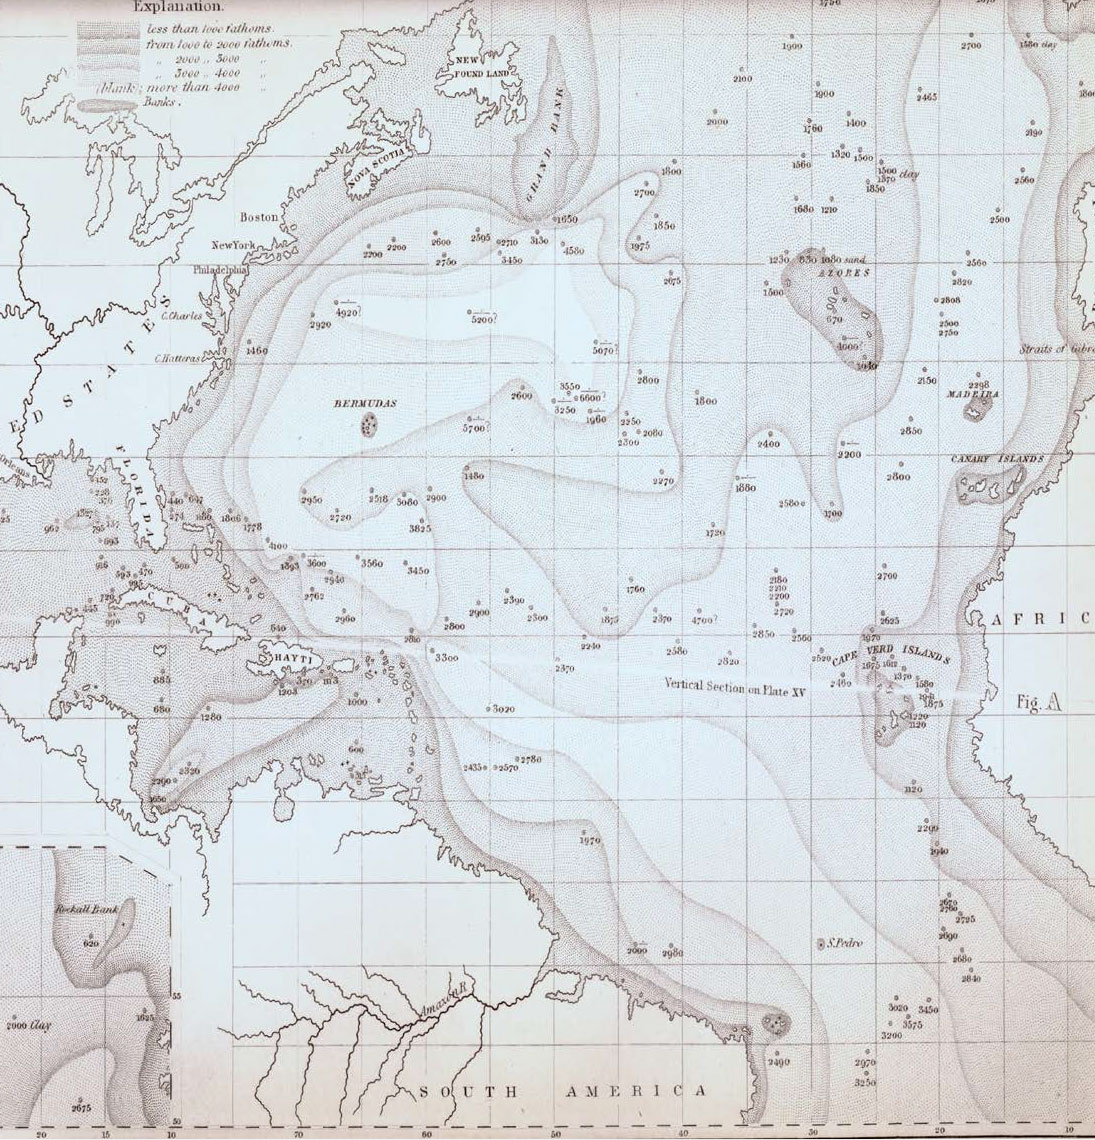
Given the limits of optical imagery—and thus the inability to use our sense of vision for mapping the seafloor—we had to turn to other senses, initially touch. For most of human history, seafloor depth measurements were made by direct physical contact. Weighted ropes or wires—lead lines—were lowered until they touched the bottom. This method, depicted in artifacts from Egyptian tombs dating back to at least 2000 BCE, remained essentially unchanged for nearly 4,000 years. Even as ship design, navigation, and seafaring expanded dramatically, the fundamental approach to measuring depth did not. Lead-line soundings can be accurate in shallow water under calm conditions, but they are slow, labor-intensive, and spatially very sparse. As water depth increases, uncertainty grows due to ship motion, current-induced line deflection, and difficulty in detecting bottom contact. Consequently, lead-line datasets provide only the coarsest representations of seafloor morphology (Figure 2).
|
|
SINGLE BEAM ECHO SOUNDING
Because sound waves propagate efficiently through seawater unlike electromagnetic waves, efforts to use sound (and thus the engagement of another sense: hearing), to measure depth and to identify icebergs accelerated in the early 1900s and marked a turning point in ocean mapping (NOAA, n.d.). Perfected through the Second World War, “single beam” echosounders were developed that allowed the rapid measurement of depth in any depth of water (assuming the frequency of the echosounder is low enough to allow it to travel to the deepest part of the ocean; for full-ocean depth measurements, echosounders typically use frequencies of 12,000 cycles/sec or 12 kHz). Single beam echosounders transmit an acoustic pulse downward and then measure the time required for the echo to return to the vessel. If the speed of sound in the water column is known, then the travel time can be converted to depth. This approach dramatically increased data acquisition rates and accuracy of depth measurements relative to lead lines.
Using an average speed of sound in seawater of 1,500 ms–1, a single measurement of depth with an echosounder in the approximately 11,000 m Challenger Deep of the Mariana Trench (the deepest place in the ocean) would take approximately 14.7 seconds for a sound wave to travel from the vessel to the seafloor and back to the vessel. A lead-line measurement in these water depths would take many hours, and it would likely be inaccurate.
While representing a tremendous leap with respect to the rate at which depth measurements could be made (and thus the number of measurements made on a given mission), single beam echosounders have limited spatial resolution on the seafloor. As the sound pulse leaves the echosounder on the ship, it expands much like a beam of light leaving a flashlight. By the time the sound pulse reaches the seafloor, it has insonified a broad conical footprint that increases in size with increasing water depth. In deep water, this footprint can be kilometers wide, but the returned signal is a single depth measurement representing the shallowest feature within that footprint rather than the point directly beneath the vessel. As a result, single beam data are spatially ambiguous and require extensive interpolation between widely spaced tracks (Figure 3). The result is a rather defocused representation of the seafloor, averaged over the spatial footprint of the sonar (usually about one-third to one-half the water depth). Typically, to visualize these data, measured points of equal depth are connected with “contour” lines, offering a crude and widely interpolated representation of the distribution of depths in a region.
|
|
Satellite Altimetry: A Global, But Coarse View
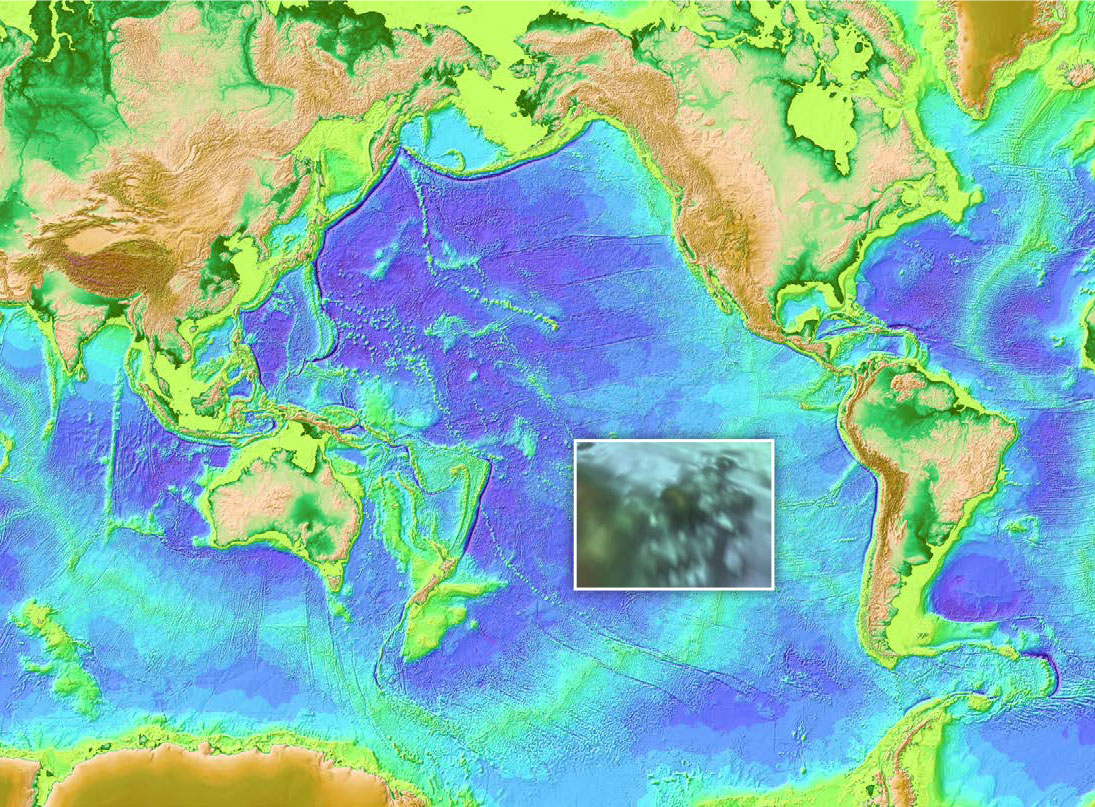
In the late 1990s, Smith and Sandwell (1997) introduced an approach to estimating seafloor depths (bathymetry) from satellite altimetry measurements. Satellite radar altimetry introduced a fundamentally different approach to seafloor mapping. Rather than measuring the depth of the seafloor directly, altimeters measure the height of the sea surface with centimeter-scale precision. Variations in sea surface height reflect gravitational anomalies caused by changes in seafloor mass distributions: the excess mass of seamounts produces positive anomalies and a slight elevation of the sea surface, while the missing mass of trenches produce negative ones and a slight depression of the sea surface. By relating the dense gravity anomaly measurements to sparse known depth measurements, Smith and Sandwell (1997) were able to produce a global interpolated grid of predicted depths. These predictions work best for long-wavelength features (~10–15 km) and are particularly good at revealing large features like mid-ocean ridges, fracture zones, and trenches on a planetary scale (Figure 4). Satellite altimetry provided the first truly global view of the ocean basins and played a critical role in advancing plate tectonic theory but is inherently coarse. Typical spatial resolution is on the order of 10–15 km, though a new satellite mission, Surface Water and Ocean Topography (SWOT), is providing resolution as fine as 4–5 km (Sandwell et al., 2025). Even this improved scale, however, is insufficient for resolving geomorphic features, habitat heterogeneity, or seafloor roughness relevant to ocean circulation and ecosystems. Satellite altimetry therefore provides a remarkable global perspective for understanding tectonic processes but is not a substitute for direct mapping.
|
|
Multibeam Sonar: A Revolution in Ocean Mapping
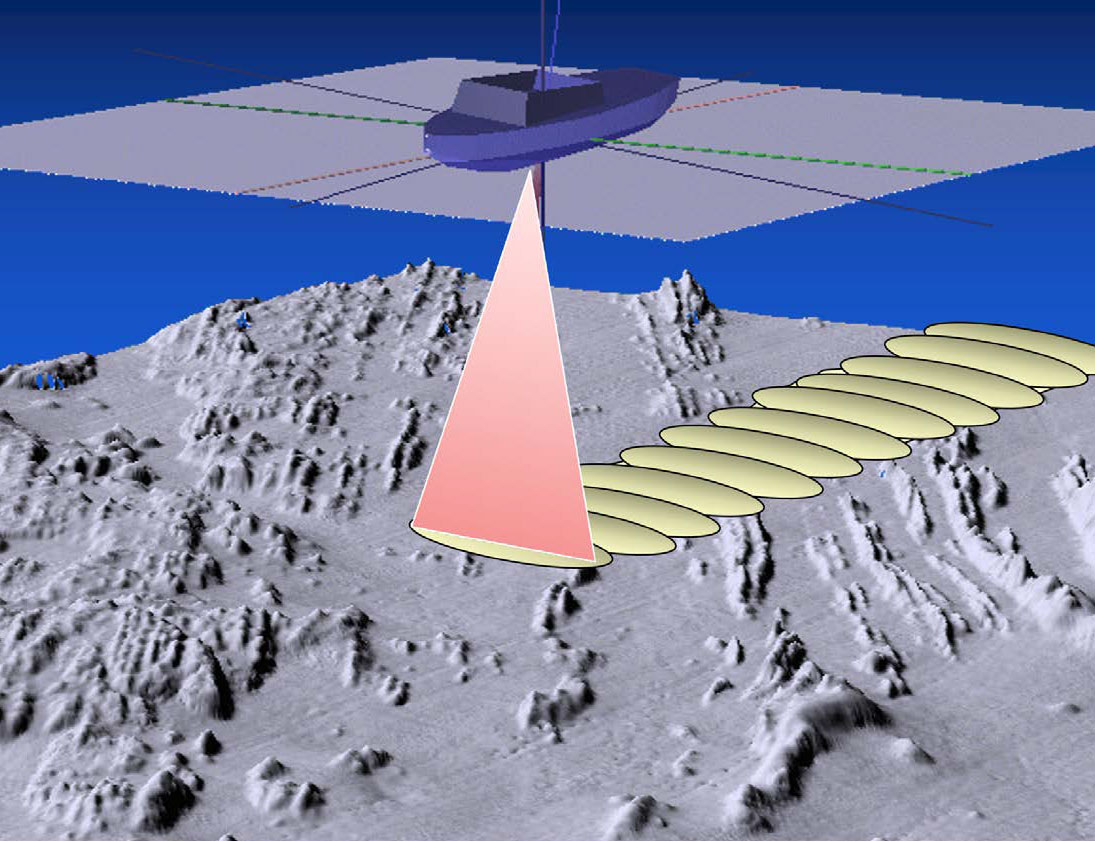
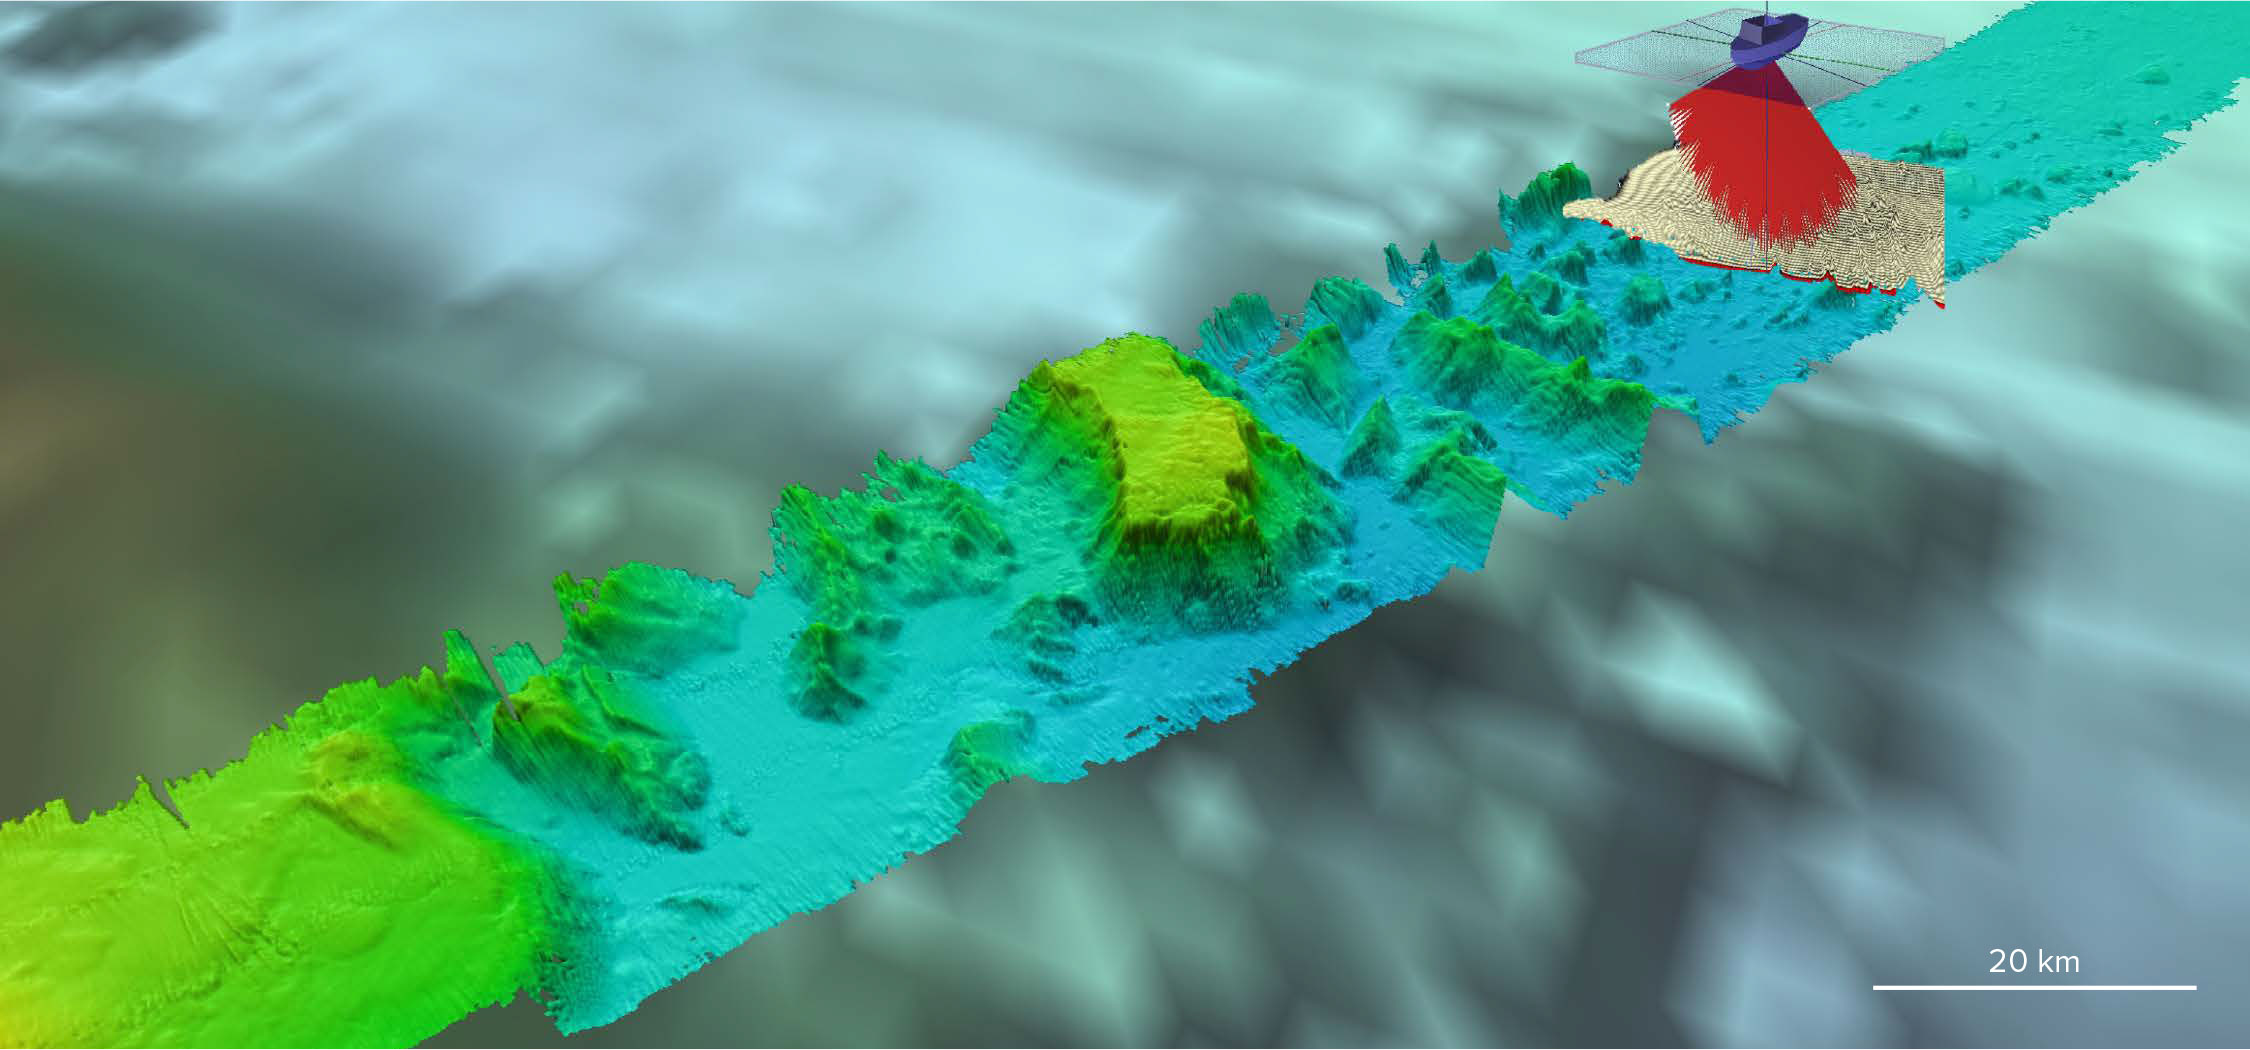
The most transformative advance in ocean mapping came with the development of multibeam echosounders (MBES), which evolved out of classified military systems in the mid-1970s and 1980s. Unlike single beam systems, multibeam sonars use a separate transmitter and receiver. The transmitter produces a fan of sound that is thin in the along-track direction and wide—typically five to seven times the water depth—in the across-track direction. The receiver simultaneously creates many, often hundreds, of small fans that are narrow in the across-track direction and wide in the along-track direction. The intersection of the transmit and receive pulses on the seafloor results in hundreds of small insonified areas on the seafloor (beams), each producing a highly accurate depth measurement (Figure 5). Typical swath widths are four to seven times the water depth (>20 km in 4,000 m of water), and the size of the beam footprint (controlling the lateral resolution of features on the seafloor) is typically on the order of 0.017% of the water depth (for a 1° beam), and thus, the spatial resolution of features in 4,000 m of water is on the order of 70 m. Hundreds of these high-resolution soundings are collected with each “ping” of the sonar (which takes place at rates ranging from many tens per second to once every 5–10 seconds depending on water depth), enabling thousands of highly accurate soundings to be collected each hour over a relatively wide swath of the seafloor. This dramatic increase in data density represented a fundamental change in our ability to map the seafloor and revolutionized the use of bathymetric data to understand ocean processes.
The introduction of multibeam sonar would not, on its own, have resulted in a revolution in ocean mapping. Fortunately, as these new sonar technologies were developed, there were concomitant advances in precise navigation, high-quality motion sensors, accurate sound-speed profiles, advanced computing, and sophisticated visualization tools. It is only through the careful integration of these components that the thousands to millions of raw acoustic travel times collected by multibeam sonars can be converted into accurate high-resolution digital terrain models. The density of data acquired by multibeam sonar allows us to return to the central role that vision plays in exploration, as the high density of multibeam sonar data support the use of modern visualization techniques that allow the production of realistic looking sun-illuminated three-dimensional (3-D) images that allow scientists to recognize patterns, infer processes, and generate hypotheses in ways that were impossible with sparse datasets (Figure 5), including details of volcanic constructs, fault scarps, submarine landslides, channels, sediment waves, and flat-topped seamounts (guyots) that record past sea level exposure. Such features provide direct evidence of tectonic, volcanic, and sedimentary processes and inform models of crustal formation, slope stability, and sediment transport. Equally important, detailed bathymetry enables quantitative analyses of seafloor roughness and slope, parameters that strongly influence ocean circulation and mixing. Seamounts and rough terrain enhance turbulence and energy dissipation, affecting deep-water stratification and heat transport—key components of climate models.
|
|
Beyond Depth: Acoustic Backscatter and Seafloor Characterization
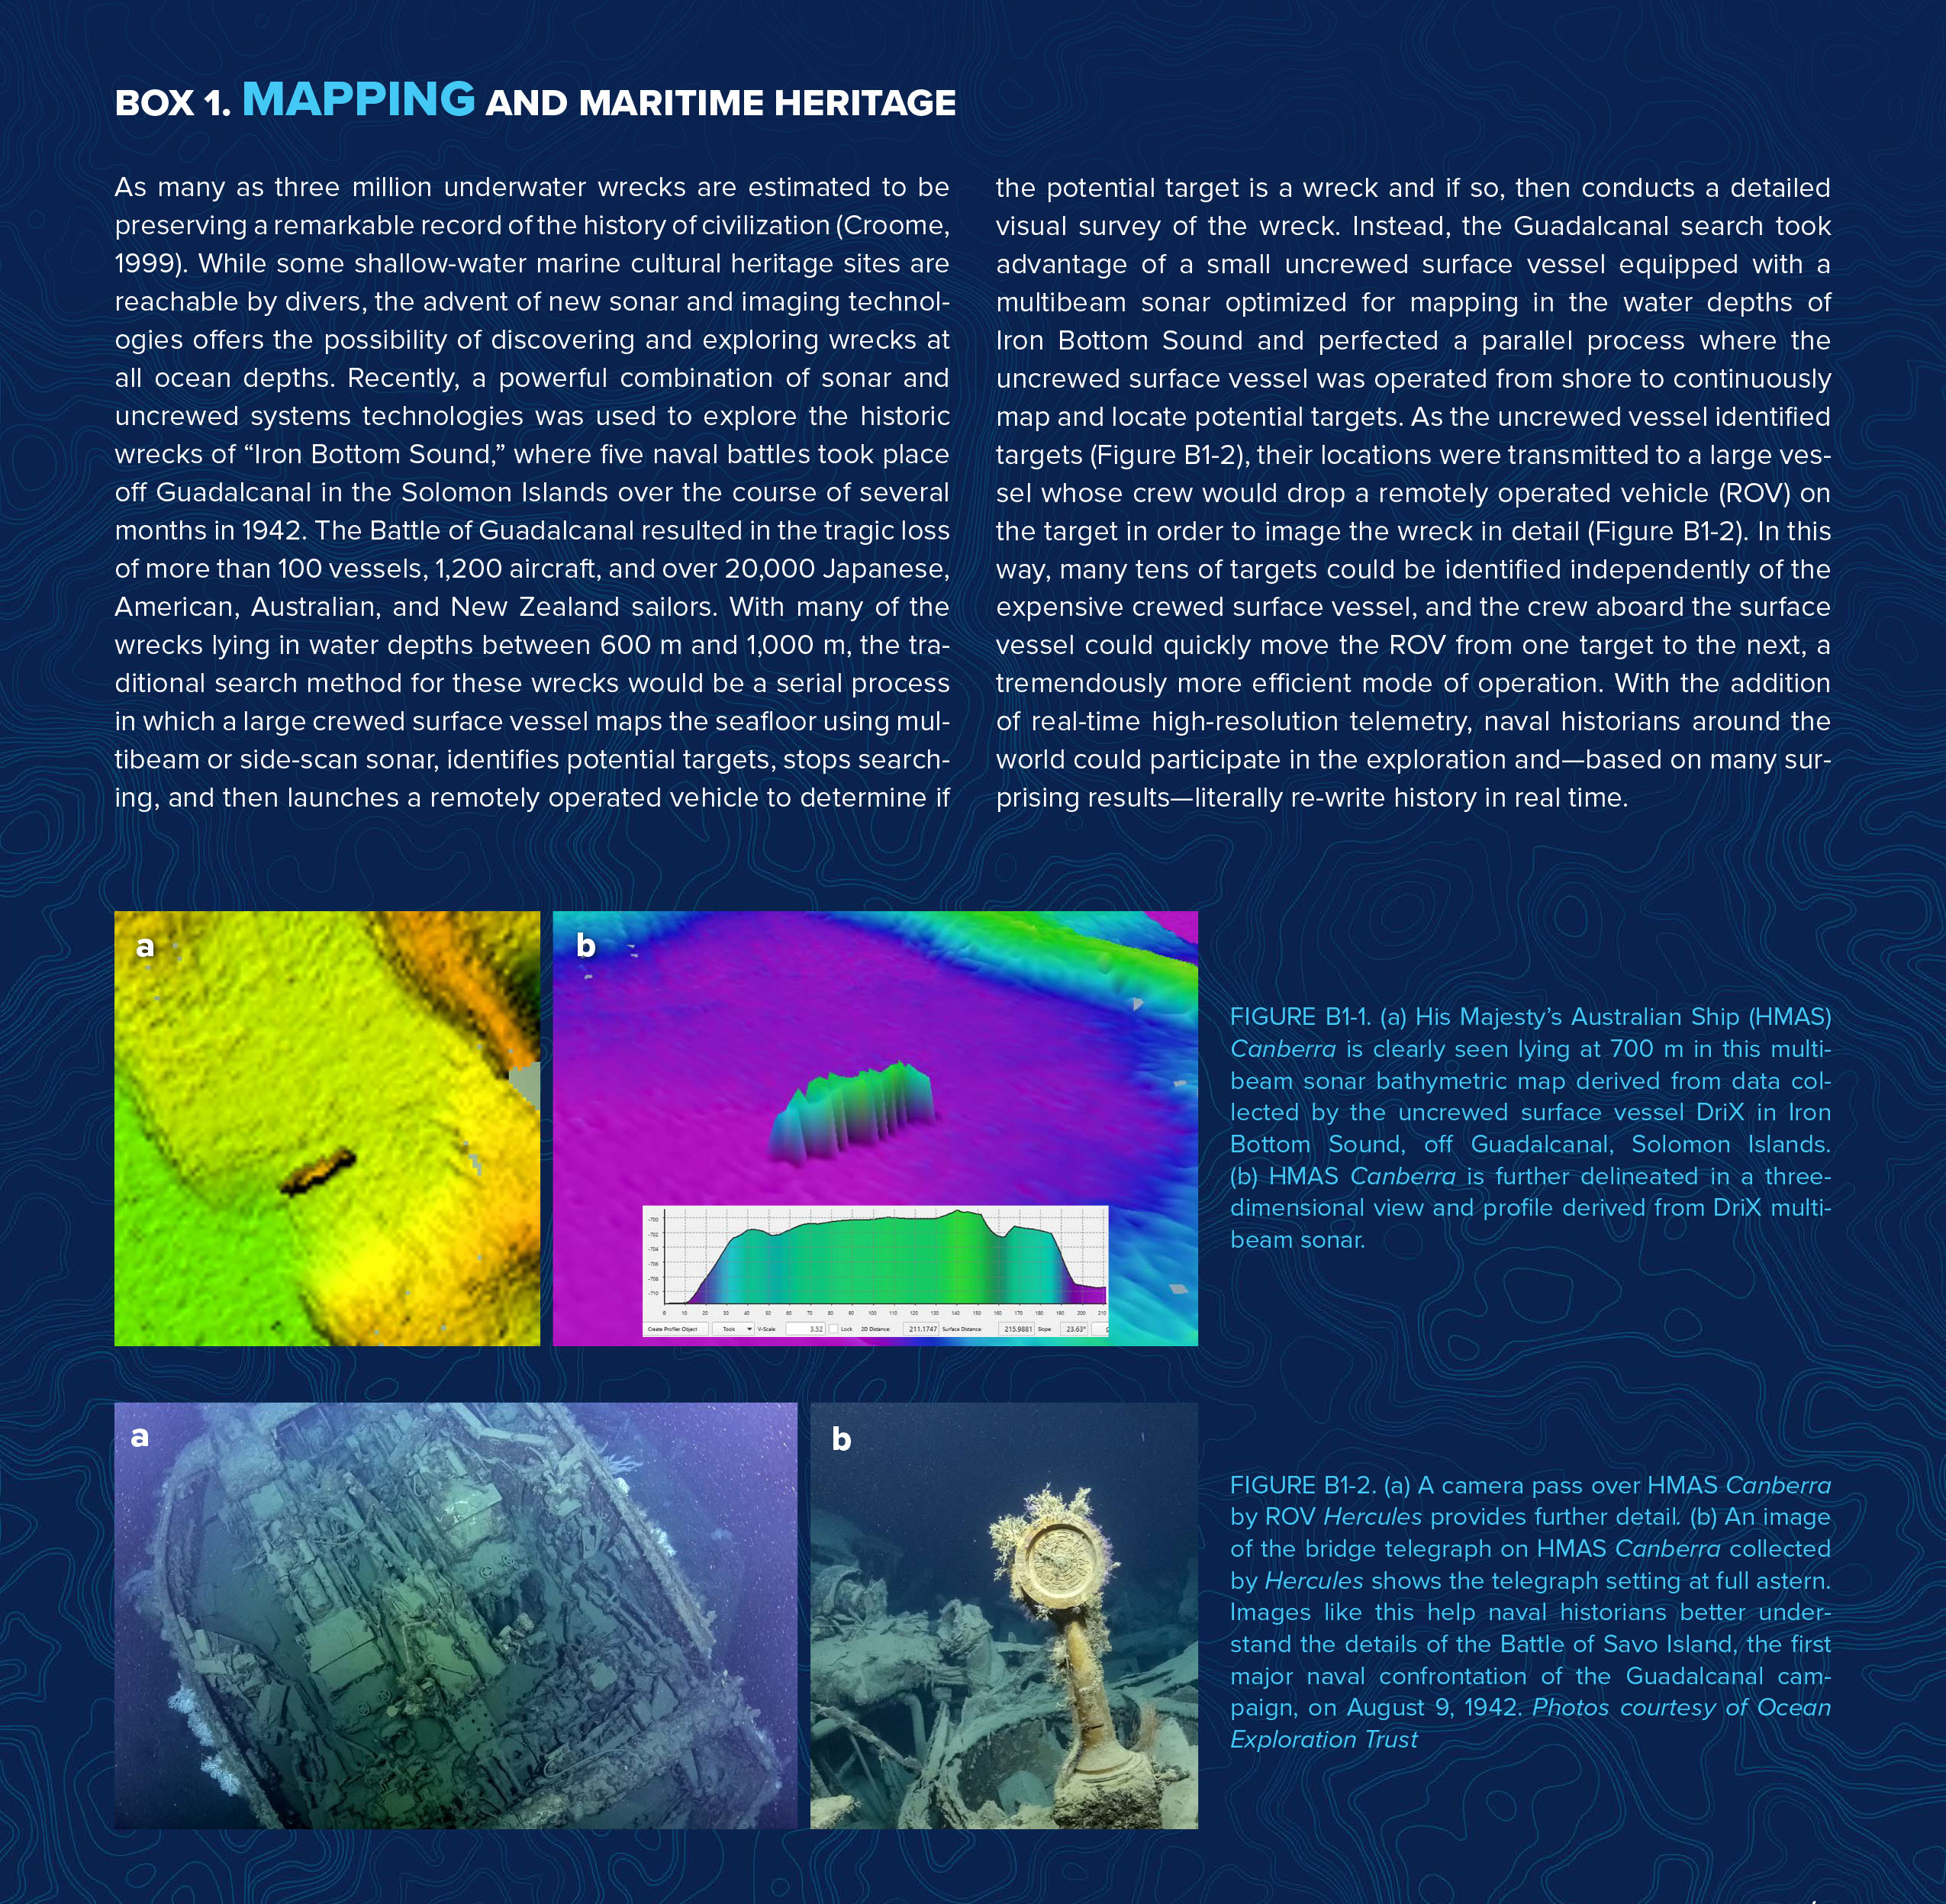
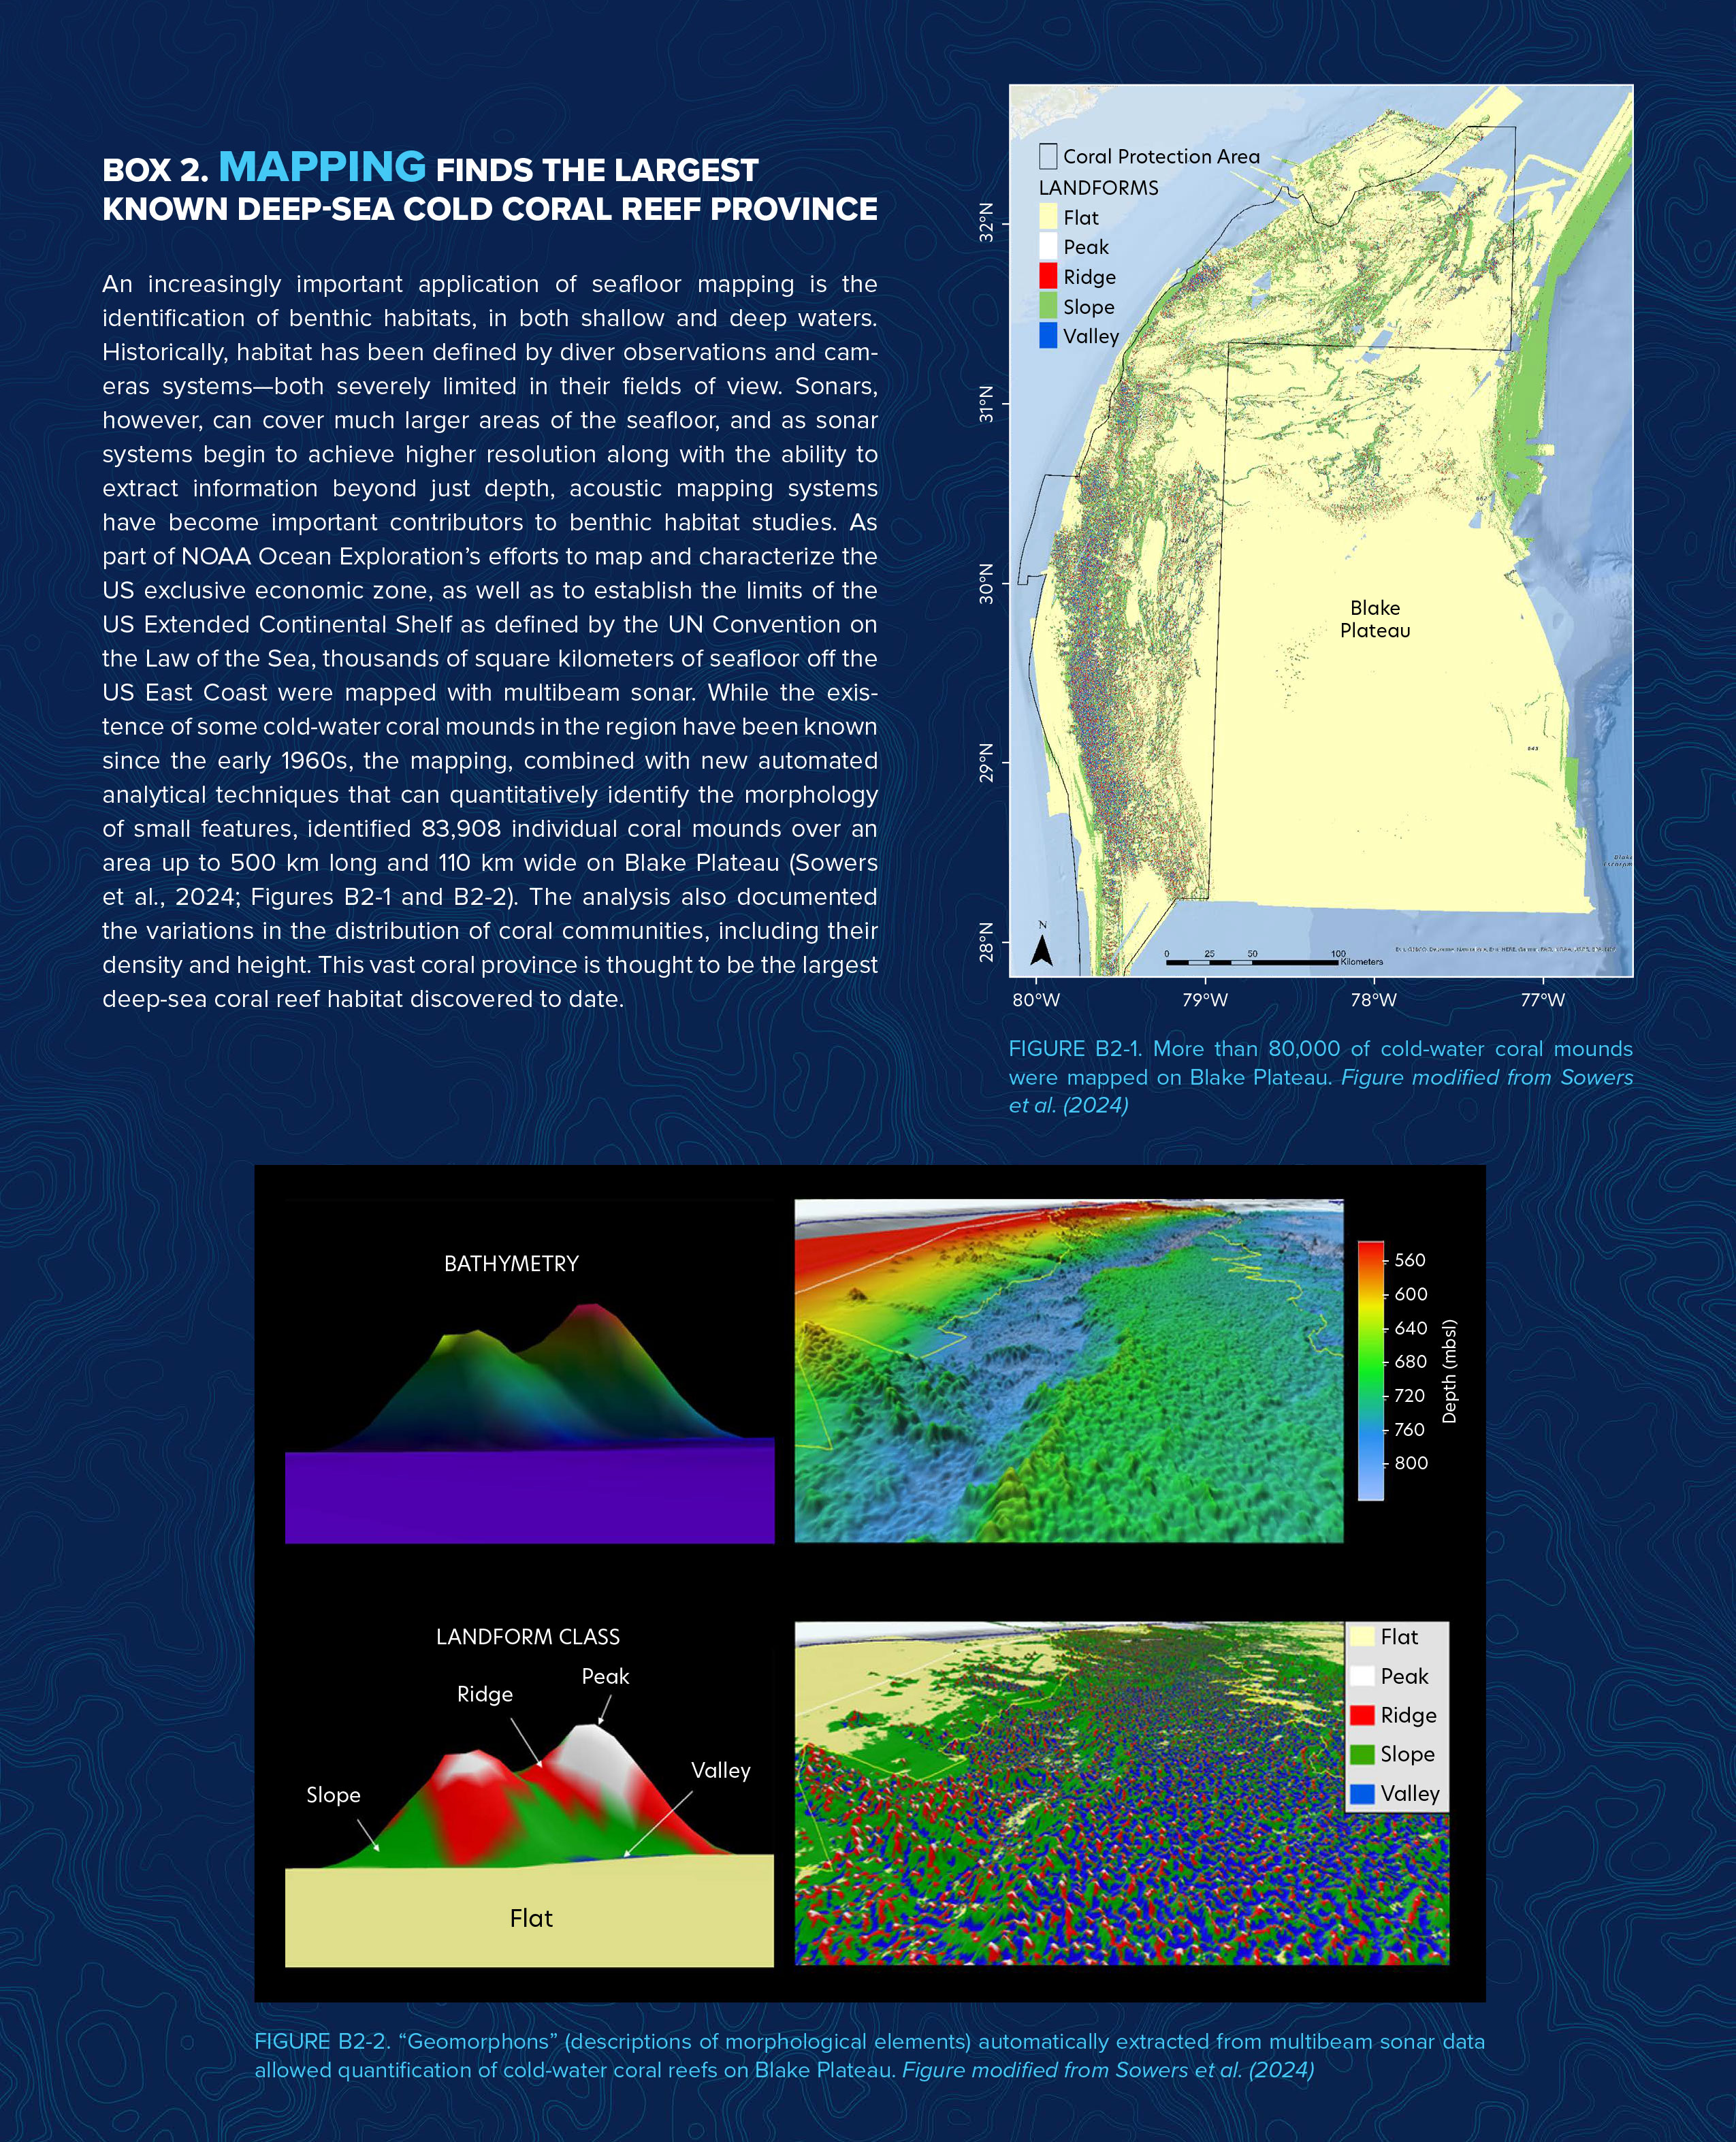
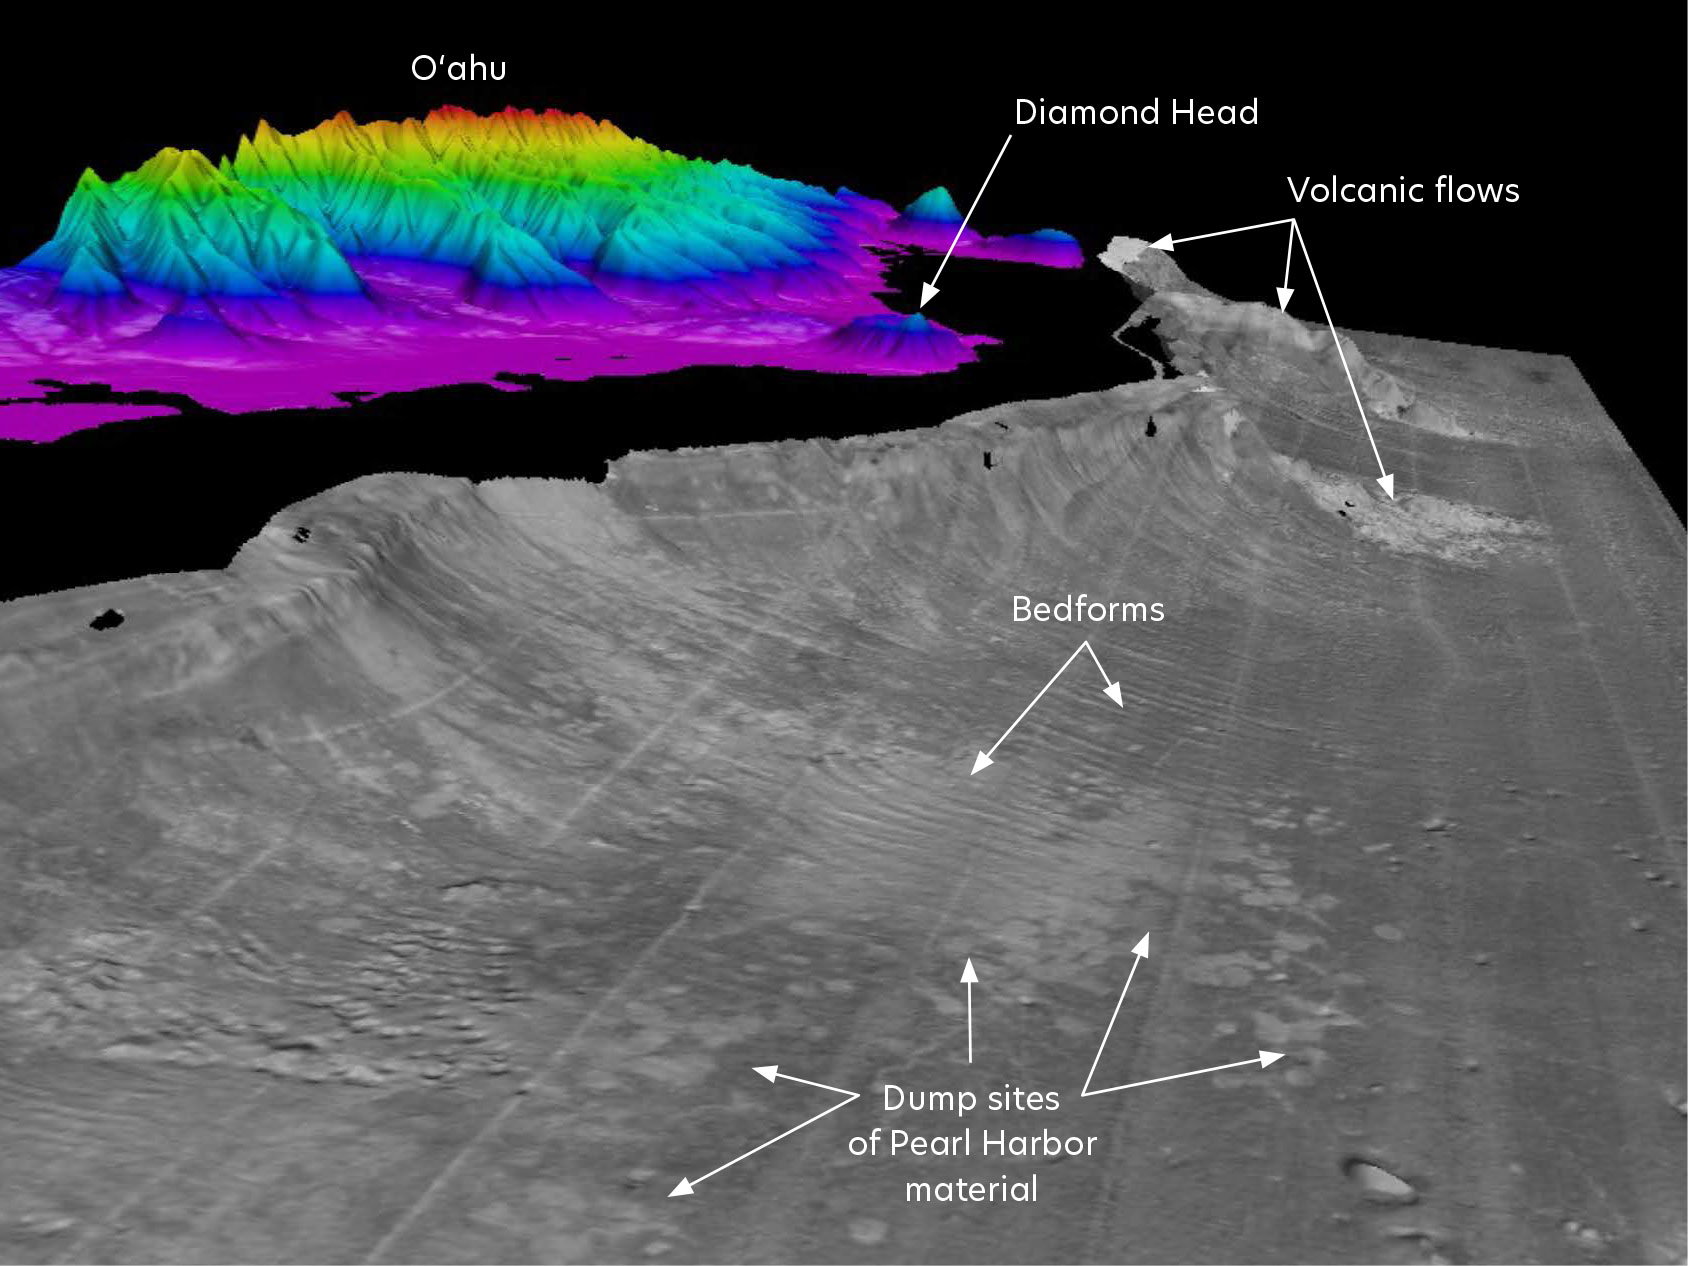
Modern multibeam systems record not only depth but also the intensity of the returned acoustic signal, known as backscatter. Backscatter varies with the properties of the seafloor, most importantly its roughness and hardness. Thus, careful mapping of seafloor backscatter provides insights into the nature of the substrate. When combined with bathymetry, backscatter allows scientists to move from identifying where the seafloor is (from the bathymetry) to inferring what it is composed of. Applications include identification of seafloor type and items on the seafloor (e.g., wrecks [Box 1] and other infrastructure), benthic habitat mapping (Box 2), detection of anthropogenic disturbances such as dredge spoil disposal (Figure 6), and many more.
|
|
|
|
|
|
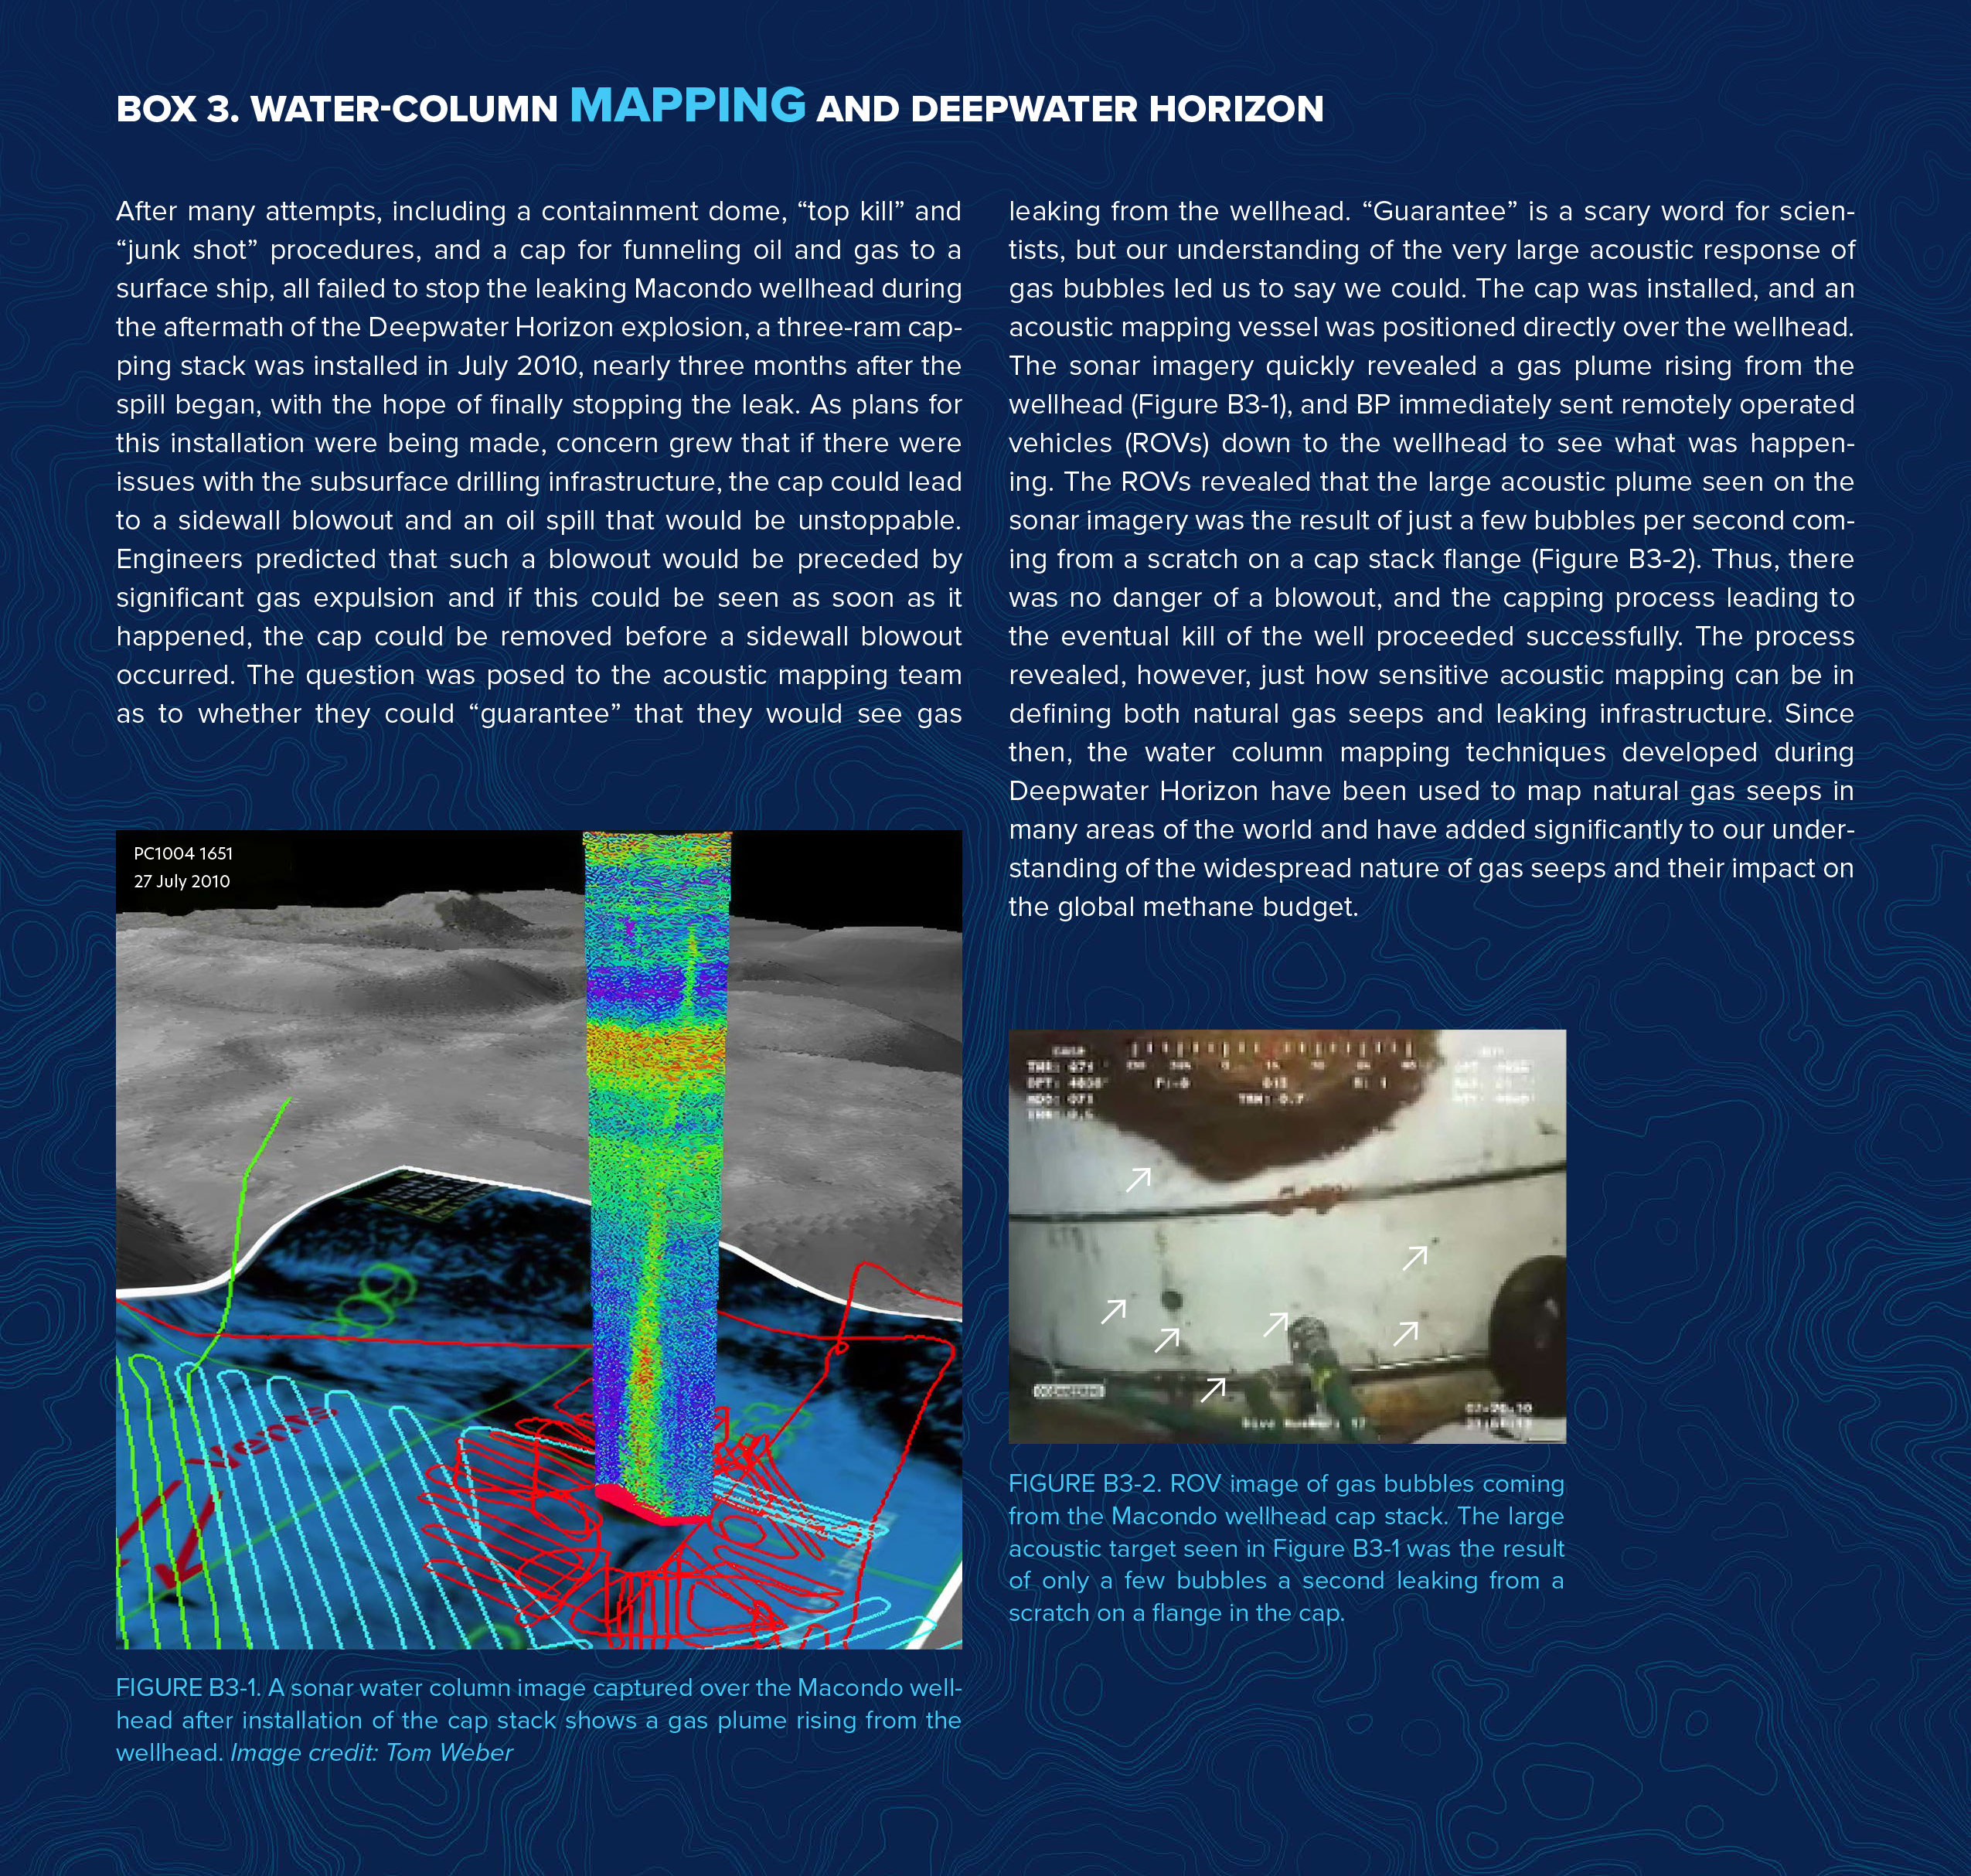
Imaging the Water Column: A Second Acoustic Revolution
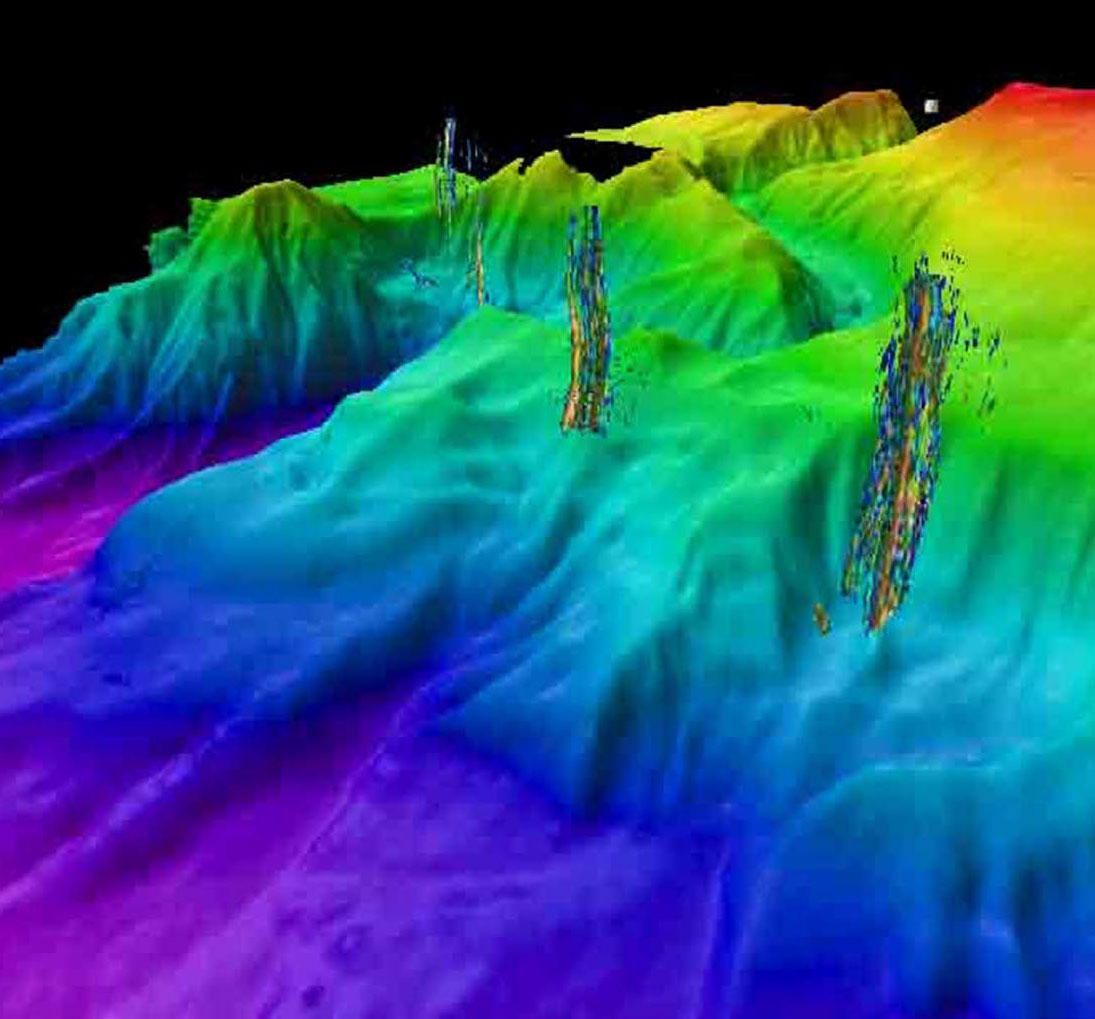
From their inception, multibeam sonars were focused on the return from the seafloor, originally only collecting depth data and then, as the systems became more sophisticated, adding seafloor backscatter measurements. To collect seafloor data, the acoustic wave had to travel through the water column, and, as computational and data storage capabilities improved, multibeam sonars began to offer the option of acquiring data in the water column. While immensely increasing data volumes, water column data also offered tremendous new insights into processes both at and near the seafloor and in the ocean’s volume. Fish schools, zooplankton layers, and other biological aggregations produce strong acoustic scattering signals in the water column. Fishery sonars had been imaging the water column for years; however, these were single beam sonars insonifying only a narrow sector of the water column. In contrast, water column data from multibeam sonars offered the opportunity to see the distribution and behavior of fish schools and other targets simultaneously over a wide area, addressing the important question of whether fish were avoiding the sonar vessel and thus biasing biomass estimates (Soria et al., 1996; Mayer et al., 2002). Similarly, gas seeps produce strong acoustic targets; the ability for multibeam sonars to visualize gas seeps was clearly demonstrated during the test of a newly installed water column-capable multibeam sonar on NOAA Ship Okeanos Explorer off the coast of northern California where natural methane gas seeps were clearly seen rising more than 1,400 m from the seafloor (Gardner et al., 2009; Figure 7).
|
|
Water column mapping proved invaluable in 2010 during the Deepwater Horizon incident, where acoustic monitoring was used following explosion of the drill rig to assess wellhead integrity after capping (Hickman et al., 2013; Box 3). These observations demonstrated the ability of multibeam systems to detect even small leaks and distinguish them from background noise, and they have led to the use of multibeam sonars to broadly map and estimate the distribution of both natural and human-made gas seeps in the ocean—underestimated contributors to ocean acidification and in some cases atmospheric CO2 (Weber et al., 2012; Ruppel et al., 2024).
|
|
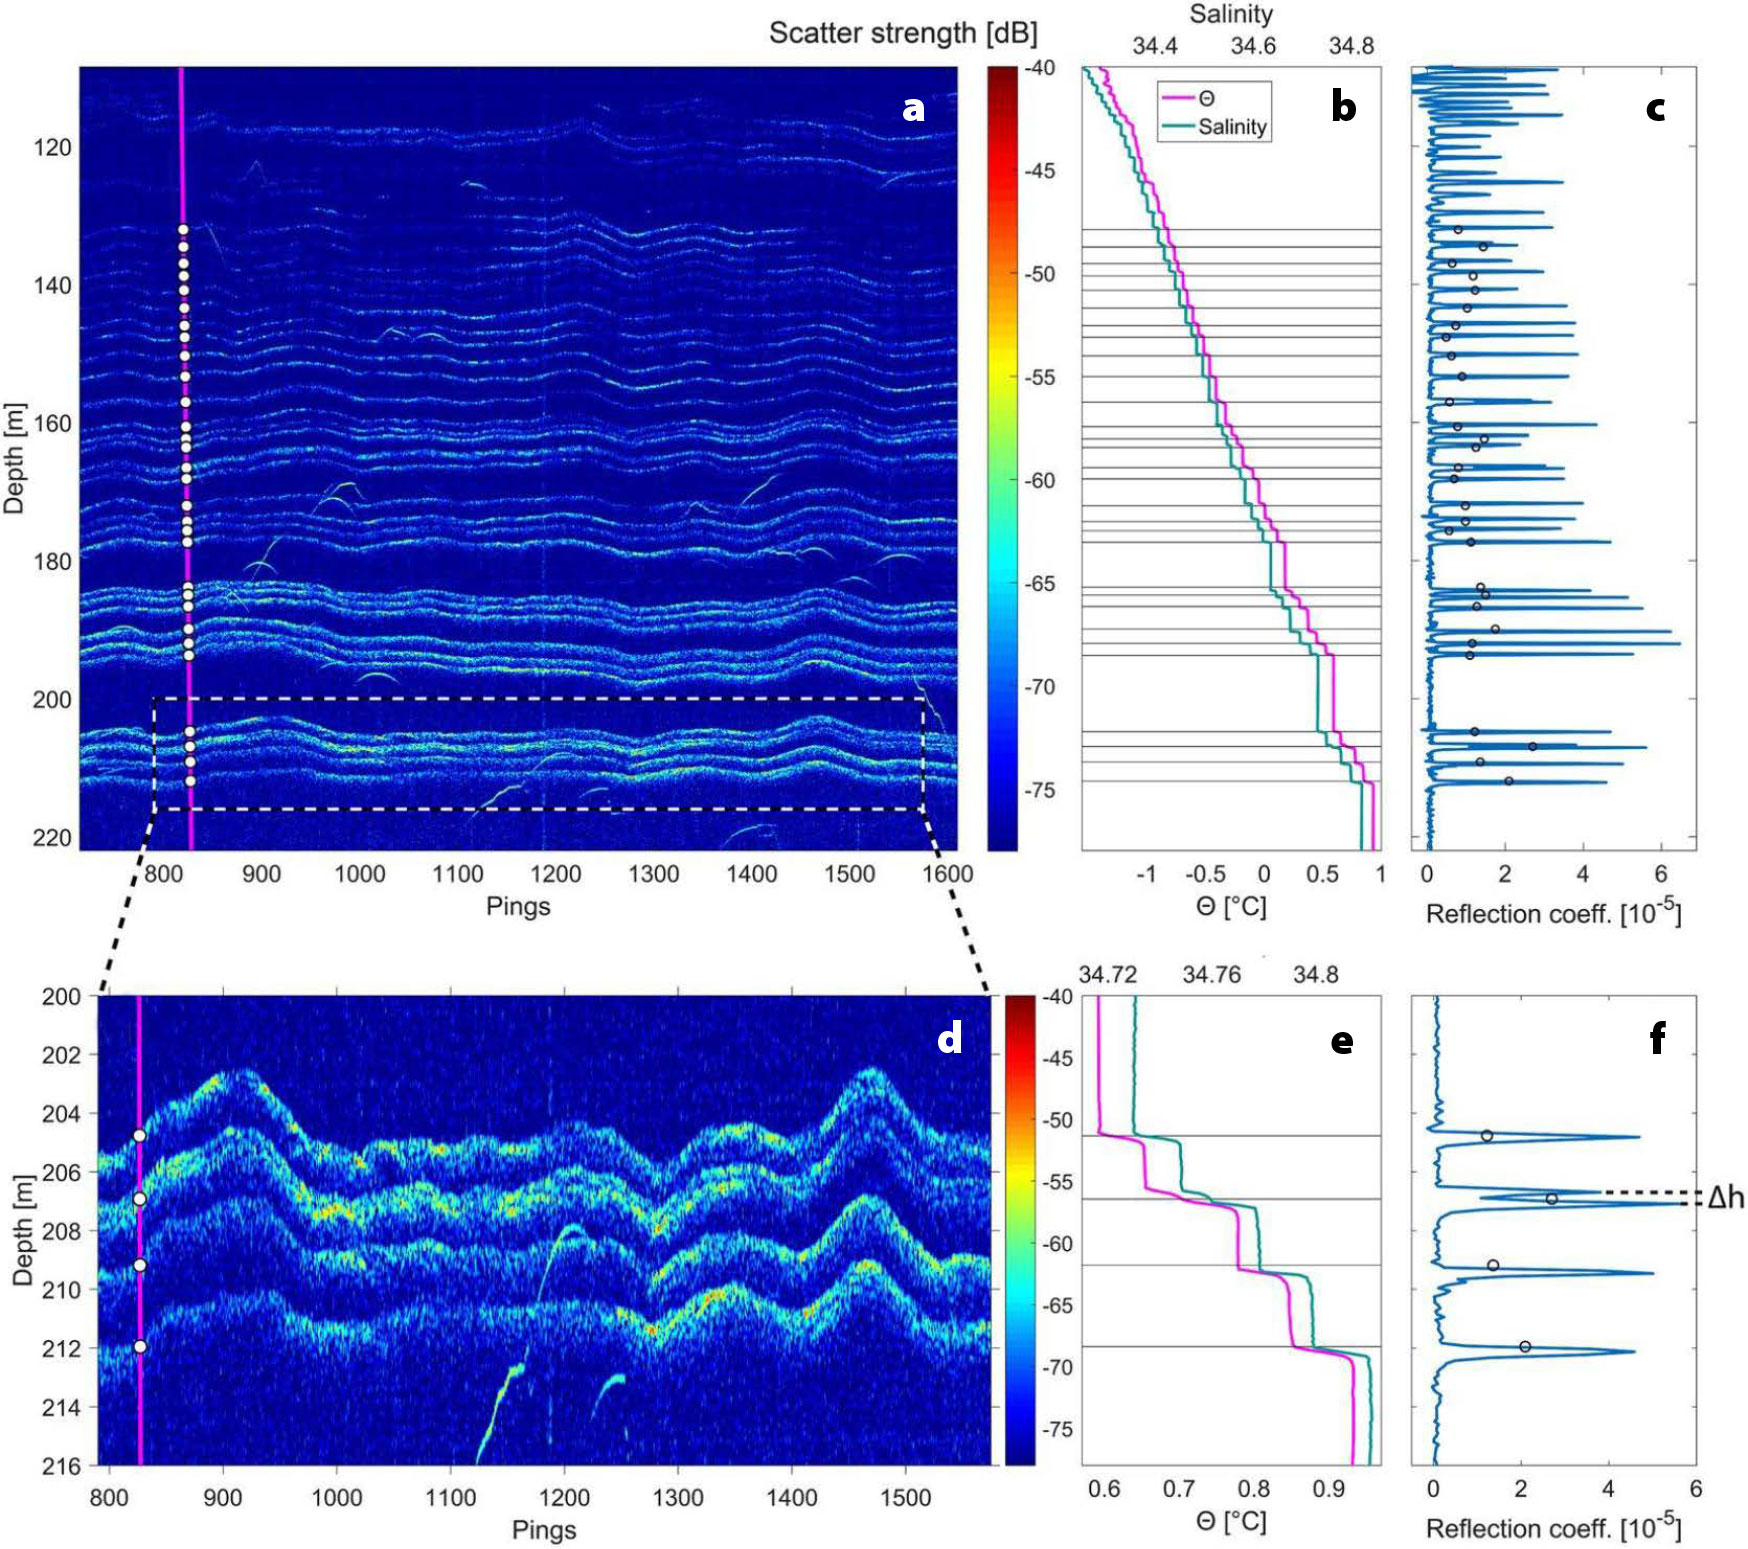
Perhaps one of the most exciting applications of midwater mapping is the ability of our sonar systems to reveal physical oceanographic changes in the water column. Internal waves, pycnoclines, turbulence, thermohaline staircases, mixed-layer depth, and anoxic layers have all been imaged acoustically (some with multibeam sonar and some with single beam fisheries sonars), in each case revealing fine-scale structure previously accessible only through direct point measurements with conductivity, temperature, depth sensors (CTDs) or microturbulence sensors (Colbo et al., 2014; Stranne et al., 2017, 2018; Weidner et al., 2020; Figure 8). These observations are opening new horizons for the understanding of mixing processes and stratification in both polar and temperate oceans.
|
|
How Much Is Mapped?
We have come a long way, from 4,000 years of measuring depth with lead lines to modern multibeam sonars capable of covering wide swaths of the seafloor with high resolution. Most modern research vessels and many commercial and military vessels carry multibeam sonars, and these vessels have been collecting mapping data for the past 40 years. Despite these efforts, by 2017, only approximately 6% of the global seafloor had been mapped using modern techniques (i.e., single beam or multibeam sonars). Recognizing the critically important roles that mapping plays in understanding our ocean, the Nippon Foundation established an ambitious and aspirational international mission to inspire ocean mapping and deliver a complete seabed map for the benefit of people and the planet. This effort, the Nippon Foundation/GEBCO Seabed 2030 program, comprises a series of regional centers that have discovered unpublished data and facilitated collection of new data, all of which are added to the publicly available GEBCO global bathymetric grid. Since its inception in 2017, global coverage of modern bathymetric data has increased from 6% to 28.7% in 2026 (Seabed 2030, 2026).
The United States also recognized the critical importance of mapping data for managing and protecting its offshore resources by establishing the National Ocean Mapping, Exploration, and Characterization (NOMEC) Council under a 2019 Presidential Memorandum. NOMEC contributes to the global Seabed 2030 initiative and calls for the complete mapping of the deeper waters of the US exclusive economic zone by 2030 and the shallow waters by 2040.
While these efforts have greatly accelerated the rate of seafloor mapping, almost 75% of the global seafloor remains unmapped. How long would it take to map the remaining 75%? Using our best estimate of the distribution of depths (the mapping effort changes radically with water depth as the swath width changes) and assuming the use of current technology (large research vessels with deep-water multibeam systems), it has been estimated that it would take between 200 and 350 ship-years to map the ocean deeper than 200 m at the resolutions specified by Seabed 2030 (Mayer et al., 2018). Assuming an average day rate of $50,000 for a large research vessel, the estimated cost would be between three and five billion dollars.
While it might seem unrealistic to spend several billion dollars to completely map the ocean, the reality is that we have spent much more than that to map other planets. To date, the global community has launched 18 orbiters to Mars, resulting in the near complete mapping of that planet at a resolution of 6 m or better (Zurek et al., 2024). Each mission costs somewhere between $300M and $1B, and thus more than approximately $11B has already been spent to map Mars. This is not to demean the tremendous technological achievement of mapping Mars nor the importance of these maps in understanding planetary origins and planning future missions; however, one cannot help but ask why we are not willing to put a similar level of investment into mapping our own planet. The typical response is that it is actually harder to map the deep ocean than it is to remotely map Mars from an orbiter (which is true), but as has been demonstrated above, even with current technology, we have the ability to map the entire ocean, and, for the same (or less of an) investment than we have put into mapping Mars, it can be done.
Can Technological Innovation Reduce the Cost and Effort?
The cost and time estimates discussed above assume the use of current technologies for ocean mapping—that is, the use of large multibeam-sonar-equipped research vessels. Can technical innovations reduce these costs and make the goal of complete mapping of the ocean more obtainable? There are a limited number of large research vessels with many demands on their time beyond mapping. If we are to achieve comprehensive coverage, we must find means to scale ocean mapping beyond the use of traditional research vessels.
UNCREWED OR MINIMALLY CREWED SURFACE VESSELS
One of the largest expenses associated with traditional research vessels is the cost of the crew. If we can eliminate or minimize crew costs, significant savings can be had. AUVs have matured greatly over the past 60 years and are now available in a range of sizes serving many applications (Wynn et al., 2014; Ma et al., 2025). These vehicles typically operate near the bottom (and thus cannot use GPS for navigation), have limited endurance, and move rather slowly (in efforts to extend endurance). They present the only means to collect extremely high-resolution mapping data in very deep waters, as their sonars are near the bottom; however, their slow speed, limited endurance, small area of coverage (because they are near the bottom), and navigational challenges make them less than ideal for comprehensive mapping of the global ocean at this time.
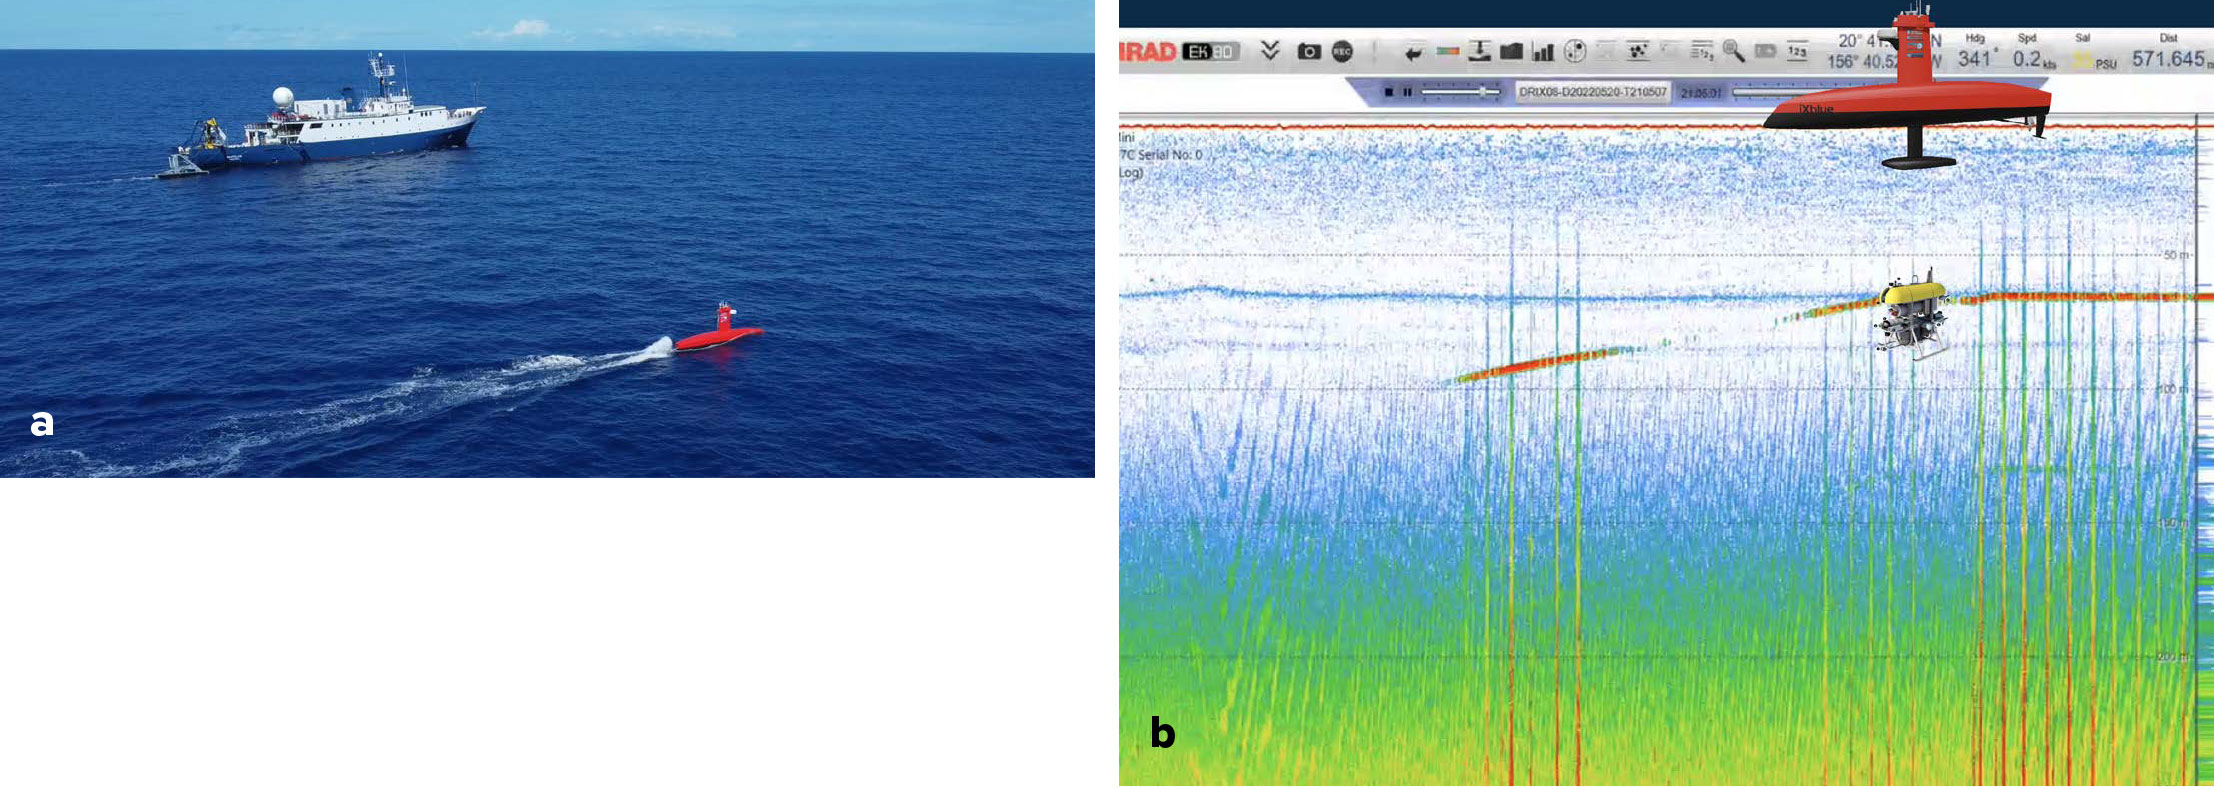
In contrast to fully crewed research vessels, uncrewed or minimally crewed surface vessels (USVs or MCSVs) offer the possibility to field platforms of sufficient size to carry the large sonars needed to map in deep water and potentially to provide the speed and endurance that will allow efficient scaling of the ocean mapping problem. Small uncrewed vessels have proven effective force-multipliers for shallow water mapping (e.g., Journal of Petroleum Geology, 2023), and medium-to-small USVs have proven remarkably valuable for expanding the footprint of ocean exploration by monitoring the activities of AUVs and, in real time, directing these vehicles to specific targets in the water column. For example, recently in the mid-Pacific, a 7.7 m USV deployed from a mother ship was used to map mid-water acoustic targets (scattering layers) and was able to track and direct a small AUV (Mesobot) directly into the scattering layer before turning on environmental DNA samplers and high-resolution video, all while the mother ship was free to carry on other activities. This new approach to “Verified Directed Sampling” promises capability for estimating biodiversity in the mesosphere and improving our understanding of the nature of mid-water scattering layers (Mayer, 2023; Govindarajan, 2025; Figure 9). We are, however, still in the early days of development of USVs that are large enough and have the endurance to carry out long-range deep-ocean mapping missions. Challenges include operations in extreme environments, long-term reliability, and truly autonomous behaviors that include obstacle avoidance and dynamic decision-making (Norazaruddin et al., 2024).
|
|
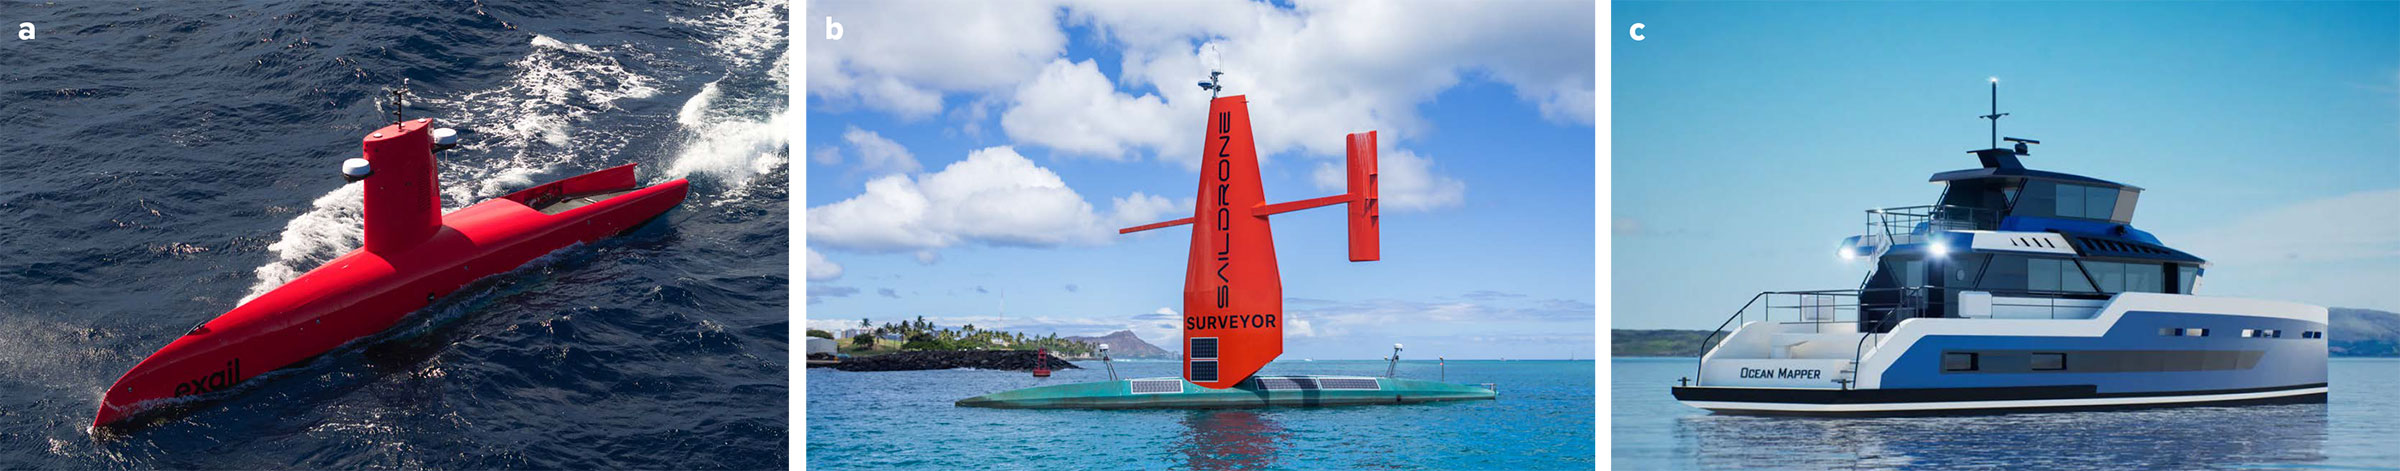
Several vendors are bringing to market large uncrewed vessels designed to carry deep-water sonars that may have the speed, range, and endurance to potentially provide a scalable and cost-effective alternative to traditional research vessels (e.g., Exail, Ocean Infinity). Addressing the other major costs associated with traditional research vessels, large sail-powered uncrewed vessels have been developed and are currently collecting mapping data while exploring the trade-offs between slower rates of coverage and potentially extended endurance (Figure 10). Because there is still much to be learned about the best operational modes for these vessels and their shore-based crewing requirements, questions remain about the overall cost-effectiveness of their operation. As experience is gained and lessons are learned from operating these systems, their viability and the role they can play in the complete mapping of the global ocean will be better understood (Mayer, 2023).
Mindful of the tremendous technological and safety concerns of operating USVs on the open seas, ocean, land, and ice explorer and venture capitalist Victor Vescovo is constructing a small (24 m), minimally (one- or two-person) crewed vessel whose only purpose would be to map. This “Ocean Mapper” is estimated to be an order of magnitude cheaper to operate than a traditional ocean-going research vessel, and serves as a challenge to others to build similar vessels so that a fleet of these relatively inexpensive to operate vehicles can address the goal of completely mapping the oceans (Dunn, 2025; Figure 10).
|
|
OTHER INNOVATIONS
While the efforts described above have focused on decreasing the cost of collecting multibeam sonar data, deep-water multibeam sonars are inherently large and expensive. To supplement multibeam sonar data, others are looking at ways to increase the use of simpler and cheaper single beam sonars and to find ways to deploy them in remote areas of the ocean.
One approach to this is to engage the “crowd,” the millions of recreational and commercial vessels that carry echosounders but do not commonly record the depth information. To address this, efforts are now underway to create very inexpensive devices that are easily attached to most any vessel’s echosounder, perform internal calibrations, and even transmit those data to the national data archive (Calder et al., 2020). This approach has proven successful when applied to the commercial fishing sector (Novaczek et al., 2019), and its expansion to the broader community can add important new data to the global database.
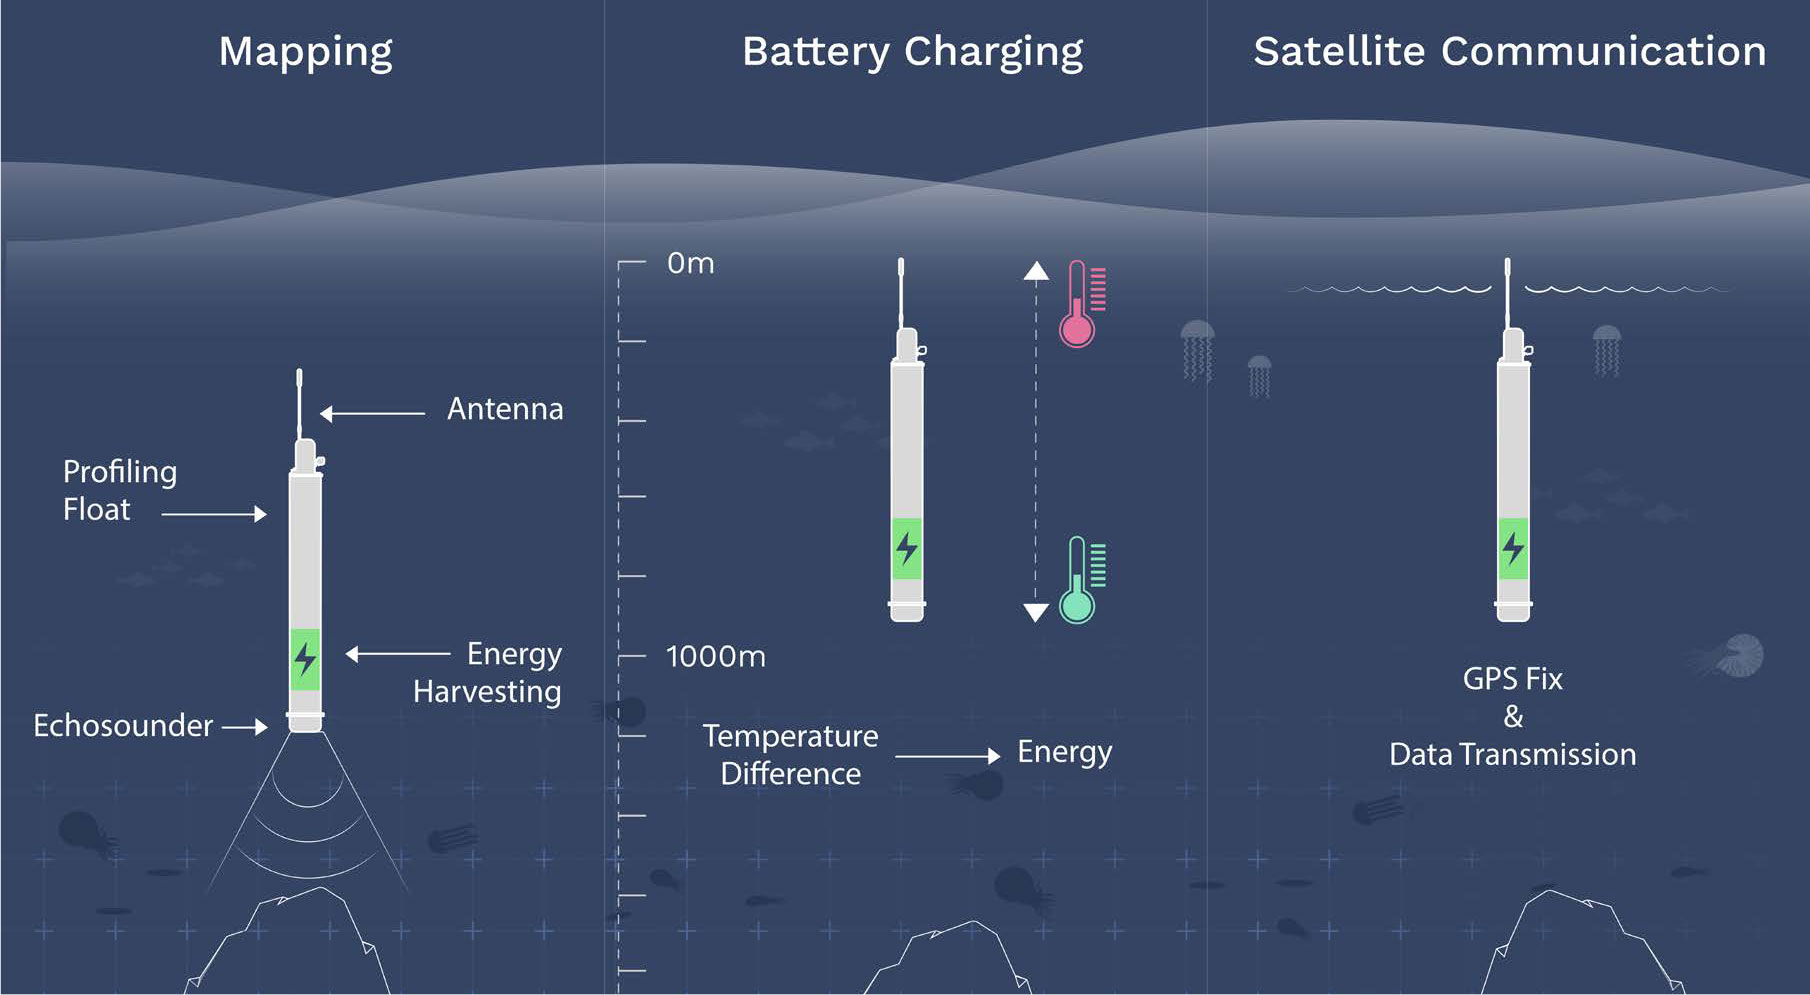
Crowd-sourced bathymetry tends to focus on shallow water areas and regions that are well traveled by commercial vessels. To address the issue of collecting data in the most remote regions, specialized profiling floats have been designed that use the thermal difference in the upper part of the water column to supply power to drive a buoyancy engine and a narrow beam echosounder. These floats can be deployed in the most remote regions of the ocean to drift for many years while moving up and down in the water column to harvest power as they collect several soundings a day, each time surfacing and sending data back to shore-based repositories via satellite (Mayer, 2023; Figure 11).
|
|
Recently, researchers at MIT/Lincoln Labs have proposed a truly innovative way to address seafloor mapping. Their approach uses the concept of a sparse array where many small autonomous vessels move together to create a very large (e.g., 40 km × 40 km) array, with some of the vessels sending out sonar pings that are then received by the rest of the vessels. Smaller prototypes have been built and tested, but, working at full scale, the approach has the potential to achieve both much better resolution and greater coverage than a conventional multibeam sonar (Ryu et al., 2023). Together, these approaches suggest that complete mapping of the global ocean may be technically achievable within decades.
From Quest to Planetary Responsibility
For me, the pursuit of ocean mapping began as an adventure, driven by curiosity and the desire to explore. As the field has progressed to the point where we can, at relatively high-resolution, visualize the fine-scale features of the deep-sea floor, I have learned that the information provided by detailed ocean mapping represents a foundational requirement for managing the Earth system, and my adventure-driven quest has evolved into a quest to achieve something important. The remaining unmapped ~75% of the seafloor represents not merely unexplored territory but unresolved risks to navigation, climate prediction, hazard mitigation, resource exploration, environmental stewardship, and the potential for yet-unknown discoveries. The tools to complete a map of the global ocean now exist or are rapidly emerging. What remains is the need for a collective decision (and the fiscal will) to recognize that the complete mapping of the ocean is essential to understanding—and responsibly managing—our planet. The quest continues.
|
|