Full Text
Overview: Seafloor Monitoring in Greenland
Arctic environments are changing rapidly. To assess climate change impacts and guide conservation, there is a need to effectively monitor areas of high biodiversity that are difficult to access, such as the deep sea. Greenland (Kalaallit Nunaat), like many remote countries with large deep-sea exclusive economic zones (EEZs), lacks consistent access to the funding and logistics required to maintain advanced and expensive technologies for seafloor exploration. To fill this need, video and camera imaging technologies have been adapted to suit the unique requirements of Arctic environments and the social and economic needs of Greenland. Since 2015, a benthic monitoring program carried out by the Greenland Institute of Natural Resources (GINR) has provided the only large-scale, comprehensive survey in this region, including collection and analysis of photos and GoPro video footage recorded as deep as 1,600 m (Blicher, and Arboe, 2021). In line with the “collect once, use many times” principle, GINR is exploring the versatility of these data, which were originally designated for monitoring and evidence-based management. A potential research avenue for these data is polar blue carbon—the carbon stored and sequestered in ocean habitats—including benthic communities that either live on the seafloor (such as corals and sponges) or are transported there by ocean currents (such as algal detritus). This paper outlines Greenland’s affordable deep-sea technology, based on a towed camera system (Yesson, 2023), and its potential application to rapid, standardized artificial intelligence (AI)-based analysis.
Greenland’s Low-Tech Towed Camera System
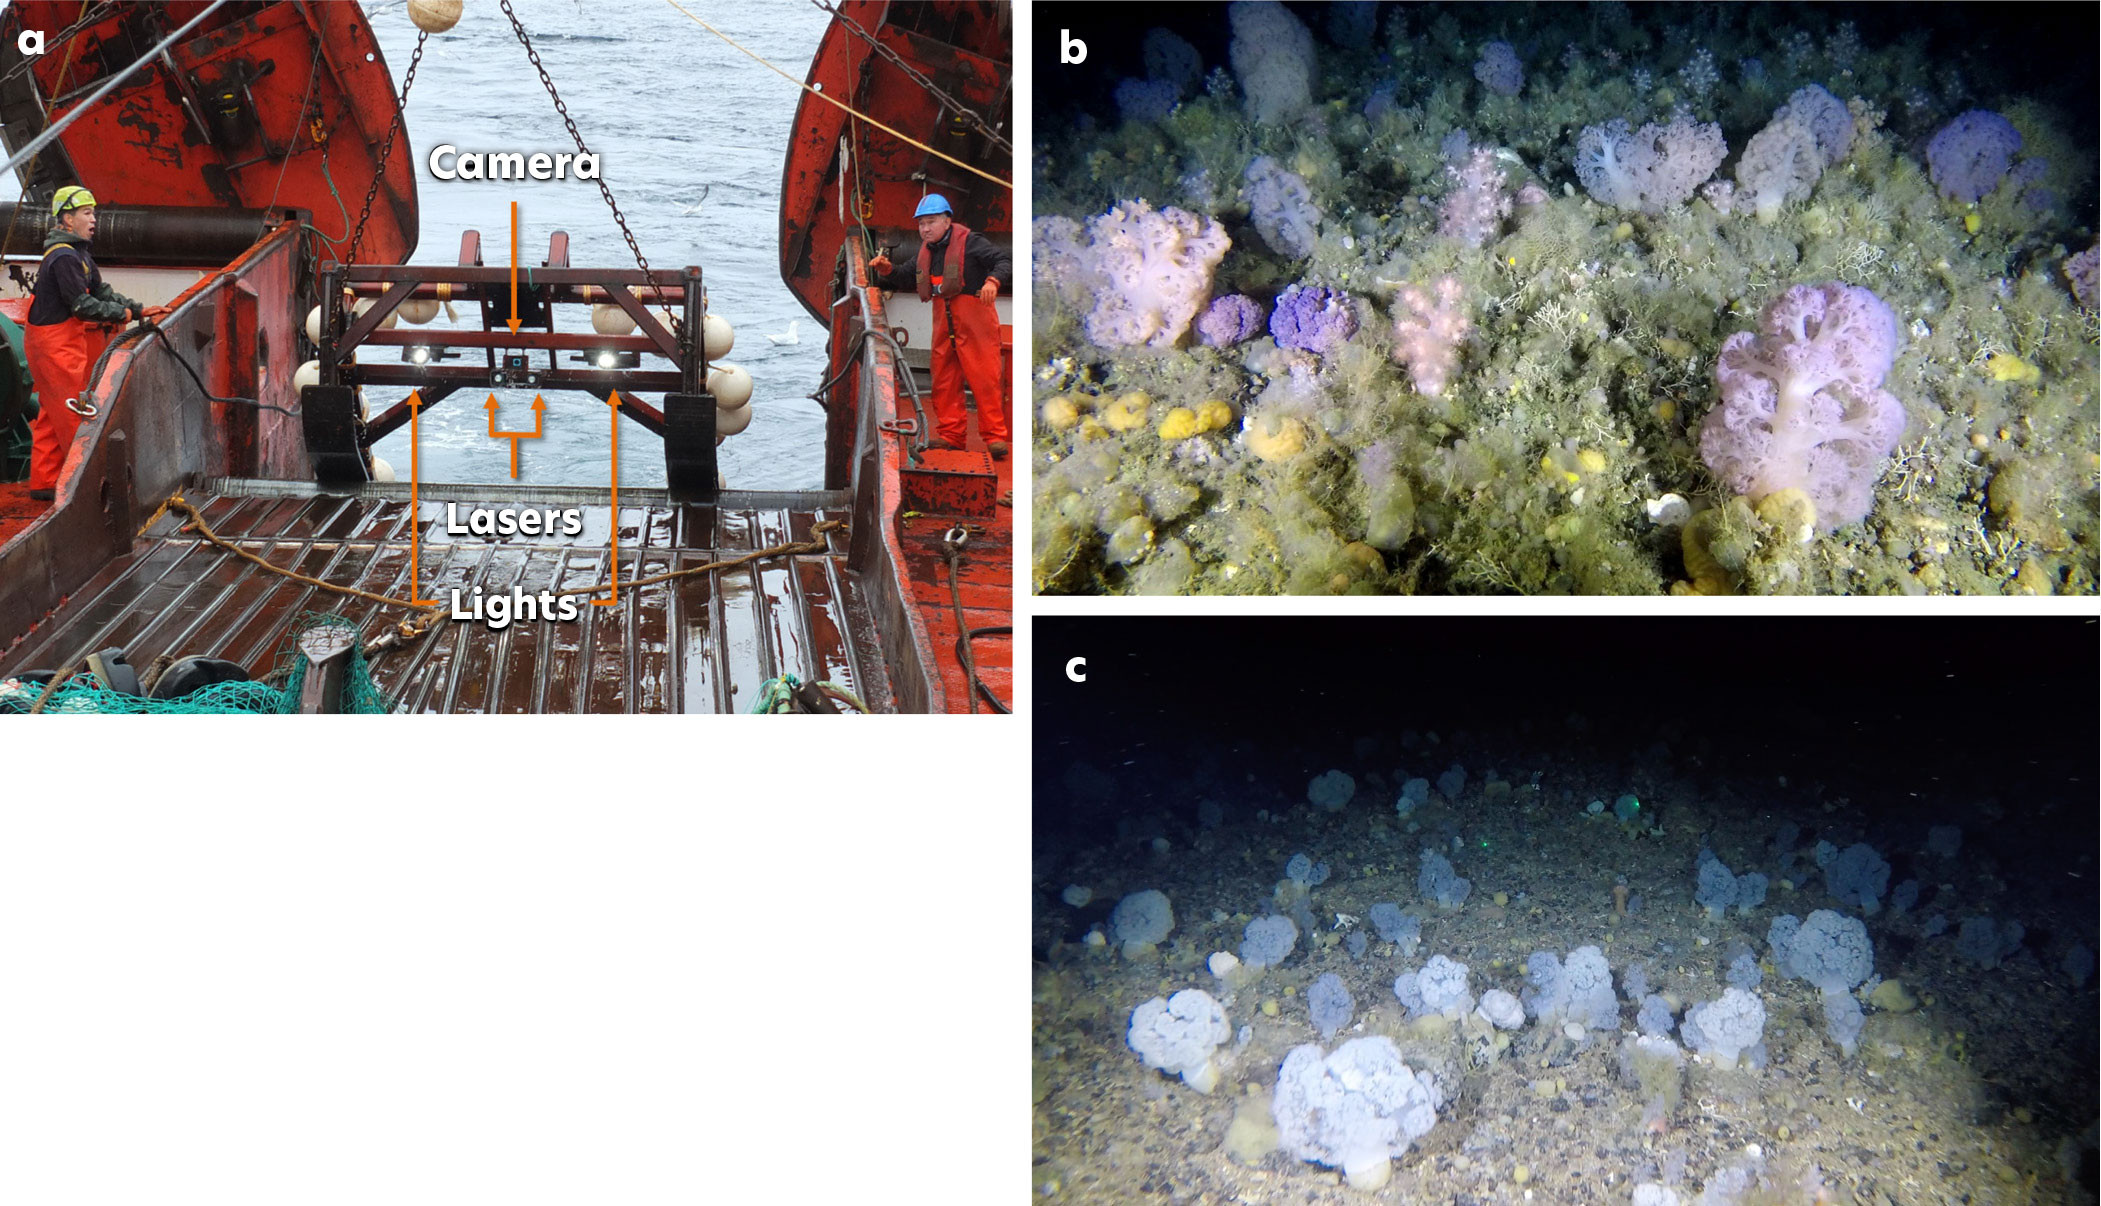
A practical, relatively low cost and effective way to monitor the seafloor is with a simple towed camera system that can be deployed from most vessels with an A-frame and that is not dependent on a dynamic positioning system or fiber-optic capabilities. Greenland’s towed camera system consists of an oblique angled centrally mounted video camera, lights, scaling lasers, and an echo sounder unit on a steel frame (Figure 1). It has been successfully deployed since 2017.
|
|
Two Group-Binc Nautilux 1,750 m LED light sources are positioned either side of the camera and angled slightly inward. Two Z-Bolt lasers (515 nm wavelength) in custom-made housings provide scale (20 cm). Position and orientation of the sled is monitored in real time using a Marport Trawl Eye Explorer. Video is collected using a GoPro5 action camera in a Group-Binc housing. The camera is positioned 0.55 m above the seabed. The camera angle is adjustable but typically set at 28.8˚ down from horizontal. The camera is set to record at 2,704 × 1,520 pixel resolution using the “medium” field of view (FOV) setting.
The sled is lowered to the seabed on a winch cable whose length is approximately 1.2–1.5 times the seabed depth. Tow speed is 0.8–1.0 knots. Typical transect time is 15–30 minutes, which covers ~500–1,000 m, creating a swept area of ~0.75–1.5 km2. Battery life, reduced by Arctic temperatures, is the main limitation on deployment time. Sled deployment requires a relatively flat seabed, but the sled is robust enough to manage areas with small boulders and gentle slopes.
These sled attributes result in an average observed seafloor area of approximately 8.23 m2 and a horizontal midline span of 1.49 m (based on the camera height and angle above). Image area calculations can be performed using the “TowedCameraTools development version” R package (Yesson, 2023).
The initial setup cost of this system ranges between EUR 15,000 and EUR 20,000, with a yearly maintenance fee of approximately EUR 500. Its advantages are that it does not require trained personnel for deployment or repairs, that it exhibits few technical malfunctions and is not prone to getting stuck or lost on the seabed, and that its significant depth range is 50 m to 1,600 m.
So far, still images and videos have been analyzed in the BIIGLE (Bio-Image Indexing and Graphical Labelling Environment) video and still image annotation platform to identify, describe, and map benthic habitats, as well as quantify and measure the heights of epibenthic megafauna. Yet, this is a costly and time-consuming process.
AI for Cost-Effective Analysis of Deep-Sea Imagery
The need for practical, low-cost “cheap and deep” technology extends beyond data collection to include a cost-effective method of analyzing benthic imagery/footage. Fortunately, developments in computer vision and AI have made this possible. Deep learning-based models using either vision transformers or convolutional neural networks can be trained using consumer grade hardware to offer performance that can match or indeed beat (by certain criteria) a human annotator. Critically, they can do this at speeds far exceeding those of human annotators, allowing for the efficient analysis of spatially extensive survey data.
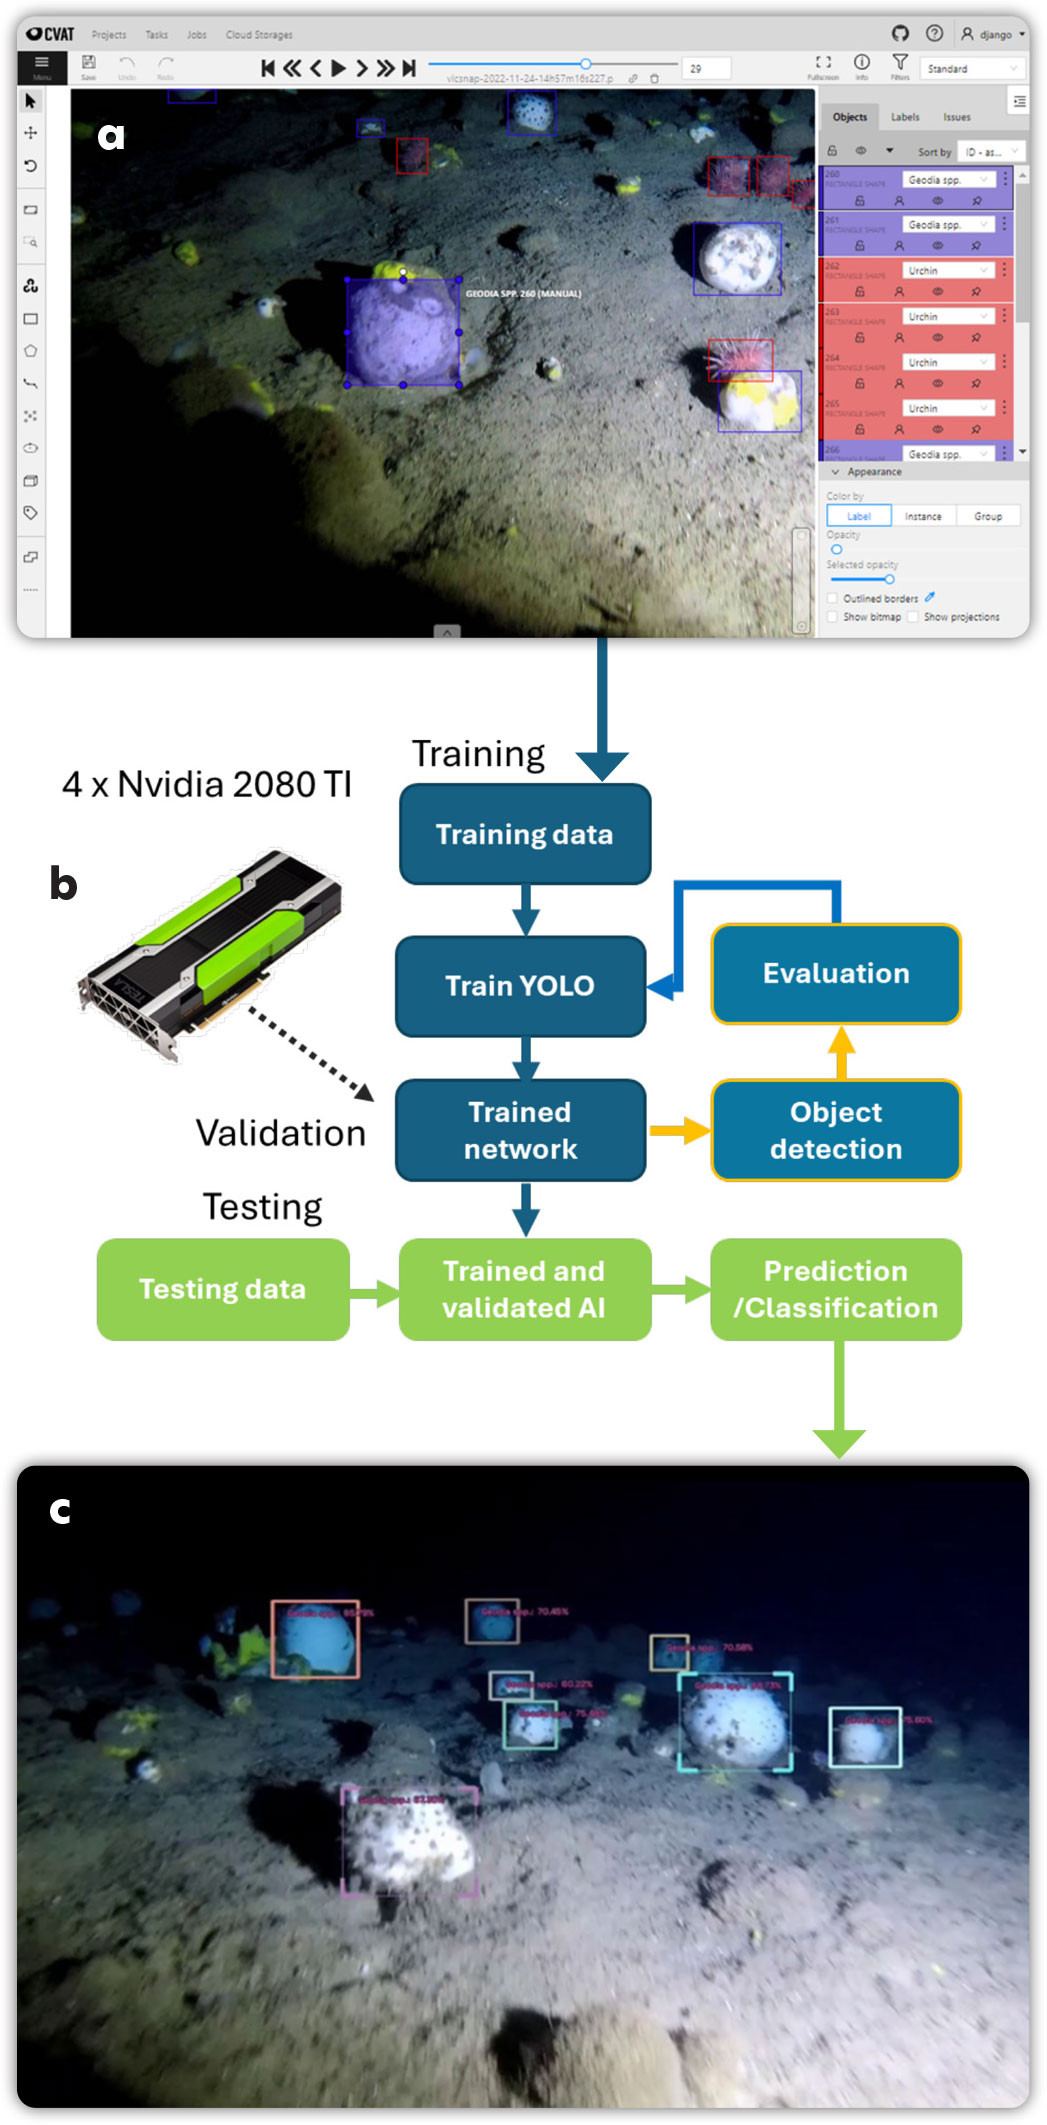
The success of computer vision models depends on effective training, and the model’s ability to differentiate between similar taxa largely hinges on the human annotator’s accuracy in providing the training data. Automated species IDs and occurrence information hinge on accurate taxonomic reference systems and generally work best on data that are similar to training imagery. For example, by determining benthic assemblages—such as dense aggregations of cauliflower corals (Nephtheidae) and sponges (Geodia spp.)—AI workflows can estimate habitat-specific carbon storage potential (Figures 1 and 2), although subtle morphological differences often impede reliable species-level identification from images. Consequently, the key to successful AI recognition lies in building taxonomically robust and well-annotated training sets that accurately represent the survey data in terms of image quality, benthic composition, and habitat type, and ensuring researcher-led validation remains integral to refining automated classification tools.
Figure 2 shows a complete workflow for automatic identification from footage of a Greenlandic Geodia spp. sponge bed. The dataset consisted of only 46 images, but the network was able to produce tolerable levels of precision/recall after 10 minutes of training. The metrics available to researchers for extracting from this analysis depend upon both the computer vision method and the given research question. A common metric for extracting from object detection is density, but this requires image scaling to allow for identification counts per unit area. We have developed two approaches to this: automatic detection of paired laser spots so that each image can be automatically scaled or the combination of positional information with object tracking, allowing for counts per unit area. The combination of computer vision and image scaling also allows for size measurements of a given taxa, either approximate measurements in the case of object detection, or highly accurate measurements when using semantic or panoptic segmentation methods. These can be combined with three-dimensional workflows to produce accurate estimates of epibenthic biomass (Marlow et al., 2024) or potentially even carbon content.
|
|
Future AI-Informed Blue Carbon Research
The combination of benthic footage from Greenland’s towed camera system and the AI workflow for automated taxon identification is an ideal use case for future blue carbon assessments. With suitable training sets, the technology would enable fast and economical analyses of large quantities of benthic survey footage at ecologically relevant spatial scales. For example, the role of benthic invertebrates and macroalgae in blue carbon assessments has been controversial, partially due to uncertainties about the fate of carbon on the seafloor and a lack of systematic assessment. AI could help clarify this issue by linking in situ observations from videos with carbon content data from key seafloor taxa, such as sponge, coral, and seaweed specimens recorded in benthic images and collected during benthic monitoring surveys. Three collaborative projects undertaken by the coauthors represent practical applications: (1) BlueCea, tracing the fate of macroalgae with a focus on blue carbon processes in sub-Arctic North Atlantic fjord ecosystems, (2) POMP, Polar Ocean Mitigation Potential, and (3) SES, Seabed Ecosystem Survey. These projects aim to apply this novel AI approach to almost 10 years of imagery data across Greenland to better understand the blue carbon storage potential of Greenland’s shelf system. The combination of tools that were developed to simplify, standardize, and accelerate monitoring and identification of vulnerable marine ecosystems, habitats, and taxa is expected to contribute significantly to cutting-edge research. This work may also be relevant in other remote locations worldwide that rely on low budget solutions.
Acknowledgments
We thank the staff and crew of R/V Tarajoq for their invaluable support. This work has been funded by Granskingarráðið for the BlueCea project (grant number 8014), the Government of Greenland’s partnership agreement with the European Commission under the so-called Green Growth Programme, the Aage V. Jensen Charity Foundation, the EU Horizon POMP Project (grant agreement 101136875), and the NERC UK-Greenland Bursary, and through Research England support for ZSL research staff. Image and video data from the GINR benthic monitoring program contributes to the BlueCea, POMP, and SES projects.


