Full Text
Introduction
The Atlantic Meridional Overturning Circulation (AMOC) redistributes heat, salt, oxygen, carbon, and nutrients in the Atlantic Ocean, providing warmth and moisture to the climate of northern Europe (Rhines and Häkkinen, 2003), displacing the Intertropical Convergence Zone northward of the equator (Ben-Yami et al., 2024), sequestering anthropogenic carbon in the deep ocean (Brown et al., 2021), and seeding the subpolar North Atlantic with sufficient nutrients to support the annual spring phytoplankton bloom (Williams et al., 2026). While models and proxies of the AMOC have been instrumental in understanding its past and future variability, large inter-model differences necessitate direct observations to provide a baseline from which to compare the models, as well as an unambiguous time series of recent AMOC variability. However, measuring a system as large and complex as the AMOC presents many challenges: spanning thousands of kilometers horizontally and covering full ocean depths, the AMOC is composed of currents that vary on daily to millennial time scales. Recirculating flows that can be an order of magnitude stronger than the AMOC itself further complicate observations.
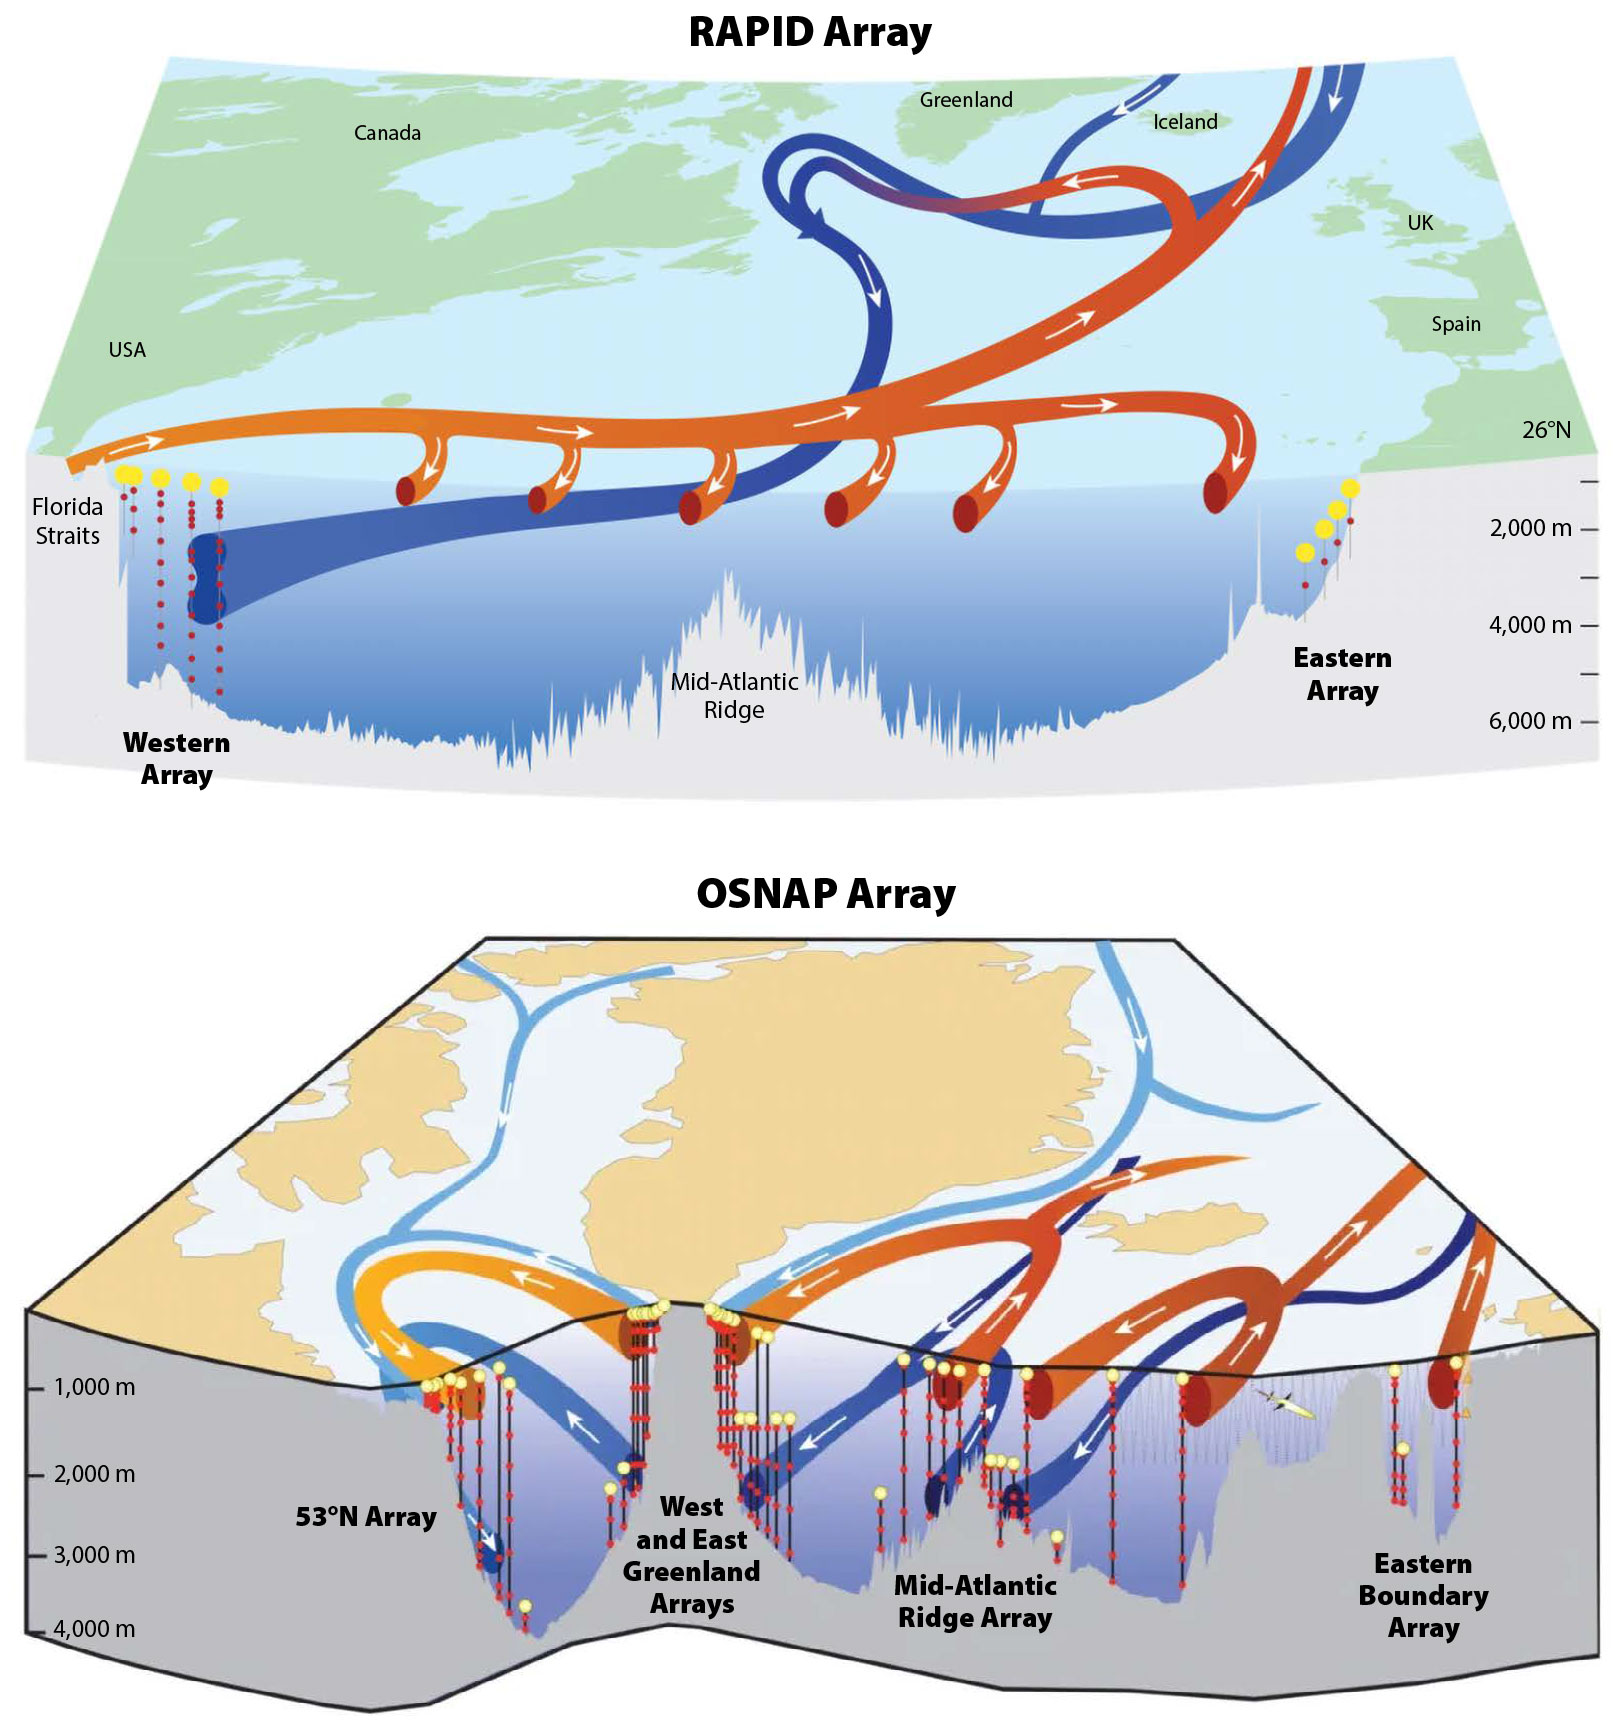
International efforts to measure the basin-wide AMOC began in 2004 with deployment of the Rapid Climate Change–Meridional Overturning Circulation and Heatflux Array (RAPID–MOCHA) across the subtropical North Atlantic at 26.5°N. Ten years later, the Overturning in the Subpolar North Atlantic Program (OSNAP) array was deployed in 2014 across the subpolar North Atlantic from eastern Canada to southern Greenland (OSNAP West) and from southern Greenland to Scotland (OSNAP East). Both RAPID and OSNAP rely on a set of instrumented, subsurface moorings to estimate the MOC, meridional heat transport (MHT), and meridional freshwater transport (MFT; Figure 1). The projects vary in many other regards such as where ocean velocities are measured directly versus where indirect approaches are used, how the data are calibrated, and how references for calculations are chosen. The differences arise in part due to the distinct regions that the arrays measure: RAPID measures the AMOC in the strongly stratified subtropical basin where the ocean is relatively deep (~6,000 m deep), the isopycnals are relatively flat in the zonal direction, the western boundary current is largely confined to the Florida Straits, and the spatial scales are relatively large due to its lower latitude. In contrast, OSNAP measures the AMOC in the subpolar North Atlantic where three distinct basins (Labrador, Irminger, and Iceland) exhibit active deep convection and strongly inclined isopycnals, multiple strong boundary currents, and domination of a more barotropic flow with smaller spatial scales. Thus, these two regions require different measurement approaches. While homogenizing the approaches between the arrays is neither feasible nor desirable, the two projects face similar research questions and logistical hurdles, and streamlining their approaches where possible will facilitate wider use and broader understanding of their uncertainties.
|
|
In July 2025, we organized a hybrid workshop based in Woods Hole, Massachusetts, that brought together 45 oceanographers and marine technicians involved in the RAPID and OSNAP arrays. Though previous meetings had focused on the scientific findings of these arrays, this workshop was the first to focus on their operational logistics and data handling. Specifically, the workshop sought to: (1) facilitate discussion and knowledge sharing between the RAPID and OSNAP groups, (2) improve awareness within the RAPID/OSNAP community of alternative observational technologies and techniques, and (3) move toward common measurement techniques where possible. To accomplish these goals, the workshop was divided into three topics: (1) data acquisition, which included array design and instrument calibrations; (2) data processing and delivery, which included data gridding, streamfunction calculations, uncertainty estimates, and data dissemination; and (3) alternative observing technologies such as Science Monitoring and Reliable Telecommunications (SMART) cables, ocean reanalyses, bottom pressure recorders, and telemetry, as well as consideration of practices in other disciplines that use AMOC mooring infrastructure, notably biogeochemistry. Here, we summarize the outcomes of this workshop.
Data Acquisition
RAPID and OSNAP both rely on a set of moorings spanning the North Atlantic basin to calculate the MOC, MHT, and MFT. Current meters attached to the moorings directly measure velocities in the major boundary currents, and moored conductivity-temperature-depth (CTD) instruments measure hydrographic properties. The moored CTDs are also used to infer the geostrophic interior flow between mooring arrays. At RAPID, the western boundary portion of the RAPID array combines pressure sensors, underwater telephone cable voltages, satellite altimetry, and shipboard hydrographic data to continuously estimate Florida Current transport (Volkov et al., 2024). At both arrays, Ekman transports are estimated using reanalysis wind stress products. These transport estimates are combined with a volume conservation constraint specific to each array to derive an AMOC streamfunction. These configurations have been tested in Observing System Simulation Experiments (OSSEs) to ensure the arrays capture the majority of MOC, MHT, and MFT mean and variability (Hirschi et al., 2003; Baehr et al., 2004; Roberts et al., 2013; Stepanov et al., 2016; Li et al., 2017; Danabasoglu et al., 2021).
Gaps in Measurements
Due to practical and funding limitations, the arrays miss aspects of the circulation. Known missing components include the flow over the shallow shelf regions at the OSNAP array, local recirculations offshore of the boundary currents such as in the Labrador, Irminger, and Sargasso Seas, the upper water column above the shallowest instruments (surface to ~100 m), the basin-interior abyssal layers below 2,000 m (i.e., the regions without mooring and Argo coverage), and mooring bottom triangles along sloping topography. Sampling errors can also arise from the inability of the mooring array to resolve the scales of flow in the presence of small-scale features such as eddies.
The impacts of these gaps on AMOC metrics are still not fully understood, largely due to the lack of direct observations. Because upper water column stratification and velocity shear can significantly influence MHT and MFT, incorporating mooring data along the Canadian shelf, glider data on the shelf off Scotland, and upper ocean property data at both arrays was discussed. Efforts to close some of these gaps are already underway, with results forthcoming, while others are still being developed. Alternative approaches to constraining the flow along these shelves include coastal altimetry products, ships of opportunity, drifter data, and novel mooring technology that adaptively samples the upper water column under ice. The new mooring technology, currently being developed, could also help constrain the dynamic height variability above the topmost instruments. At RAPID, deeper bottom depths yield larger missing deep measurements below core Argo profiles (Biló et al., 2024). The combination of Deep Argo (Zilberman et al., 2025) and hydrographic data from the Global Ocean Ship-based Hydrographic Investigations Program (GO-SHIP; Sloyan et al., 2019) could constrain the majority of the variability in these layers as long as they are sustained regularly (Petit et al., 2025).
Near-Real-Time Data
Another limitation of the arrays is their lack of near-real-time data that, if available, could improve operational forecasting systems, aid fisheries management and maritime domain awareness, and enhance outreach and engagement efforts. Currently, the AMOC time series are updated biannually, a frequency that is set by the cruise schedule to recover and redeploy the moorings. Adding more continuous data streams from telemetry via data pods or SMART cables in a targeted manner could add value to the AMOC products and make the data more useful to a wider community. It was noted that this would likely increase costs, and a cost-benefit analysis through a user survey would be useful.
Calibration of Moored CTDs
A crucial step for calculating the AMOC streamfunction is the calibration of moored instrumentation. To demonstrate the level of accuracy required, McCarthy et al. (2015) found that a 0.003 salinity bias on one side of the RAPID array relative to the other can impact the accuracy of the total MOC by over 4%. Though multiple, shorter geostrophic sections at OSNAP reduce the risk of this amount of error across the entire array, the MFT at OSNAP is particularly impacted by the calibration of moored CTDs. Thus, care must be taken when calibrating the moored CTDs, especially at the endpoint dynamic height moorings.
There was consensus at the workshop that developing a “best practices” document that describes a clear methodology for calibrating moored CTDs would be useful. While the steps may not be the same at each array, discussion about the list of priorities and choices made is important. The RAPID community has developed a consistent methodology to calibrate its moored CTDs that works well for its cruise schedule and funding structure. Notably, RAPID uses the same make and model of moored CTDs on each endpoint dynamic height mooring, as well as a single processing group and standard methodology for calibrating instruments. This methodology can be an example for OSNAP in development of a similar routine, though the number of moorings at OSNAP necessitates more cruises, institutions, and personnel. Such a best practices guide would have to be dynamic and adaptable to continuous review to incorporate changes to the arrays, emerging technologies, and research findings. Similarly, sharing best practices and computer code for processing, calibration, and interpolation was identified as a way to eliminate redundant efforts between groups. To facilitate these best practice documents, a coordinated effort to collect and organize operating protocol documents is required. An iterative process involving community feedback could follow such an effort, providing recommendations for diverse workflows and optimization of practices. Results from similar efforts of the International Association for the Physical Sciences of the Oceans (IAPSO) and the World Ocean Circulation Experiment/GO-SHIP program can provide a starting point for this effort.
Data Processing and Delivery
Following data acquisition, a typical data processing workflow for estimating an AMOC streamfunction includes the gridding of measured quantities in space, and the choice of a reference velocity for the geostrophic flow.
Gridding the Data
The gridding procedure aims to combine moored measurements with Argo profiles, satellite data, and other ancillary datasets into a two-dimensional zonal and vertical section across the ocean at each time step. Though the depth-coordinate streamfunction at RAPID does not require gridding across the array, mapping the isopycnal structure across the array is necessary to calculate the density-coordinate streamfunction at RAPID (Smeed et al., 2026). Gridding was identified as a potentially significant source of uncertainty in the OSNAP and RAPID products, with specific issues raised for each array. For example, how the dynamic height profiles from the topmost instruments are extrapolated to the surface can affect the AMOC seasonal cycle at RAPID by over 5% due to strong seasonality in upper ocean stratification in the subtropical ocean (Frajka-Williams et al., 2023). Similarly, at OSNAP, the isopycnal of maximum overturning can be above the topmost instruments in the western Labrador Sea, meaning that vertical linear interpolation to the surface could lead to misattribution of waters to the upper or lower limb of the overturning. Similarly, gridding in the bottom triangles on the sloping boundaries, the coastal regions, and the deep ocean requires special attention.
At a minimum, the uncertainty associated with gridding choices requires quantification at both arrays, for example, by performing sensitivity tests to different gridding schemes (Sinha et al., 2018). For RAPID, this structural bias has been quantified with past arrangements of the moorings, but this has yet to be updated following the removal of Mid-Atlantic Ridge moorings in 2020. A recurring suggestion at the workshop was to leverage auxiliary measurements, in particular high-resolution shipboard-CTD and velocity sections, in order to quantify the level of uncertainty associated with gridding.
Reference Velocity
Calculating the geostrophic interior transport between dynamic height moorings requires selecting a reference velocity. In theory, satellite altimetry should be able to provide a time-varying reference velocity (Stammer and Wunsch, 1994), but the practical application remains challenging (e.g., Sanchez-Franks et al., 2021). At RAPID, the interior geostrophic transport is initially referenced to a deep level of no motion, while at OSNAP a time-mean, satellite-derived surface geostrophic velocity is used. In confined regions where deep velocities are measured, OSNAP uses current meters rather than altimetry to reference its geostrophic flow.
It is widely acknowledged that the reference velocities in and of themselves are insufficient to capture the time-varying, turbulent ocean. Thus, at both arrays, the need for a reference velocity is functionally combined with the need for a net volume transport constraint. However, it is important to note that the reference velocity and compensation velocities are added for two distinct reasons. The reference velocity represents a known phenomenon that is not directly measured by the arrays (i.e., the barotropic flow between endpoint dynamic height moorings). The compensation velocity represents an error term from a combination of unmeasured flows, the geostrophic assumption, and gridding errors, while also allowing a known volume transport to pass through the array.
Workshop participants discussed that the reference velocity itself should vary temporally, and that these data could come from altimetry, Argo drift data, NASA’s Gravity Recovery and Climate Experiment (GRACE), or a combination of these products. Testing the sensitivity of the MOC, MHT, and MFT to these choices should be a high priority, as the AMOC at both arrays is sensitive to this choice. Similarly, it would be beneficial to know why using the current altimetry products as a time-varying reference leads to issues with the derived AMOC, as new technology like the Surface Water Ocean Topography (SWOT) satellite may improve the accuracy of the reference velocity.
Similarly, revisiting how the compensation velocity is applied and specifically whether a hypsometric distribution (i.e., constant at every location across the section) is dynamically justified was discussed. An OSSE with different choices of reference velocity would help determine the systematic error associated with the reference velocity. Finally, participants noted that new technologies such as pairs of drift-free bottom pressure gauges or SMART cables may enable the assessment of different reference velocity choices.
Metrics of Overturning and Their Uncertainty
The majority of users rely on the MOC, MHT, and MFT, and this need is currently being met by both arrays. The choice of coordinate system (depth or density, and which density to use) as well as temporal resolution was discussed. The RAPID streamfunction has recently been published in sigma-theta and sigma-2 space (Smeed et al., 2026), which aligns more closely with OSNAP’s output. Workshop participants discussed that assessing the sensitivity of the streamfunctions to the choice of density (e.g., sigma-2 and neutral density) would be worthwhile due to nonlinearities in the equation of state. The temporal resolution of the products was also considered, and RAPID may also produce a time series at monthly resolution that aligns with OSNAP’s output.
There was also a discussion about who the end users are, and what their needs are beyond the integrated measures discussed above. A user survey conducted by RAPID in 2023 identified various groups: physical oceanographers, climate scientists, biogeochemists, students from elementary to undergraduate levels, and the military. Each of these groups has different requirements and data needs, including different required levels of uncertainty. Outputs that workshop participants believe would be useful to these users include the strength of maximum overturning, depth/isopycnal of maximal overturning, full streamfunction in depth and density coordinates, MHT, MFT, and zonal-vertical sections of velocity and property (temperature, salinity, density) fields.
Importantly, these products each require uncertainty estimates, along with metadata containing information about how these estimates are derived. There are many sources of uncertainty in the various data products described above. They include systematic structural errors due to the design of the array, gridding, and choices of reference velocities and net volume transport constraints, as well as statistical random errors due to instrumental uncertainty. In general, RAPID has reported structural uncertainty (e.g., Johns et al., 2011; McCarthy et al., 2015; Sinha et al., 2018), while OSNAP has reported statistical uncertainty based on Monte Carlo simulations (Lozier et al., 2019; Li et al., 2021; Fu et al., 2025). While both sources contribute to the total uncertainty, they are not directly comparable. OSSEs are an effective way to describe structural uncertainty, and both arrays could benefit from OSSEs conducted with updated high resolution, state-of-the-art models, especially ones that can better simulate overflows. To this end, efforts to compare the OSNAP data to a range of models are underway (Danabasoglu et al., 2025), and similar past efforts at the RAPID array yielded important insights (Danabasoglu et al., 2021). In general, reporting the two sources of uncertainty separately as well as combining them into a total uncertainty would be beneficial.
Data Delivery
There was broad consensus at the workshop that in addition to the core data produced by the arrays, it would be useful to publish accompanying material, including open-source code used to create the output and clear documentation of the steps taken to progress from the raw data to the published product. Ideally, enough raw data and code would be published so that groups can recreate the steps to calculate the AMOC and associated data. Employing consistent version control as is done at RAPID will also help with transparency. In general, maintaining clear records of adjustments, while also standardizing vocabularies, formats, metadata, and naming conventions will make the data more accessible.
The discussion also focused on how to deliver the data to the public more quickly. It was noted that the largest time lag from acquisition to delivery occurs while the data are logged and then stored on the moored instrumentation, and telemetry would greatly accelerate the data delivery, albeit with an additional expense. The discussion then focused on how to speed up the data processing, and a sticking point was insufficient funding for technicians to process and post the data, as well as be trained on the processing prior to data acquisition. A point person or data manager to oversee the data processing from multiple groups could streamline the processing by standardizing the data cruise reports and metadata to common formats. This effort would likely facilitate the data being used more widely and efficiently.
Which data could be released more quickly to the public was also discussed. It was agreed that non-calibrated data are not of use to the general public, and the calibrations are the most time-consuming component of the processing. Thus, delivering calibrated data (e.g., instrument data) could not be done significantly sooner than the large-scale metrics.
Finally, publishing the code to estimate the AMOC and the other relevant fields requires significant work. RAPID is in the process of doing this. OSNAP currently publishes its code alongside its data, but it is difficult to execute without specific guidance. Both arrays are striving to achieve the FAIR (findable, accessible, interoperable, and reusable) code protocol, with version control to document how the code has evolved.
Outcomes, Recommendations, and Next Steps
While the ground-breaking science produced from the RAPID and OSNAP arrays (e.g., Johns et al., 2023; Lozier, 2023) has led to many joint meetings over the past decade, the programs had not yet convened to discuss the logistical challenges of measuring the AMOC. This workshop filled this gap by bringing together the two groups to discuss the strategies each has developed over the past decades. In this vein, the goals of the workshop were accomplished: (1) there was discussion and knowledge sharing between the RAPID and OSNAP groups, (2) the community became more aware of alternative observational technologies and techniques, and (3) discussions were initiated to move toward common techniques where possible.
Major Outcomes
- A consensus on the need to fill observing gaps and for widely applicable data processing protocols.
- A deeper understanding of how each array quantifies uncertainty.
- A realization that active collaboration between arrays will help maintain a more efficient, high-quality, and sustained AMOC observing system.
Recommendations
- Produce a streamlined and well-documented data processing system, including establishing a set of best practices documents on instrument calibration, gridding, and uncertainty quantification, among others. Toward this end, a new repository for accessing existing AMOC datasets is now available; however, further efforts are needed to better quantify sources of uncertainty and streamline data processing workflows across observing arrays.
- In parallel to the ongoing efforts to quantify sources of uncertainty in future data products, we recommend surveying end users to assess the desired level of AMOC uncertainty.
- Communicate more clearly about the level of uncertainty in observational AMOC products. While these products are critical benchmarks for climate models and paleo-interpretations, uncertainty must be taken into account as the observations are translated for stakeholders.
- Develop in-depth collaborations across the community managing various Atlantic mooring arrays to synthesize observations into a consistent understanding of Atlantic changes, such as was provided by the CLIVAR AMOC Task Team.
- Engage other AMOC observing stakeholders such as biogeochemists, satellite altimetry experts, operational oceanographers, climate scientists, fisheries managers, and weather forecasters to improve scientific outputs, while also diversifying the pool of end users, and making AMOC observing more resilient and sustainable into the future.
Acknowledgments
We are grateful to the Woods Hole Oceanographic Institution and members of the Physical Oceanography Department administrative staff for hosting the workshop. This workshop was supported by the US National Science Foundation (NSF) through award OCE-2526644 to Fiamma Straneo and Amy Bower. NPF was supported by NSF award OCE-2421096. ILB was supported by NSF awards OCE-2122579 and OCE- 2409764 as well as the James E. and Barbara V. Moltz Early Career Fellowship. YF was supported by NSF awards OCE-1948335 and OCE-2523656. TP and BIM were supported by Natural Environment Council awards NE/Y003551/1 (RAPID Evolution) and NE/Y005589/1 (AtlantiS). TCB was supported by NSF award OCE-1949198 as well as the University of Maine’s School of Marine Science and the Office of the Vice President for Research. SE was supported by NSF awards OCE-2148723 and OCE-2334091.293.