Background and Purpose
Although logistically difficult and expensive (Henson et al., 2024), oceanographic cruises still provide an essential means for collecting and analyzing biogeochemical data for research on and monitoring of marine ecosystems. However, marine environments are characterized by different spatial and temporal scales of variability, making it challenging, for example, to monitor phytoplankton biomass fluctuations and possible regime shifts in coastal and open ocean systems where factors such as climate variability, nutrient input, and human activities intersect (Winder and Cloern, 2010).
With the advent of satellite remote sensing, our capacity to monitor the ocean has been revolutionized (Dickey and Bidigare, 2005). Satellite measurements offer products at varied spatiotemporal resolutions, allowing weekly, daily, or hourly collection of ocean biogeochemical parameters in near-real time at spatial scales of meters to kilometers. Data include, for example, chlorophyll-a (CHL) and suspended particulate matter (SPM), proxies for phytoplankton biomass and suspended sediment, respectively. Satellite-based remote sensing of the marine environment has become immensely important in marine ecology and operational oceanography, serving, for example, as a critical tool for fisheries management (Falcini et al., 2020) and environmental monitoring (Blondeau-Patissier et al., 2014; Moretti et al., 2024), even in polar regions with some limitations (Gabarró et al., 2023).
Currently, large amounts of satellite data are continually collected, and products generated from them provide valuable information about the condition and characteristics of the ocean (i.e., the Copernicus Marine Environment Monitoring Service, CMEMS; https://marine.copernicus.eu/). Ocean data visualization has become essential for scientists, offering increasing availability of high-resolution spatiotemporal observations (Xie et al., 2019). Before the widespread use of interactive maps, cartographic animation of satellite data was proposed to summarize space-time changes in key environmental parameters (e.g., Harrower, 2002). In recent years, the availability of interactive map-based visualization tools that are capable of handling multivariate marine spatial data has become widespread and valuable for data exploration and interpretation. Geographic information system software such as ArcGIS and, more recently, ArcGIS Online have been widely used for these purposes (e.g., Niza et al., 2021). While powerful, this software comes with significant costs that hinder its accessibility. However, today’s free and open-source tools like QGIS allow the creation of interactive web maps from static GIS data layers using powerful libraries/plugins such as openlayers or leaflet. Notably, the latter is a popular open-source library for building web mapping applications as it offers a cost-effective alternative that is gaining acceptance because of its accessibility, flexibility, and compatibility with R and Python. Leaflet-based web maps provide user-friendly and accessible platforms for visualizing spatial data, simplifying analysis, and enhancing collaboration among scientific teams by providing a visual context that improves communication and leads to better-informed decisions.
Leaflet web maps’ user-friendliness and accessibility, as well as their ability to handle multiple layers and the facility they offer in creating and sharing maps easily with collaborators, make them practical for various purposes, including assembling sampling strategies for oceanographic surveys. This article describes the use of specific functions from the leaflet R package to create a web-based graphical user interface (GUI) for displaying high-resolution site-specific remote-sensing data interactively in order to optimize positioning of sampling stations. Specifically, our GUI was designed to support the Tara Europa expedition sampling strategy, whose primary goal is to establish baseline knowledge of marine plankton diversity, interactions, functions, and phenotypic complexity across various taxonomic and spatial scales (Sunagawa et al., 2020). Using leaflets in scheduled online meetings has facilitated collaboration regarding the choice and position of Tara Europa sampling stations.
Material/Code and Assembly: Overview of the Leaflet R Package and Main Functions
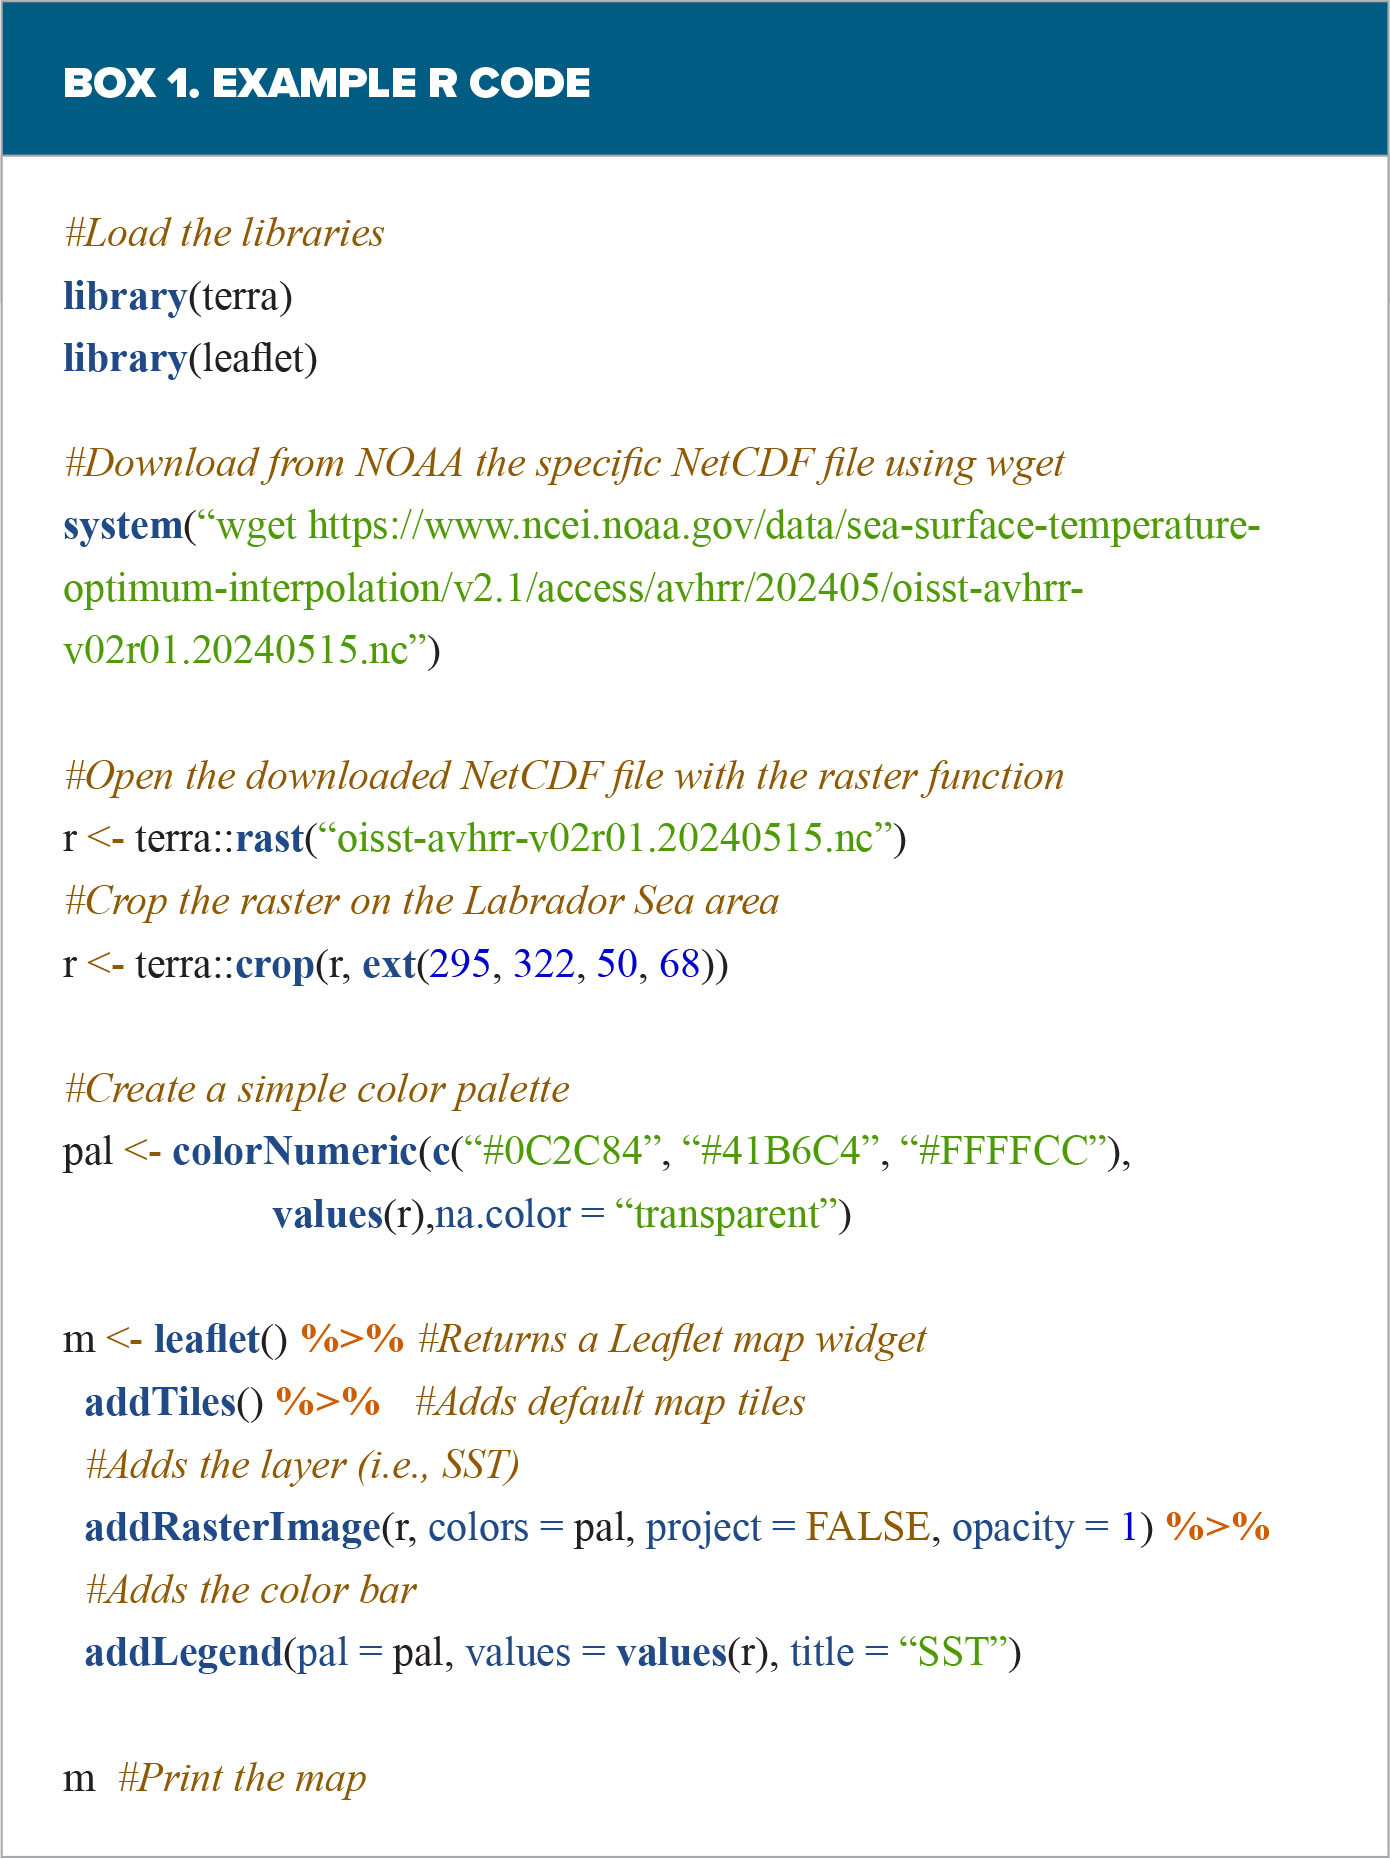
Leaflet is an open-source interactive mapping library that allows users to view spatial objects interactively on a web mapping base. While R includes numerous packages for geospatial analysis, not all are designed to quickly and conveniently create interactive visualizations of spatial data and integrate seamlessly with web mapping frameworks, such as, for example, mapview, mapedit, or leaflet. We utilized the leaflet R package (https://cran.r-project.org/web/packages/leaflet/) to embed and manipulate maps within the R environment, thereby enhancing the visualization and representation of oceanographic data. It is possible to create maps directly from the R console or RStudio (i.e., an integrated development environment, or IDE, designed for data scientists to develop, collaborate, and scale in R and Python) by efficiently rendering spatial objects or data frames with latitude and longitude columns and enhancing map features using specific plugins. The leaflet package allows users to start with a basic map widget and add plugins or extensions as needed to modify its GUI and improve functionalities (Figure 1). Once created, each leaflet is saved as an HTML file, making it easy to view on any device, including laptops and smartphones, allowing teams to collaborate in real time, regardless of location (online meetings). The R code in Box 1 shows an example of creating a sea surface temperature (SST) map for the Labrador Sea using a few basic steps.
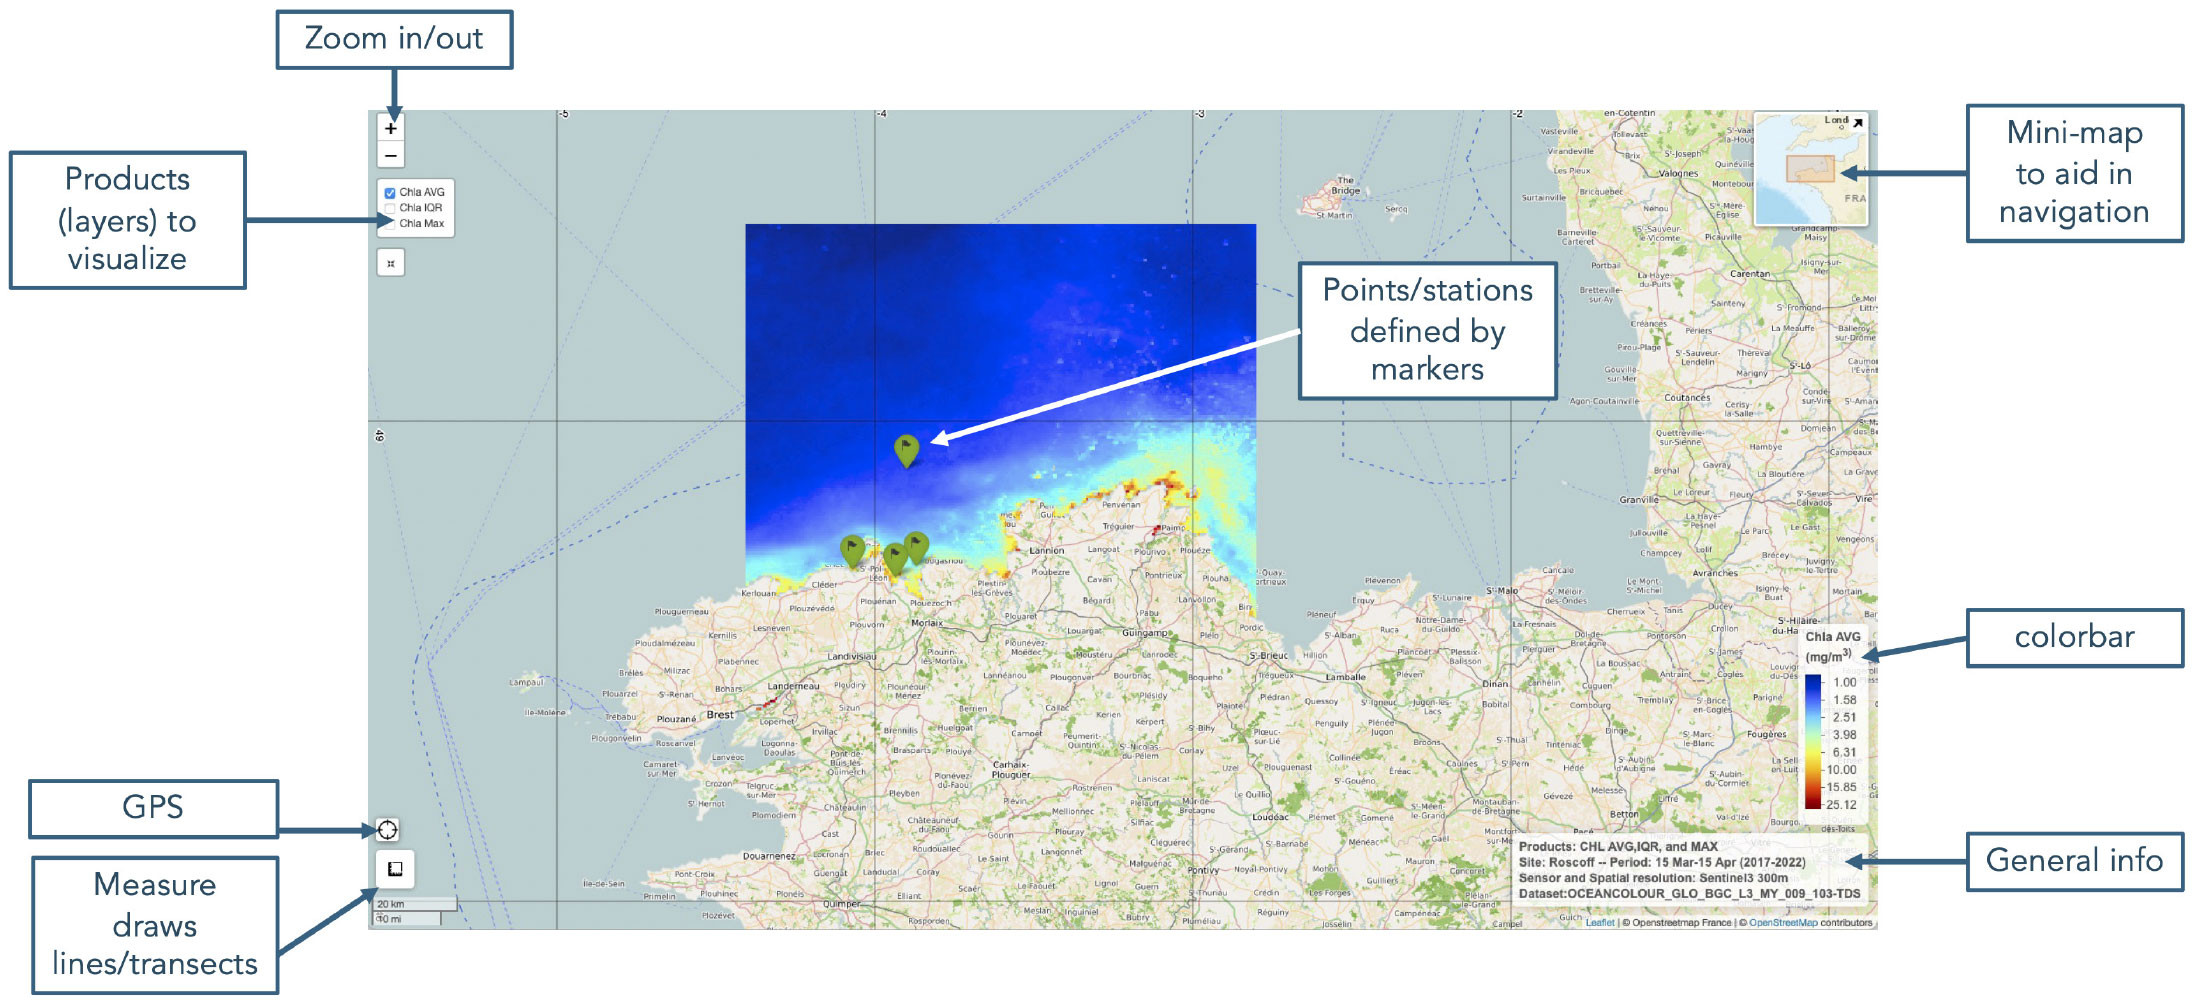
FIGURE 1. An example of a leaflet graphical user interface (GUI). The figure shows the mapping base (i.e., the geographical map), a layer’s control switch (top left), and the primary plugins (e.g., mini-map, GPS) used to customize the interface. On top of the base map, the climatological mean of chlorophyll-a is also displayed, with green markers indicating the sampling stations. > High res figure
|
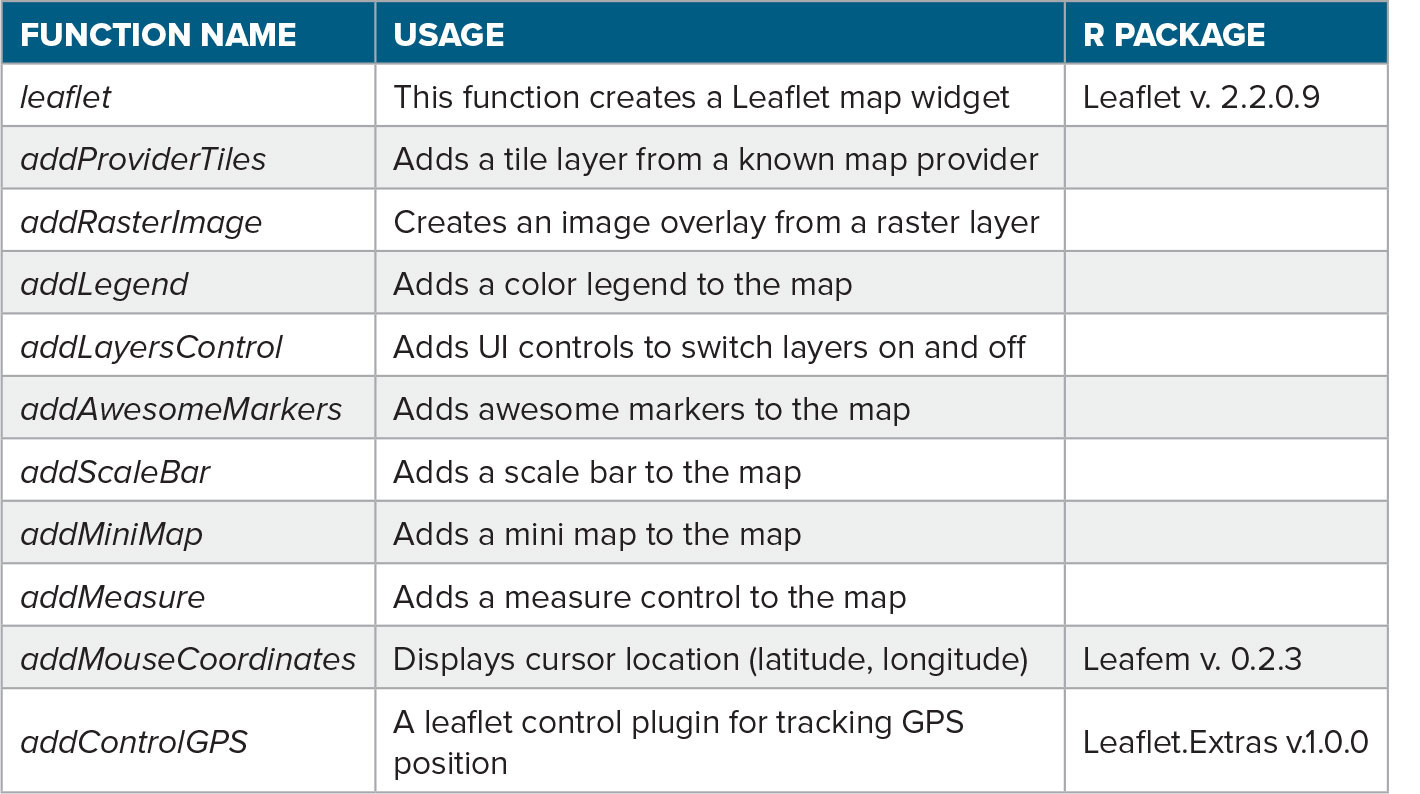
A single panel in our GUI can display a specific satellite product (e.g., SST). After being transformed into raster objects with assigned coordinate systems, data were visualized in the leaflet using the addRasterImage function. However, it’s important to note that leaflets have limitations when dealing with large raster sizes. This can impact the performance and rendering of the map’s high-resolution or extensive raster datasets. To improve the GUI, users can highlight specific points on the map using markers that can be styled as icons or circles. In our case, these were added through the addAwesomeMarkers function to indicate points of interest, such as sampled or proposed sampling stations; they can include pop-ups containing detailed information via the addPopups function. The addMeasure function allowed us to use the leaflet as a blackboard and interactively draw points, lines, and polygons on the map. Moreover, the coordinates of a point on the map could be identified because a box displaying the current cursor location (latitude, longitude) was present on the leaflet (top right corner) map thanks to the function addMouseCoordinates. More details on these functions (Table 1) and practical examples for incorporating various elements into a leaflet map are available in a dedicated tutorial (https://rstudio.github.io/leaflet/articles/leaflet.html) for the leaflet R package.
TABLE 1. List of the main functions used to create the Leaflet interface. > High res table
|
The source R code used to create our tailored leaflet GUI is commented on and accessible on GitHub (https://github.com/argonauta74/R_leaflet_TARA_Europe_maps). Overall, the code generates a leaflet map through the following steps: (1) initialize a map widget using the leaflet function, (2) enhance the map by adding panels/layers (i.e., data), (3) repeat step 2 as needed to include additional layers, (4) customize the map by adding map features, (5) display the map and save it as an HTML page. The input layers were NetCDF files containing the parameters to be uploaded and superimposed on the mapping base. Specifically, daily Sentinel-3 NetCDF files (e.g., CHL) were downloaded at a spatial resolution of 300 m from the CMEMS data store using the free Copernicus Marine Toolbox. These files were used to create climatology. When available, near-real-time images of CHL and SPM at a spatial resolution of 300 m were downloaded manually from the EUMETSAT data service (https://data.eumetsat.int/data/map/EO:EUM:DAT:0407). NetCDF files of bathymetric data at a spatial resolution of ~115 m were downloaded from the European Marine Observation and Data Network (EMODnet, https://emodnet.ec.europa.eu/en) using its Map Viewer tool. Finally, an Excel file containing information about sampling stations, including latitude, longitude, station number, station type, and date, was also used as input. Geographic coordinates from the Excel file display the sampling stations’ positions as markers on the map, while all the other information is shown inside a pop-up. The online supplementary material provides an example of an interactive leaflet map.
Field Application Example
A specific feature of the Traversing European Coastlines (TREC) program (https://www.embl.org/about/info/trec/) is the co-occurrence of land and marine sampling stations designed to look for land-ocean connectivity. As a result, the coastal segments where the schooner Tara can undertake marine sampling are constrained by the selection of optimal geographical locations for the land sampling sites.
In 2023, the schooner Tara sampled 99 stations across 15 European countries from the beginning of April to early November. The Tara Europa in situ sampling strategy aimed to complement the TREC land transects (i.e., soil, intertidal, shallow waters) by regularly choosing a marine station within the inner coastal biogeochemical pattern, close to the shore location sampled by the TREC team and typically situated about 1 km offshore at a depth of ~15 m. Extra stations were established in estuaries and similar environments to form inshore-offshore transects for sampling across biogeochemical gradients. The Tara Europa sampling strategy team used leaflet maps to improve data sharing and visualization, helping to select sampling stations within the different depths and biogeochemical patterns of CHL calculated from high-resolution climatological averages. Climatology shows the most likely CHL spatial patterns and the fine-scale variability along the coast at the target site.
In addition, the near-real-time CHL and SPM images were used (when possible, in cloud-free conditions) as “snapshots” to detect changes relative to the climatological distribution or to identify new relevant features (e.g., eddies, fronts, upwellings). In such cases, leaflets with near-real-time images and station positions were distributed to the Tara schooner’s scientific crew for adaptive sampling. Figure 2 presents an example of a leaflet map for the Blåvand site in southern Denmark. This site is part of the Wadden Sea, a shallow intertidal sea of sand and mudflats shielded by barrier islands that emerge at low tide (Van Beusekom et al., 2019). For this site, the first station to be sampled was chosen to represent the coastal biogeochemical conditions (Figure 2b,c) at about 15 m depth (Figure 2d) to ensure safe instrument deployment (e.g., CTD-rosette, nets). To span the local biogeochemical gradient, the other two stations were placed farther from the coast (>35 km), in less biomass-rich ocean waters at a depth of 25–40 m (Figure 2d), where concentrations of suspended particulate matter are significantly lower (Desmit et al., 2024).
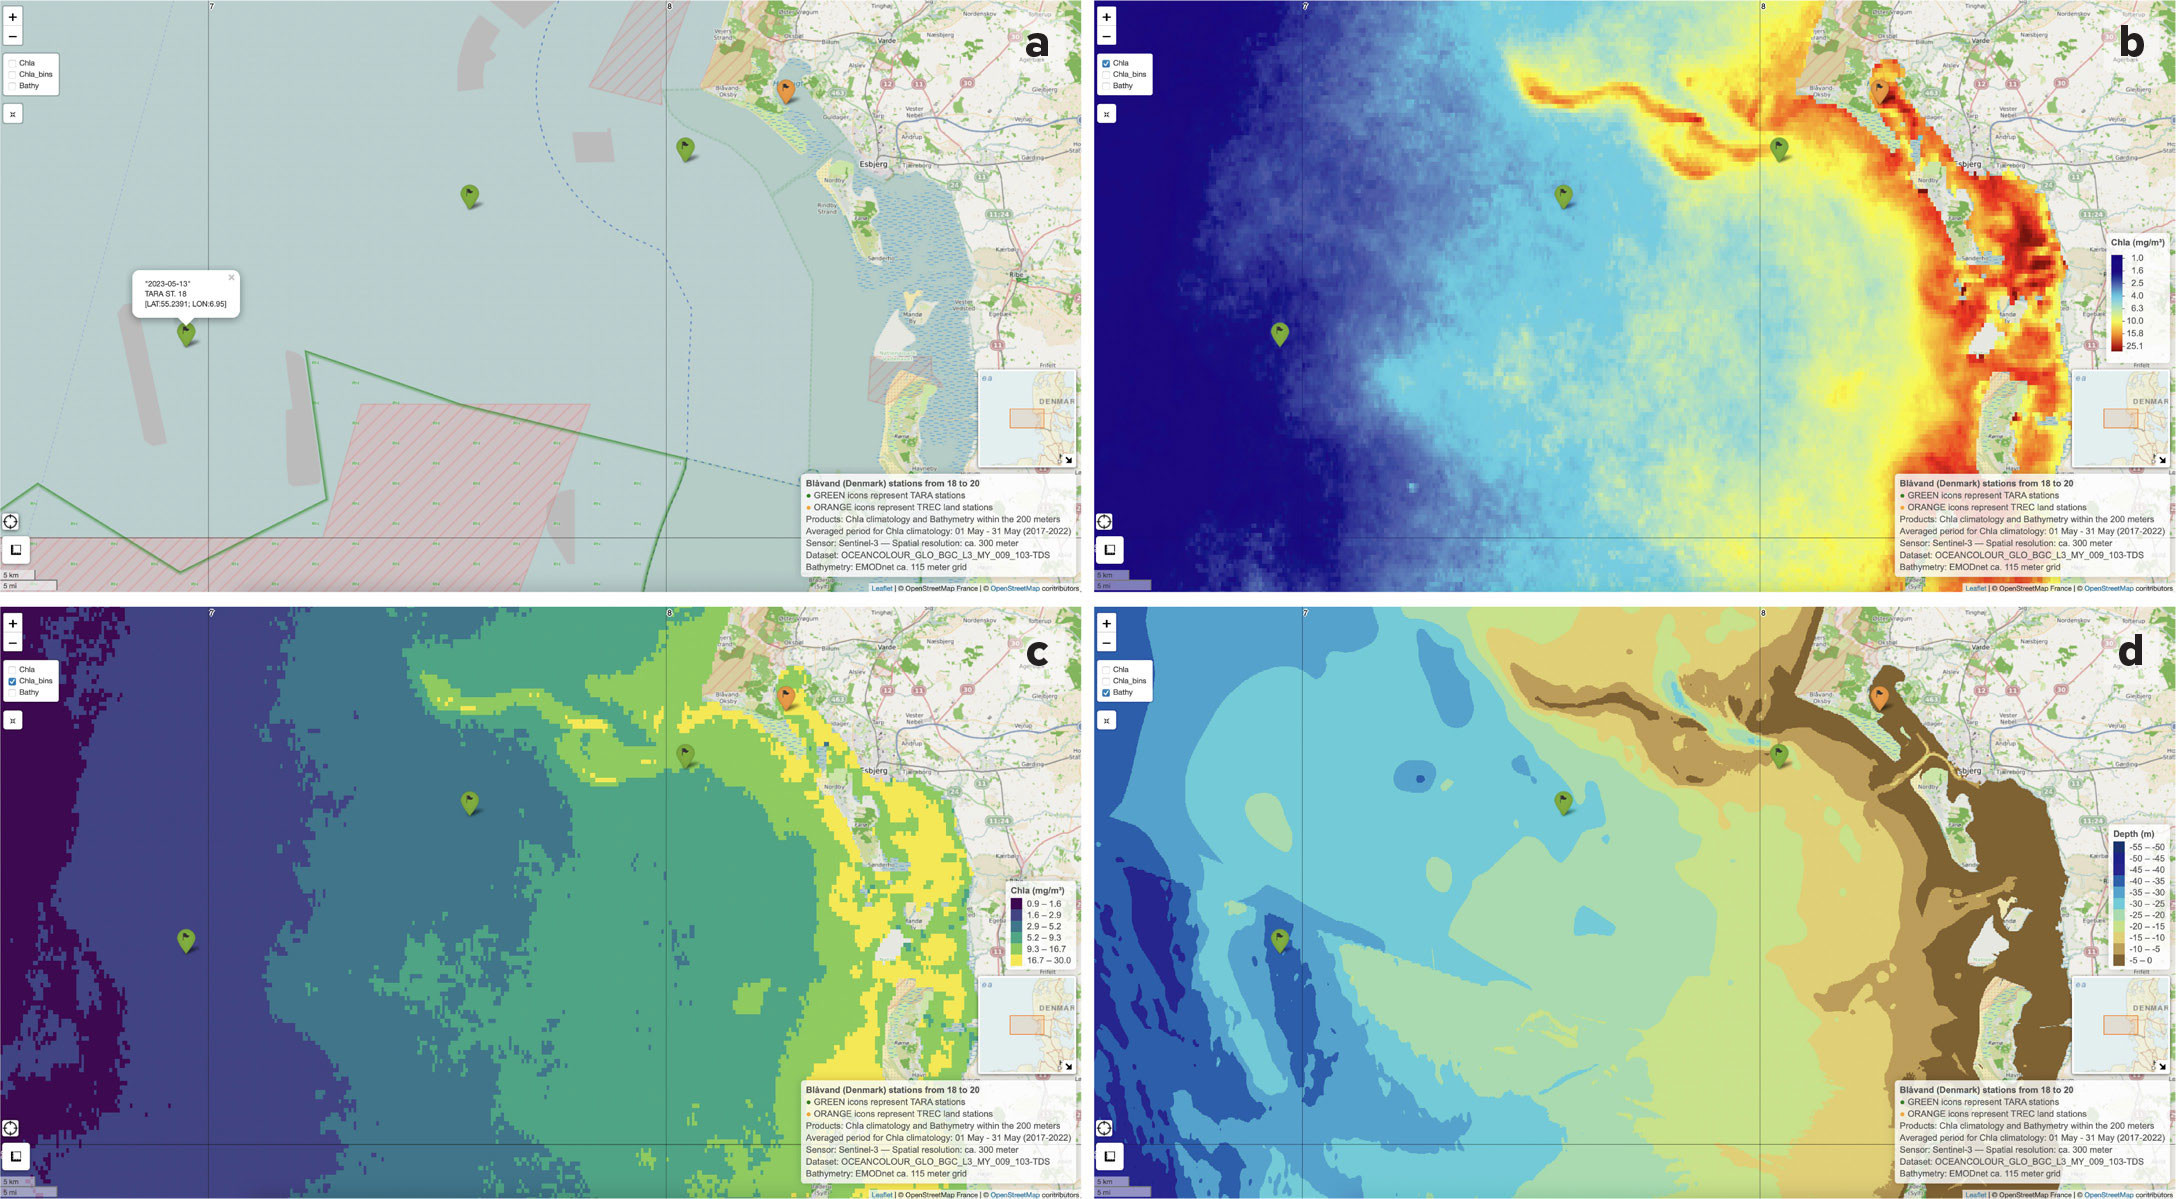
FIGURE 2. Site visualization for the Blåvand site in the Wadden Sea National Park in southern Denmark show (a) the mapping base, (b) the climatological mean of chlorophyll-a, (c) the climatological mean of chlorophyll-a by bins, and (d) the relevant bathymetry map with the sampling stations (green markers on the map) superimposed. Panel a includes a pop-up for the offshore station with sampling data and station coordinates. An orange marker indicates the area sampled by TREC. Sentinel-3 data of CHL concentrations at 300 m of spatial resolution were downloaded from the CMEMS data store. High-resolution (~115 m) bathymetric data were downloaded using the map viewer tool from the EMODnet website. > High res figure
|
As for the Blåvand site, the positions of the sampling stations for the other sites were selected considering CHL patterns, bathymetry, and predictions for circulation and tidal currents during the sampling period (not shown). Leaflets were used as a convenient medium to visualize satellite data, intended to provide spatially representative maps for assessing biogeochemical variability and thus facilitate discussion among researchers regarding sampling stations for each site reached by the Tara schooner during 2023.
We have found incorporating leaflets as a mapping tool for specific tasks within scientific projects, where satellite images can assist in sampling decisions for environments of interest, to be highly beneficial. It has allowed structuring of geospatial data by creating useful interactive maps rapidly, providing a tool for researchers to better understand the environment. During the Tara Europa expedition, researchers and crew used leaflets to define and refine the location of Tara Europa sampling stations during online meetings.
Possible Future Development
A further improvement may be to integrate leaflet with Shiny (https://shiny.posit.co/, also an R or Python package) to develop web applications with more sophisticated GUIs that dynamically update their outputs (e.g., maps, charts, tables) whenever the user changes inputs or interacts with the application. For example, the Shiny app PhytoFit (https://github.com/BIO-RSG/PhytoFit), developed by the remote sensing group at the Bedford Institute of Oceanography, is used to display satellite chlorophyll concentration, calculate statistics, and model phytoplankton blooms for regions within custom polygons. This could be particularly useful for scientific projects that need to share geospatial ocean information among teams using interactive, comprehensive, and user-friendly graphical interfaces, enabling quick exploration of datasets. Leaflet map outputs could also be rendered into online reports using Quarto (https://quarto.org/), an open-source scientific and technical publishing system. Visualizing spatial data on interactive maps enhances outreach by making complex datasets intuitive and accessible to a broad audience.
Acknowledgments
We thank the TREC consortium, the Tara Europa consortium, the TREC core partners EMBL, the Tara Ocean Foundation, and the European Marine Biological Resource Centre (EMBRC) for their commitment to making the TREC expedition possible. We also thank EUMETSAT and the Copernicus Marine Environment and Monitoring Service (CMEMS) for providing free ocean-color satellite data and the European Marine Observation and Data Network (EMODnet) for bathymetry data. This work has been carried out within the framework of the ESA-funded Hyperspectral Bio-Optical Observations Sailing on Tara (HyperBOOST) project. CM was an EMBL internally funded postdoc. This paper is contribution number 1 of the Traversing European Coastlines (TREC) program. We sincerely appreciate the reviewers’ helpful comments and suggestions, which improved the code and manuscript
Declaration of Interest
We confirm that no conflict of interest or financial support related to this publication influenced its outcome.

