INTRODUCTION
Events such as fish stock collapse, coastal flooding during severe storms, and major oil and other toxic spills, along with the need for the conservation of protected and endangered species including many marine mammals, are making ocean users and the broader public increasingly aware of the need for responsible marine stewardship. Interest in responsible planning and management of ocean resources has sparked international research programs that are measuring baseline conditions that can be used to assess current effects and future variations, trends, and impacts. Through the National Oceanographic Partnership Program (NOPP), the Bureau of Ocean Energy Management (BOEM), Office of Naval Research (ONR), and National Oceanic and Atmospheric Administration (NOAA) contracted a team led by the University of New Hampshire to develop and deploy the Atlantic Deepwater Ecosystem Observatory Network (ADEON), whose objective was to improve the understanding of marine soundscapes and their relation to the ecosystem of the US Atlantic deep waters. Marine ecosystem monitoring supports the mandates of multiple federal agencies that seek to understand and mitigate human impacts on the offshore environment. Long-term observations of living marine resources and marine sound inform compliance with the US Endangered Species Act, the Marine Mammal Protection Act, and the Sustainable Fisheries Act, while physicochemical measurements of water and air quality help inform agency compliance with the Clean Water and Clean Air Acts.
Although there has been extensive hydrographic research along the South Atlantic OCS (e.g., Lee et al., 1991; Atkinson et al., 1983; Lee and Atkinson, 1983), knowledge of the ocean soundscape and its relationship to regional OCS dynamics is relatively unexplored. Ocean sound is now an accepted Essential Ocean Variable in the Global Ocean Observing System (Tyack et al., 2023) due to its wide utility as an indicator of physical and biological ocean processes. Sound travels efficiently underwater, making it the dominant modality that marine life and humans alike use to sense and respond to the changing environment; information provided by underwater acoustic methodologies has become critical to applications spanning national security, adaptive management of marine resources, monitoring of climate change, tsunami warning, and search and rescue (Howe et al., 2019). Thus, understanding the unique and complex relationship between ocean sound and the environment at regional scales is vital to assessing any projected impact of immediate or forecasted change related to climate or human use.
A full contextual description of the relationship between marine organisms and their environments, including acoustics, is lacking (Hawkins and Popper, 2017). The effects of exposure of marine organisms to intense sounds is becoming better understood; however, the long-term cumulative effects from noise-generating sources, including seismic surveys, offshore wind energy, military and shipping vessels, and recreational boating, is not well understood. Hence, there is a critical need to work toward comprehensive knowledge of the interactions between marine life and the ocean soundscape, defined as the auditory scene in a region resulting from biologic (marine life), geologic (non-biological natural sound such as wind, precipitation, and ice), and anthropogenic (human activity) contributions to the soundscape, characterized by the ambient sound in terms of its spatial, temporal, and frequency attributes, and the types of sound sources (ISO 18405, 2017). ADEON was designed to synoptically record ocean sound and ecosystem indicators of biomass, conductivity, temperature, and dissolved oxygen (CT-DO). Measurements from stationary, mobile, and space-based platforms (Figure 1a) were combined to provide context for understanding and modeling how environmental variability manifests in the regional soundscape.
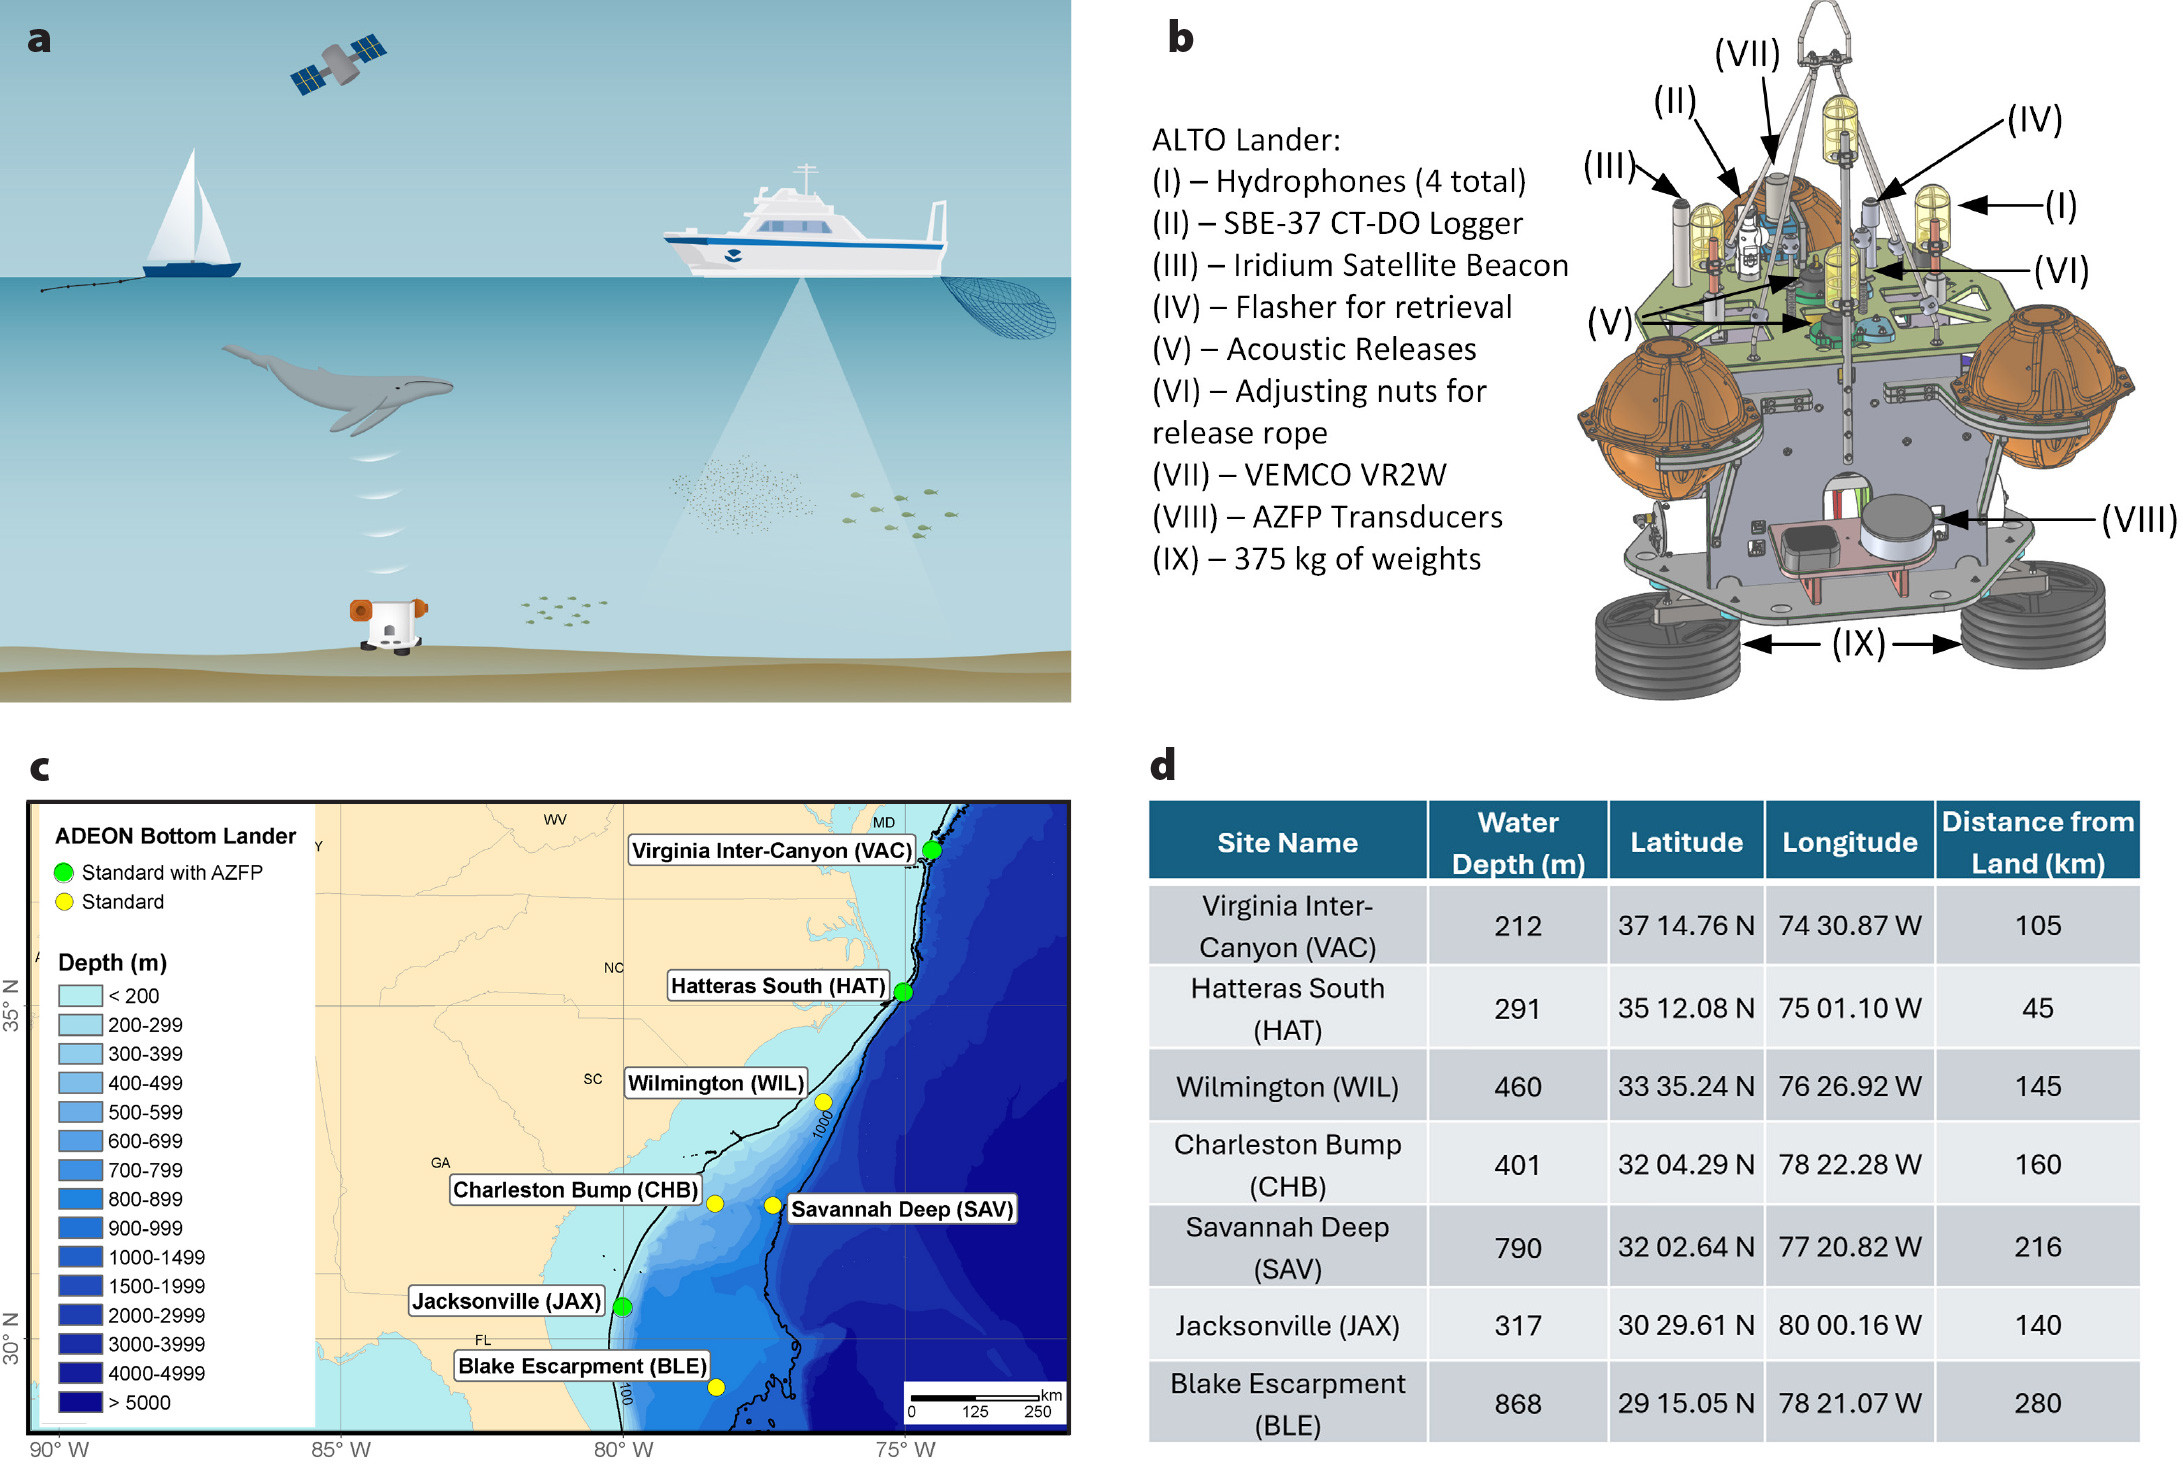
FIGURE 1. (a) Data was collected for the Atlantic Deepwater Ecosystem Observatory Network (ADEON) using fixed and mobile platforms, shipboard sampling, and satellite remote sensing. (b) Schematic of the Autonomous Long-Term Observatory (ALTO) landers used in ADEON. Hydrophones were spaced between 0.45 m and 0.68 m. (c) ADEON sites overlayed with bathymetry. Standard landers had a passive acoustic system and oceanographic sensors. The Standard with the Acoustic Zooplankton Fish Profiler (AZFP, ASL Environmental Sciences, Canada) landers had the addition of an echo sounder system. (d) ADEON sites ordered from north to south. > High res figure
|
ADEON was structured into four major technical phases: (1) Network Design, Equipment Procurement, and Deployment; (2) Data Acquisition and Network Maintenance; (3) Data Processing, and (4) Data Integration and Visualization. During the proposal development stage, the ADEON team recognized a lack of community-wide standardization for ocean soundscape data and data products. Thus, standardization was an overarching effort elevated above the four technical phases that generated products for soundscape terminology, data acquisition, processing, and reporting. In fulfillment of the NOPP requirement to make all data and products publicly available, all raw data are publicly available through the NOAA National Centers for Environmental Information (https://www.ncei.noaa.gov/products/passive-acoustic-data), and all processed data products are accessible through the ADEON Data Portal (https://adeon.unh.edu/data_portal).
Significant Contributions
The overarching goal of ADEON was to establish an integrated, deep-water acoustical observing system for the US Mid- and South Atlantic OCS that generated year-round measurements of the natural and human factors driving the regional ecology and soundscape over several years and that are transferable to other locations. To meet this goal, the program generated new technology, infrastructure, measurement, and analysis approaches that have since been applied to other regions. The ADEON effort went beyond data collection and analyses related to monitoring ecosystem components to perform basic science and publicly disseminate the data to support future research. Science and innovation accomplishments of ADEON include (1) development and implementation of standardized acoustic metrics and practices across ADEON components that are serving as a model for national and international soundscape programs, (2) development of an Autonomous Long-Term Observation (ALTO) lander that simultaneously records acoustic (passive and active) and oceanographic information, (3) identification of the horizontal range of extrapolation for acoustic backscatter point samples recorded at each lander location for guiding future monitoring designs (Blair et al., 2021), (4) documentation of minke whale winter mating grounds in the southern and offshore waters of the Blake Plateau (Kowarski et al., 2022), (5) determination of site fidelity of beaked whale species along the southeastern US OCS (Kowarski et al., 2022), (6) model-data comparison of combined wind and vessel soundscape model levels (Heaney et al., 2024), (7) modeling of regional ecology to predict potential influences of long-term change on marine ecosystems, and (8) development of web-based tools to access and visualize multi-dimensional data streams.
The ADEON team established a long-term (three-year) observing network that provided the first publicly available, multi-location (seven sites), wide-band (10–7,000 Hz), directional passive acoustic dataset and associated environmental time series from an acoustically undersampled region of the United States Exclusive Economic Zone along the southeastern OCS. Data collected are applicable to marine spatial planning and ecosystem-based management, and they also provide a mechanistic understanding of cumulative impacts on marine resources. ADEON acquired measurements and developed objective metrics that enabled a quantitative assessment of the Mid- and South Atlantic Ocean region soundscape, with consideration of ecosystem conditions, as they may be linked to extant biologic, geophysical-chemical, and/or anthropogenic processes. Consideration was also given to resolving periodicities in regional processes over long timescales to establish an acoustic baseline for extracting trends and for comparing to historical oceanographic time series in the region.
ADEON MULTI-PLATFORM APPROACH
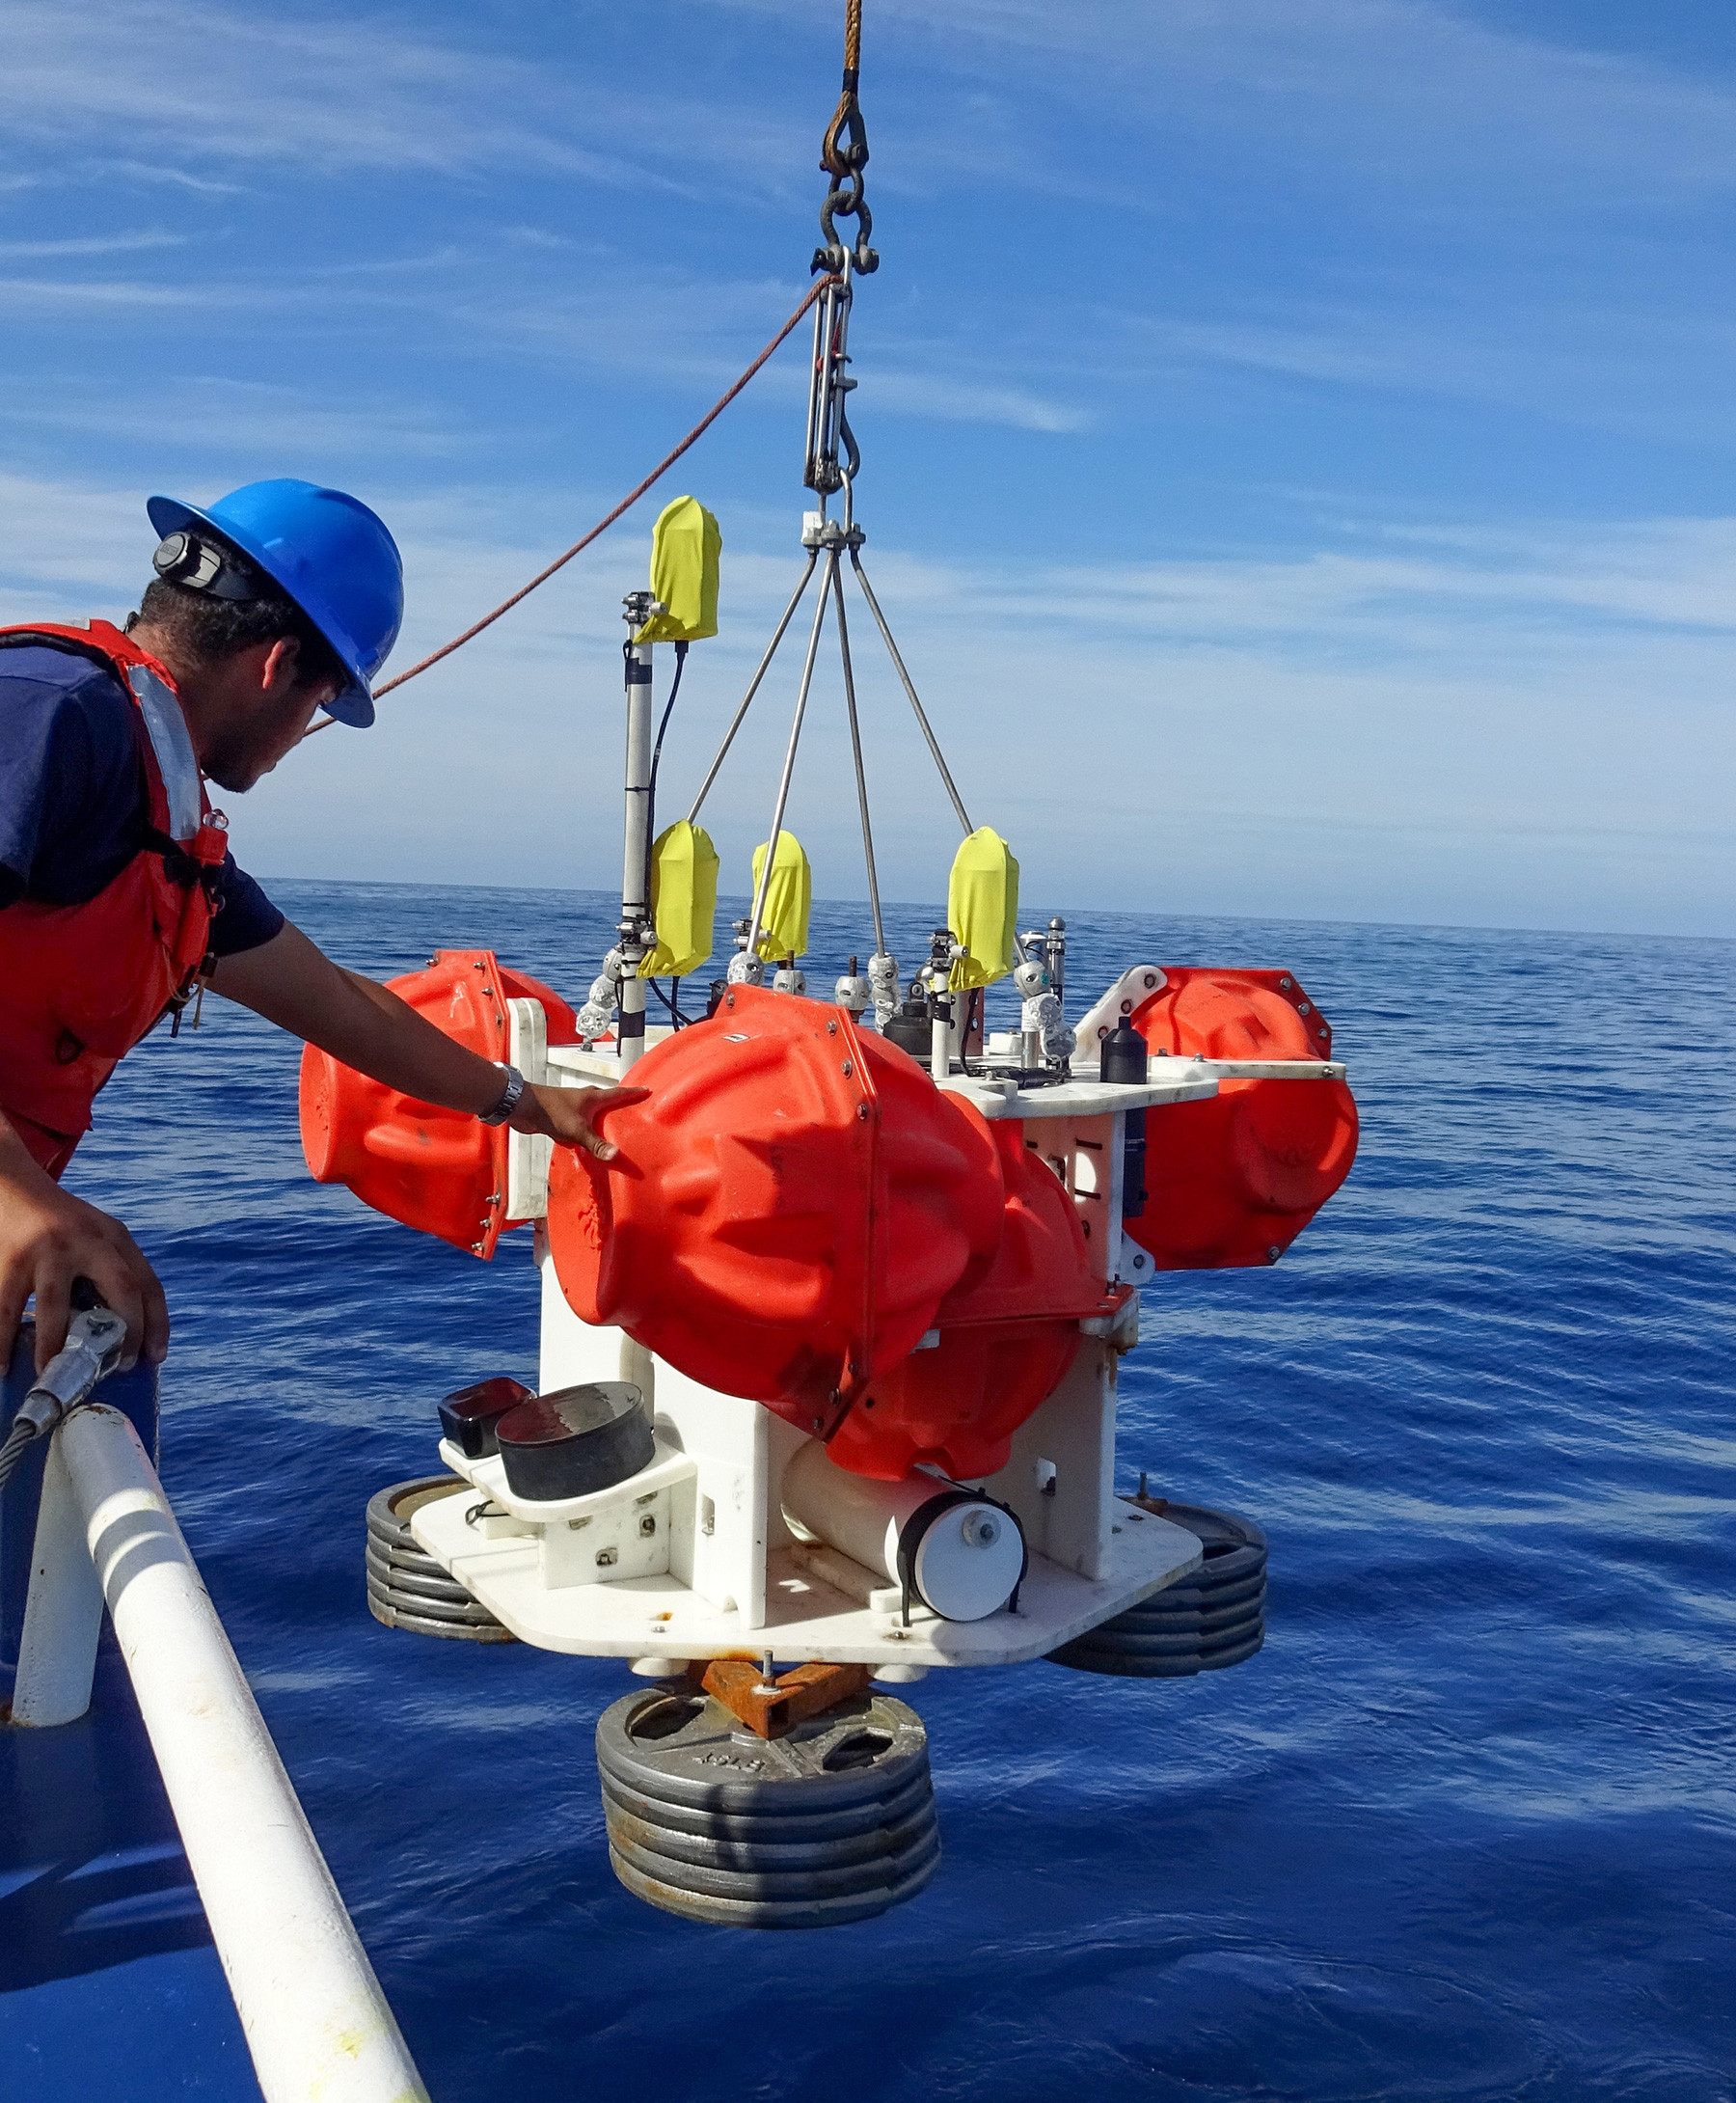
The backbone of the measurement program was the ALTO lander developed by JASCO Applied Sciences specifically for the ADEON program (Figure 1b). The lander sensors included a passive, four-channel autonomous acoustic recorder (AMAR), a four-frequency echo sounder (Acoustic Zooplankton Fish Profiler – AZFP by ASL Environmental Sciences, Canada), a VEMCO VR2W fish tag receiver, and a Sea-Bird-37 CT-DO unit. This combination of technology is transferable and relocatable and has been successfully deployed by other projects and in additional regions since the conclusion of ADEON, including AEON (Acoustic and Environmental Observation Network in the NW Atlantic; https://eos.unh.edu/aeon), multiple projects to monitor the movement of marine mammals around oil and gas developments off Canada and Australia, and many wind farm developments in the United States, Scotland, and Australia.
Lander sites were selected by considering ecological relevance, diversity of anthropogenic activities, 200–900 m target depth range (with three sites less than 400 m deep to accommodate the echosounder depth maximum), sufficient along-shelf and across-shelf comparisons, and locations of other known observation assets to support the analysis of soundscape portability (Figure 1c,d). Five University-National Oceanographic Laboratory System (UNOLS) cruises were devoted to servicing lander deployments, turnarounds, and recovery and also supported vessel-based, biological net tows performed during fine-scale acoustic surveys (FSASs) of water column backscatter, marine mammal surveys, full water column CTD casts, and acoustic propagation characterization at each lander location. Kowarski et al. (2022) present the details of the deployment dates, durations, and AMAR lander passive acoustic array parameters.
The landers were deployed from November/December 2017 to December 2020. The four-channel AMARs sampled approximately 45 minutes of each hour, alternating between a single channel at 16 kHz sampling rate for 20 minutes, all four channels at 16 kHz for 20 minutes, and a high frequency 512 kHz sampling rate for a total of five minutes. The echo sounder system sampling for 10–12 minutes each hour occurred during the portion of the hour when the AMAR was sleeping to eliminate contamination of the passive acoustic recordings. The AZFP emitted a 750 μs ping every four seconds during the 10–12 minute sampling period. The CT-DO unit sampled every 30 minutes.
To link the long-term measurements to environmental conditions, the network design included remote sensing of oceanic and atmospheric variables to be used as covariates in the ecosystem and soundscape models. These data included: (1) automated identification system (AIS) ship tracks, (2) sea surface temperature (a combination of data from the NASA Jet Propulsion Laboratory [JPL] and Copernicus), (3) chlorophyll a concentrations obtained from the NASA-NOAA Visible Infrared Imaging Radiometer Suite (VIIRS) onboard the Suomi National Polar-orbiting Partnership (SNPP) satellite, (4) net primary productivity derived from NASA using the Vertically Generalized Production Model (VGPM) by Behrenfeld and Falkowski (1997), (5) mixed layer depth derived from the Hybrid Coordinate Ocean Model (HYCOM), (6) wind speed and direction from the Advanced SCATterometer (ASCAT) real aperture sensor onboard the meteorological operational platforms of the French Institute for Ocean Science (IFREMER), and (7) upper surface current speed and direction from the Ocean Surface Current Analysis Real-time (OSCAR) project at JPL. The final element of the network design incorporated mobile measurements that provided a broader context for the long-term measurements. These consisted of data from the FSASs performed by the lander service vessel, a horizontal array of hydrophones towed by a drifting sailboat, and an autonomous sailboat that measured variability of the soundscape between lander locations and across the Gulf Stream—the dominant regional oceanographic feature.
ADEON STANDARDS
The standardization component of ADEON increased the value of its data by providing products comparable to data from other national and international acoustic programs. ADEON adopted the international standard for underwater acoustical terminology ISO 18405 Underwater acoustics – Terminology (ISO 18405, 2017; Ainslie et al., 2021), compatible with the International System of Units (BIPM 2019) and the International System of Quantities (ISO 80000-8 Quantities and units – Acoustics). A dictionary of terms was created to facilitate internal communication among project team members as well as with external stakeholders. The ADEON Project Dictionary: Terminology Standard (https://doi.org/10.6084/m9.figshare.12436199.v2) was also used by the Joint Monitoring Programme for Ambient Noise in the North Sea (JOMOPANS; Robinson and Wang, 2021), the EU’s SATURN program (Ainslie et al., 2024), and ISO/DIS 7605 Underwater Acoustics—Measurement of Underwater Ambient Sound (https://www.iso.org/standard/82844.html). ADEON terminology was also adopted in recommendations from two international workshops, one in Dublin in 2016 (Ainslie et al., 2019) and one in Berlin in 2022 (Martin et al., 2024), and it served as the basis for the new ISO project 23990 Underwater Acoustics—Bioacoustical Terminology via the SATURN terminology standard.
For passive acoustic processing bands, ADEON adopted international standard decidecade band terminology (IEC 61260-1:2014) whereby multiple decidecade bands can be combined into a single decade band or user selected bands (https://doi.org/10.6084/m9.figshare.6792359.v2). To achieve high frequency resolution over a wide frequency range, the ADEON Data Processing Specification (https://doi.org/10.6084/m9.figshare.12412610.v1) introduced hybrid millidecade bands, with millidecade bands used at high frequency and 1 Hz bands at low frequency (Martin et al., 2021). Finally, two further standards describe ADEON’s choice of hardware (https://doi.org/10.6084/m9.figshare.6809711) and calibration and deployment guidelines (https://doi.org/10.6084/m9.figshare.6793745).
ADEON RESULTS
Passive Acoustics
A total of 116 TB of passive acoustic data were recorded during the three-year data collection phase of ADEON. All data were retrieved, except for August–November of 2019 and 2020 at site VAC, which were lost due to commercial trawling; these landers were successfully retrieved thanks to their satellite beacons (Figure 1). Figure 2 summarizes this extensive dataset using the monthly empirical probability density functions (EPDF) of the one-minute sound pressure levels (SPL) in various decidecade frequency bands. The broadband SPL was computed from the high-frequency sampling rate data and covers four ADEON decade bands, which are sum of the decidecade bands centered from 10 Hz to 80,000 Hz, with edge frequencies of 8.91–89,100 Hz. The peak of the EPDFs for the broadband SPL at all stations was near 100 dB re 1 µPa². The two stations closest to shipping lanes (VAC and HAT) had the highest peak SPLs in their broadband EPDFs.
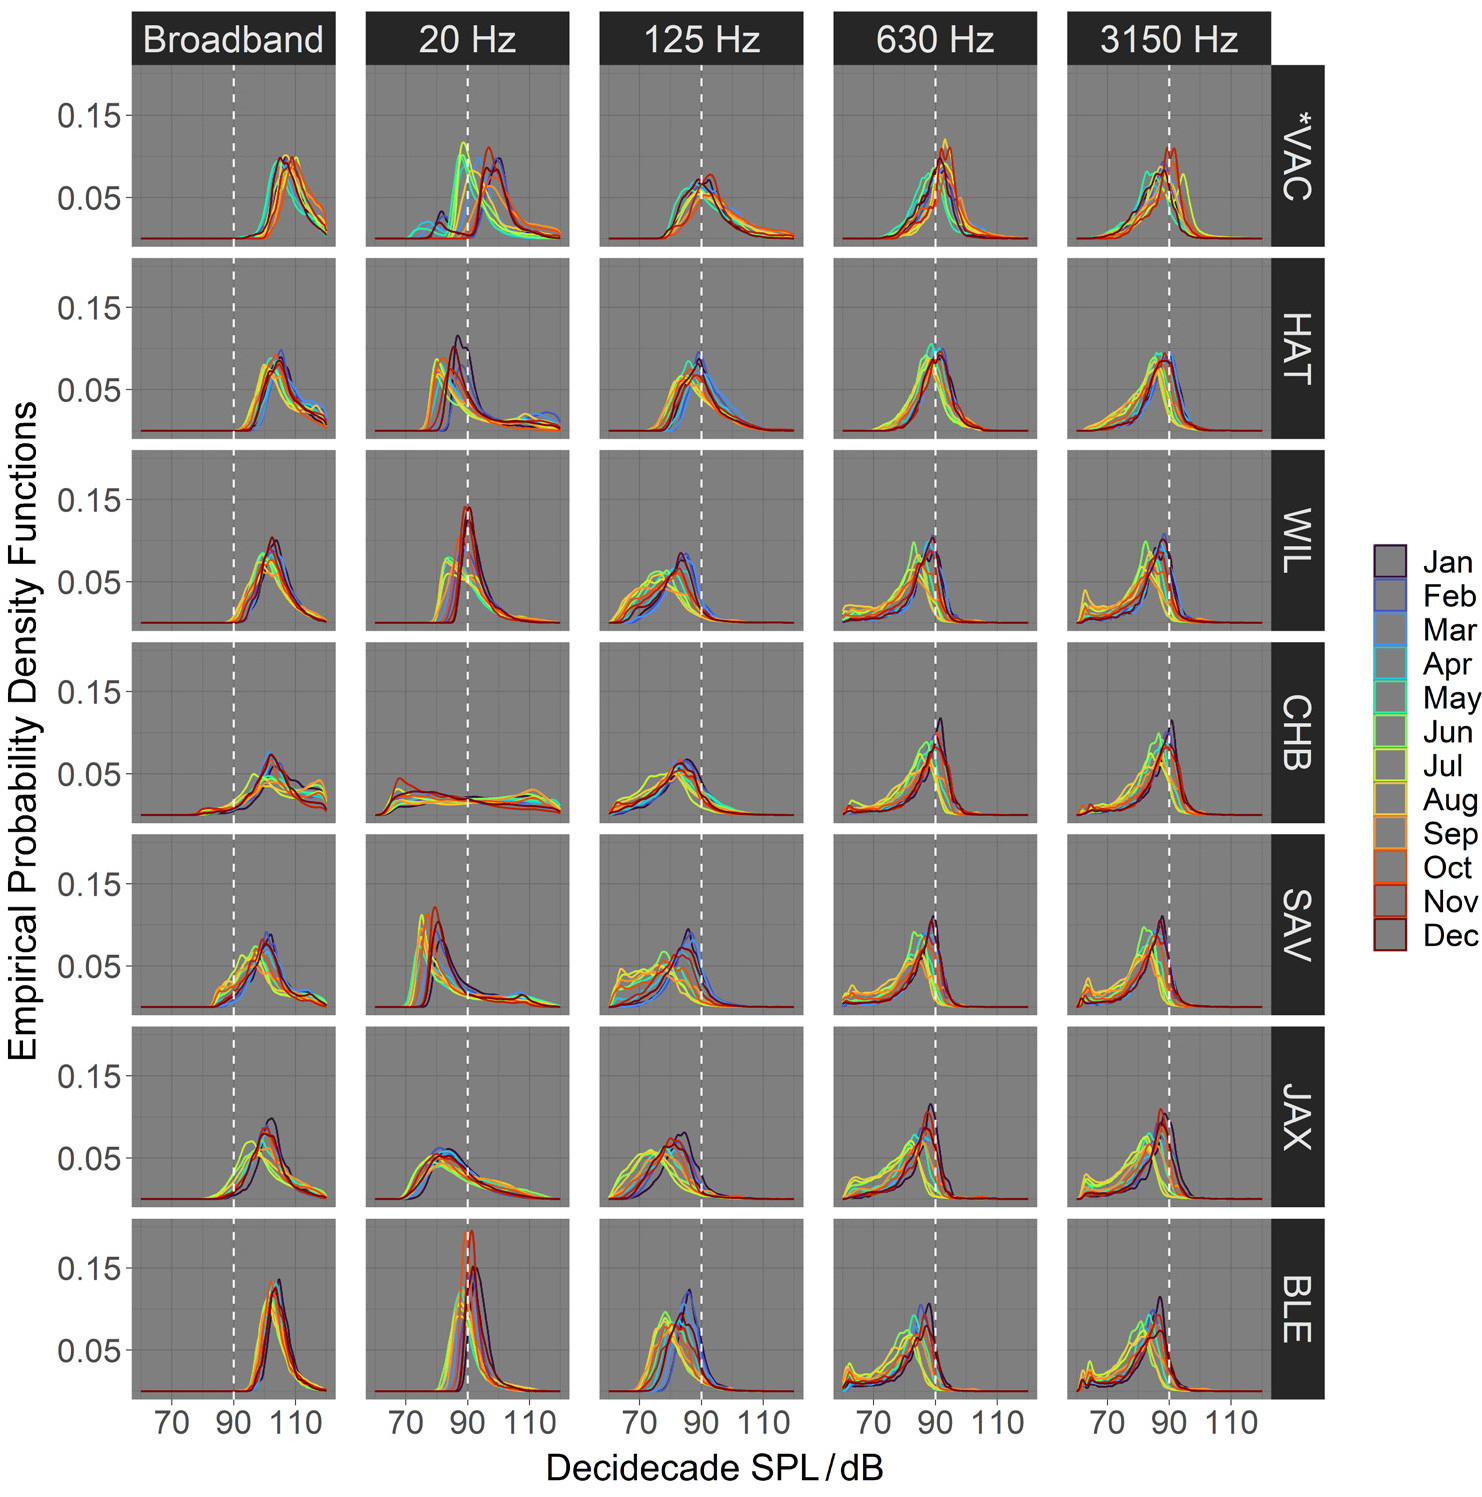
FIGURE 2. An overview of the ADEON soundscape using monthly empirical probability density functions of one-minute sound pressure levels averaged over all years. The columns are different frequency bands: broadband (8.91–89,100 Hz) sound pressure level (in dB), and the 20, 125, 630, and 3,150 Hz decidecade bands. The seven rows are for the seven recording locations. The colors represent the month, as shown by the legend on the right. A dashed line at 90 dB provides a reference for comparison between frequency bands and stations. At VAC, the lander was picked up by fishers in July of 2019 and 2020, so only data from 2018 are available for August to November. The reference sound pressure is 1 µPa. > High res figure
|
The EPDFs for four decidecade bands shown in Figure 2 present some of the key features of the OCS soundscape. The 20 Hz decidecade band had higher levels in winter than in summer due the mating chorus of fin whales, showing that this biological contribution is often the most notable part of the soundscape at 20 Hz. The 20 Hz and 125 Hz decidecade bands at CHB had distorted EPDFs due to the strong effect of flow-induced noise on the results. In general, the 125 Hz decidecade band exhibited substantial contributions from two sources—vessels and minke whales. The differences between the summer and winter sound levels at the southern stations (WIL, CHB, SAV, JAX, and BLE) were caused by the mating chorus of minke whales in winter. The two northern stations (VAC and HAT) showed little difference between summer and winter months due to the frequent presence of vessels. The two higher frequency decidecade bands (630 Hz and 3,150 Hz) both show higher SPLs in winter and lower levels in summer, associated with higher mean wind speeds in winter than in summer.
Several studies of the ADEON soundscape have provided insight into the contributions of various sources and explored different approaches to quantifying their effects. The detections of vessels (Figure 3) differed significantly between stations. HAT and JAX, which were closer to shipping lanes, had higher daily counts than the other locations. Detections at HAT were reduced in the second year due to masking by high overall sound levels.
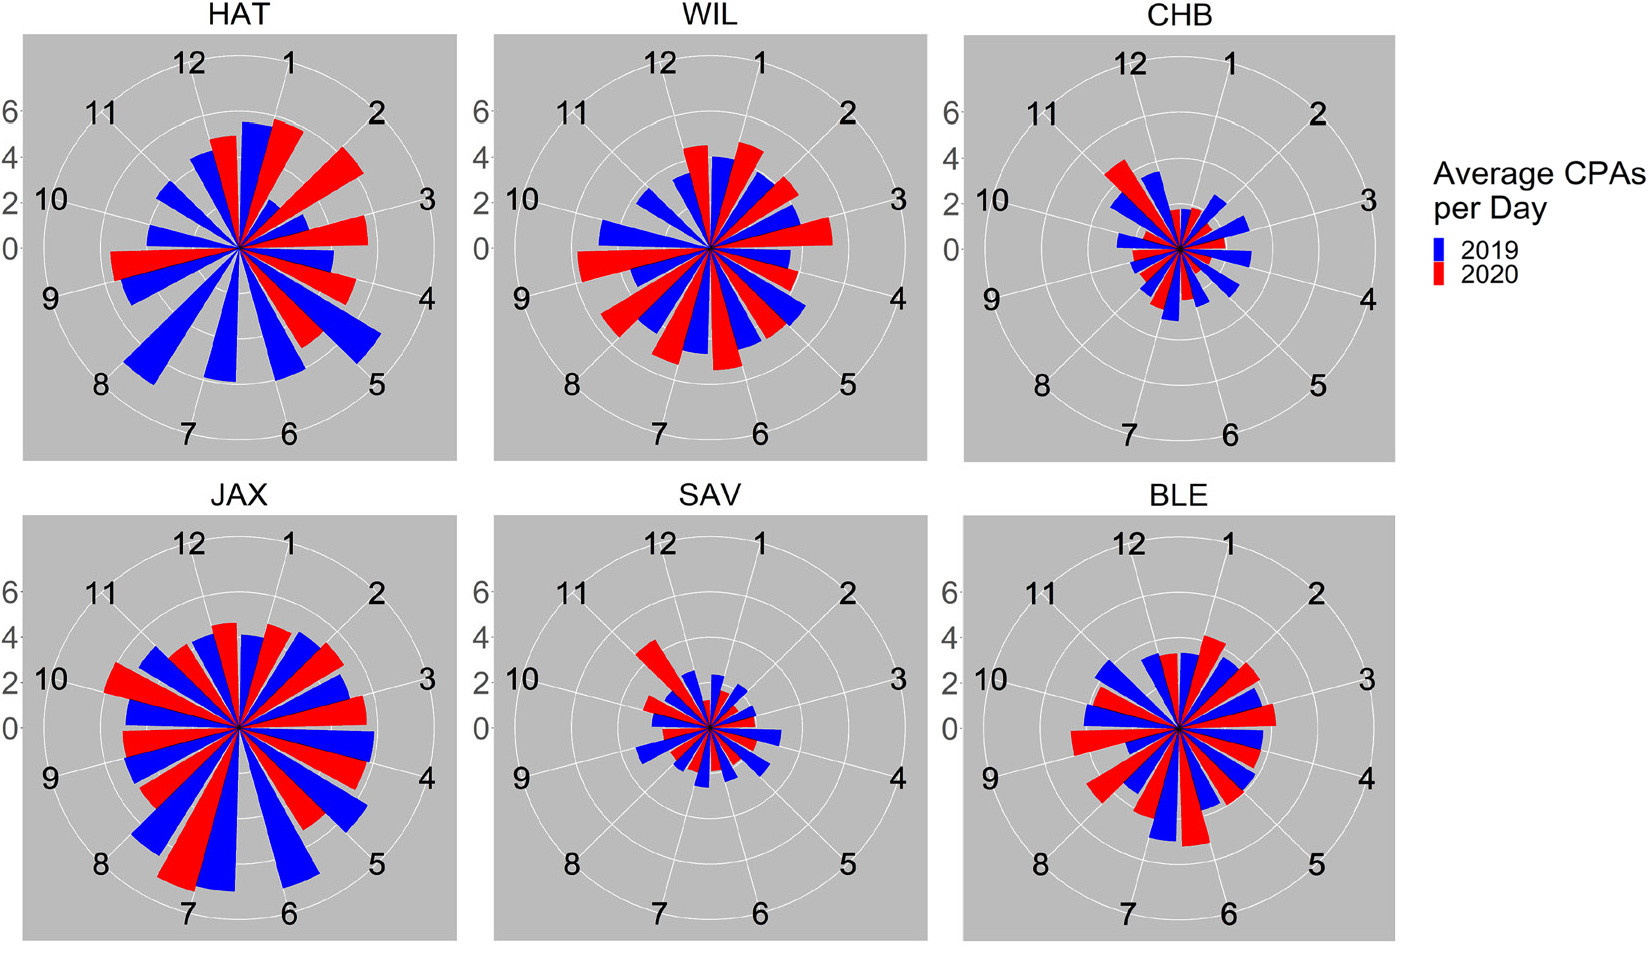
FIGURE 3. Average number of vessel closest points of approach (CPAs) are shown as detected at ADEON stations by month for the second and third monitoring years. > High res figure
|
The ADEON data were employed to develop a soundscape code (Wilford et al., 2021), which was subsequently used to explore the differences between ADEON sites with (SAV) and without (BLE, WIL) live hard bottom deep-water coral and a tropical coral reef. The tropical coral reef was unique to the deep-water sites; however, the two deep-water coral reefs (one from ADEON and one from ADEON’s sister NOPP project, DeepSearch) were also different from the sites without live hard bottom, indicating that soundscape metrics can distinguish these deep-water habitats (Wilford et al., 2023).
The 2019 and 2020 ADEON data were studied to determine if there were differences in the soundscape associated with the global COVID shutdown in March 2020. Changes in sound levels that were detected in this offshore region did not align with the shutdown period (Miksis-Olds et al., 2022).
Kowarski et al. (2022) examined the presence of cetaceans in the ADEON area. A total of eight odontocete and six mysticete cetacean species/groups were identified in the ADEON data. There was higher species diversity during winter months than summer months, suggesting that species were moving north in the summer and south in the winter. Dolphins were the most commonly detected species group, with presence at all stations in all months. BLE and SAV were identified for the first time as sites with regular presence of beaked whales that exhibited species-specific site fidelity. Blainsville’s beaked whales were present in most months at BLE, while SAV had either True’s or Gervais beaked whales present in most months. North Atlantic right whales were only confirmed on one occasion, in January 2018 at HAT. For the other mysticete species, ADEON confirmed results first reported in Davis et al. (2020) that the distribution of blue and sei whales is moving northward, and that sei, blue, and fin whales are using the deeper waters of the OCS more than previously reported. Minke whales were highly vocal at the southern and offshore ADEON sites in the winter months, which confirmed the proposal by Risch et al. (2014) that the OCS is an important mating ground for minke whales. Kiehbadroudinezhad et al. (2021) developed a new detector for minke whales’ pulse trains and proposed a new method for relative abundance estimation to compare the presence of minke whales in space and time using the ADEON data. Continued acoustic ocean monitoring is important to document further shifts and potential human-cetacean interactions in the future.
Active Acoustics
Pelagic zooplankton and fish distributions are spatially and temporally patchy, requiring large amounts of data to fully capture their variability (Mackas et al., 1985). This makes estimating pelagic population abundances difficult, expensive, and time consuming. Scientific echosounders historically deployed from vessels are efficient for acquiring temporal and spatial data to characterize the physical properties of the water columns that pelagic organisms occupy (e.g., internal waves) (Benoit-Bird and Lawson, 2016). Technological advances have resulted in autonomous systems that can be deployed on moorings or landers to collect time series of longer duration than ship-based sampling, though at a single location (Trevorrow, 2005). Multiple stationary systems spread across a region of interest can provide information at broader spatial scales; however, the spacing of these systems depends on the intrinsic biological and physical processes present. The ADEON team objectives focused on biological scatter in the water column, and it is hoped that the publicly available data will inspire future research focused on the physical parameters linked to the backscatter signals.
The ADEON program incorporated both bottom-deployed upward-looking and vessel-based downward-looking active acoustic data collection and biological net tows (Figure 4a) to provide information relevant to the placement of the stationary AZFP sampling systems operating at 38, 125, 200, and 455 kHz. Blair et al. (2021) describe FSASs measuring 38 kHz backscatter from a vessel (Figure 4b) over an area of 100 km2 (Figure 4c) centered at the seven ADEON bottom lander sites during a three-year period. Volume backscatter data were gridded both horizontally (100 m) and vertically (5 m; Figure 4a) to produce variogram range estimates, the distance over which data are spatially autocorrelated, providing a proxy for scatterer patch size and representative distance (Legendre and Fortin, 1989). Patch horizontal lengths were consistently 2–4 km among the seven ADEON locations (Blair et al., 2021).
A second study compared the spatial and temporal autocorrelations of vessel survey and stationary backscatter data using two approaches. First, virtual backscatter transects were created by advecting stationary echosounder data using measured current velocities from the vessel-mounted acoustic Doppler current profiler during the FSASs at each site. This was done during the same night an FSAS occurred, so spatial autocorrelation could be estimated for both data types. Next, the temporal autocorrelation of the two-week-long time series of hourly backscatter (Figure 4d,e) centered in time on each applicable FSAS date for three sites (VAC, HAT, and JAX) was converted into a distance estimate to compare with the FSAS variogram ranges (Figure 4e). This methodology allowed for longer time periods (up to two weeks instead of 12 hours) to be analyzed and for associated autocorrelation patterns to be detected. The resulting autocorrelation distances from the stationary systems (0.8–3.4 km) were similar to those (1.3–3.8 km) from vertically integrated FSAS data from the same three sites (Blair, 2023).
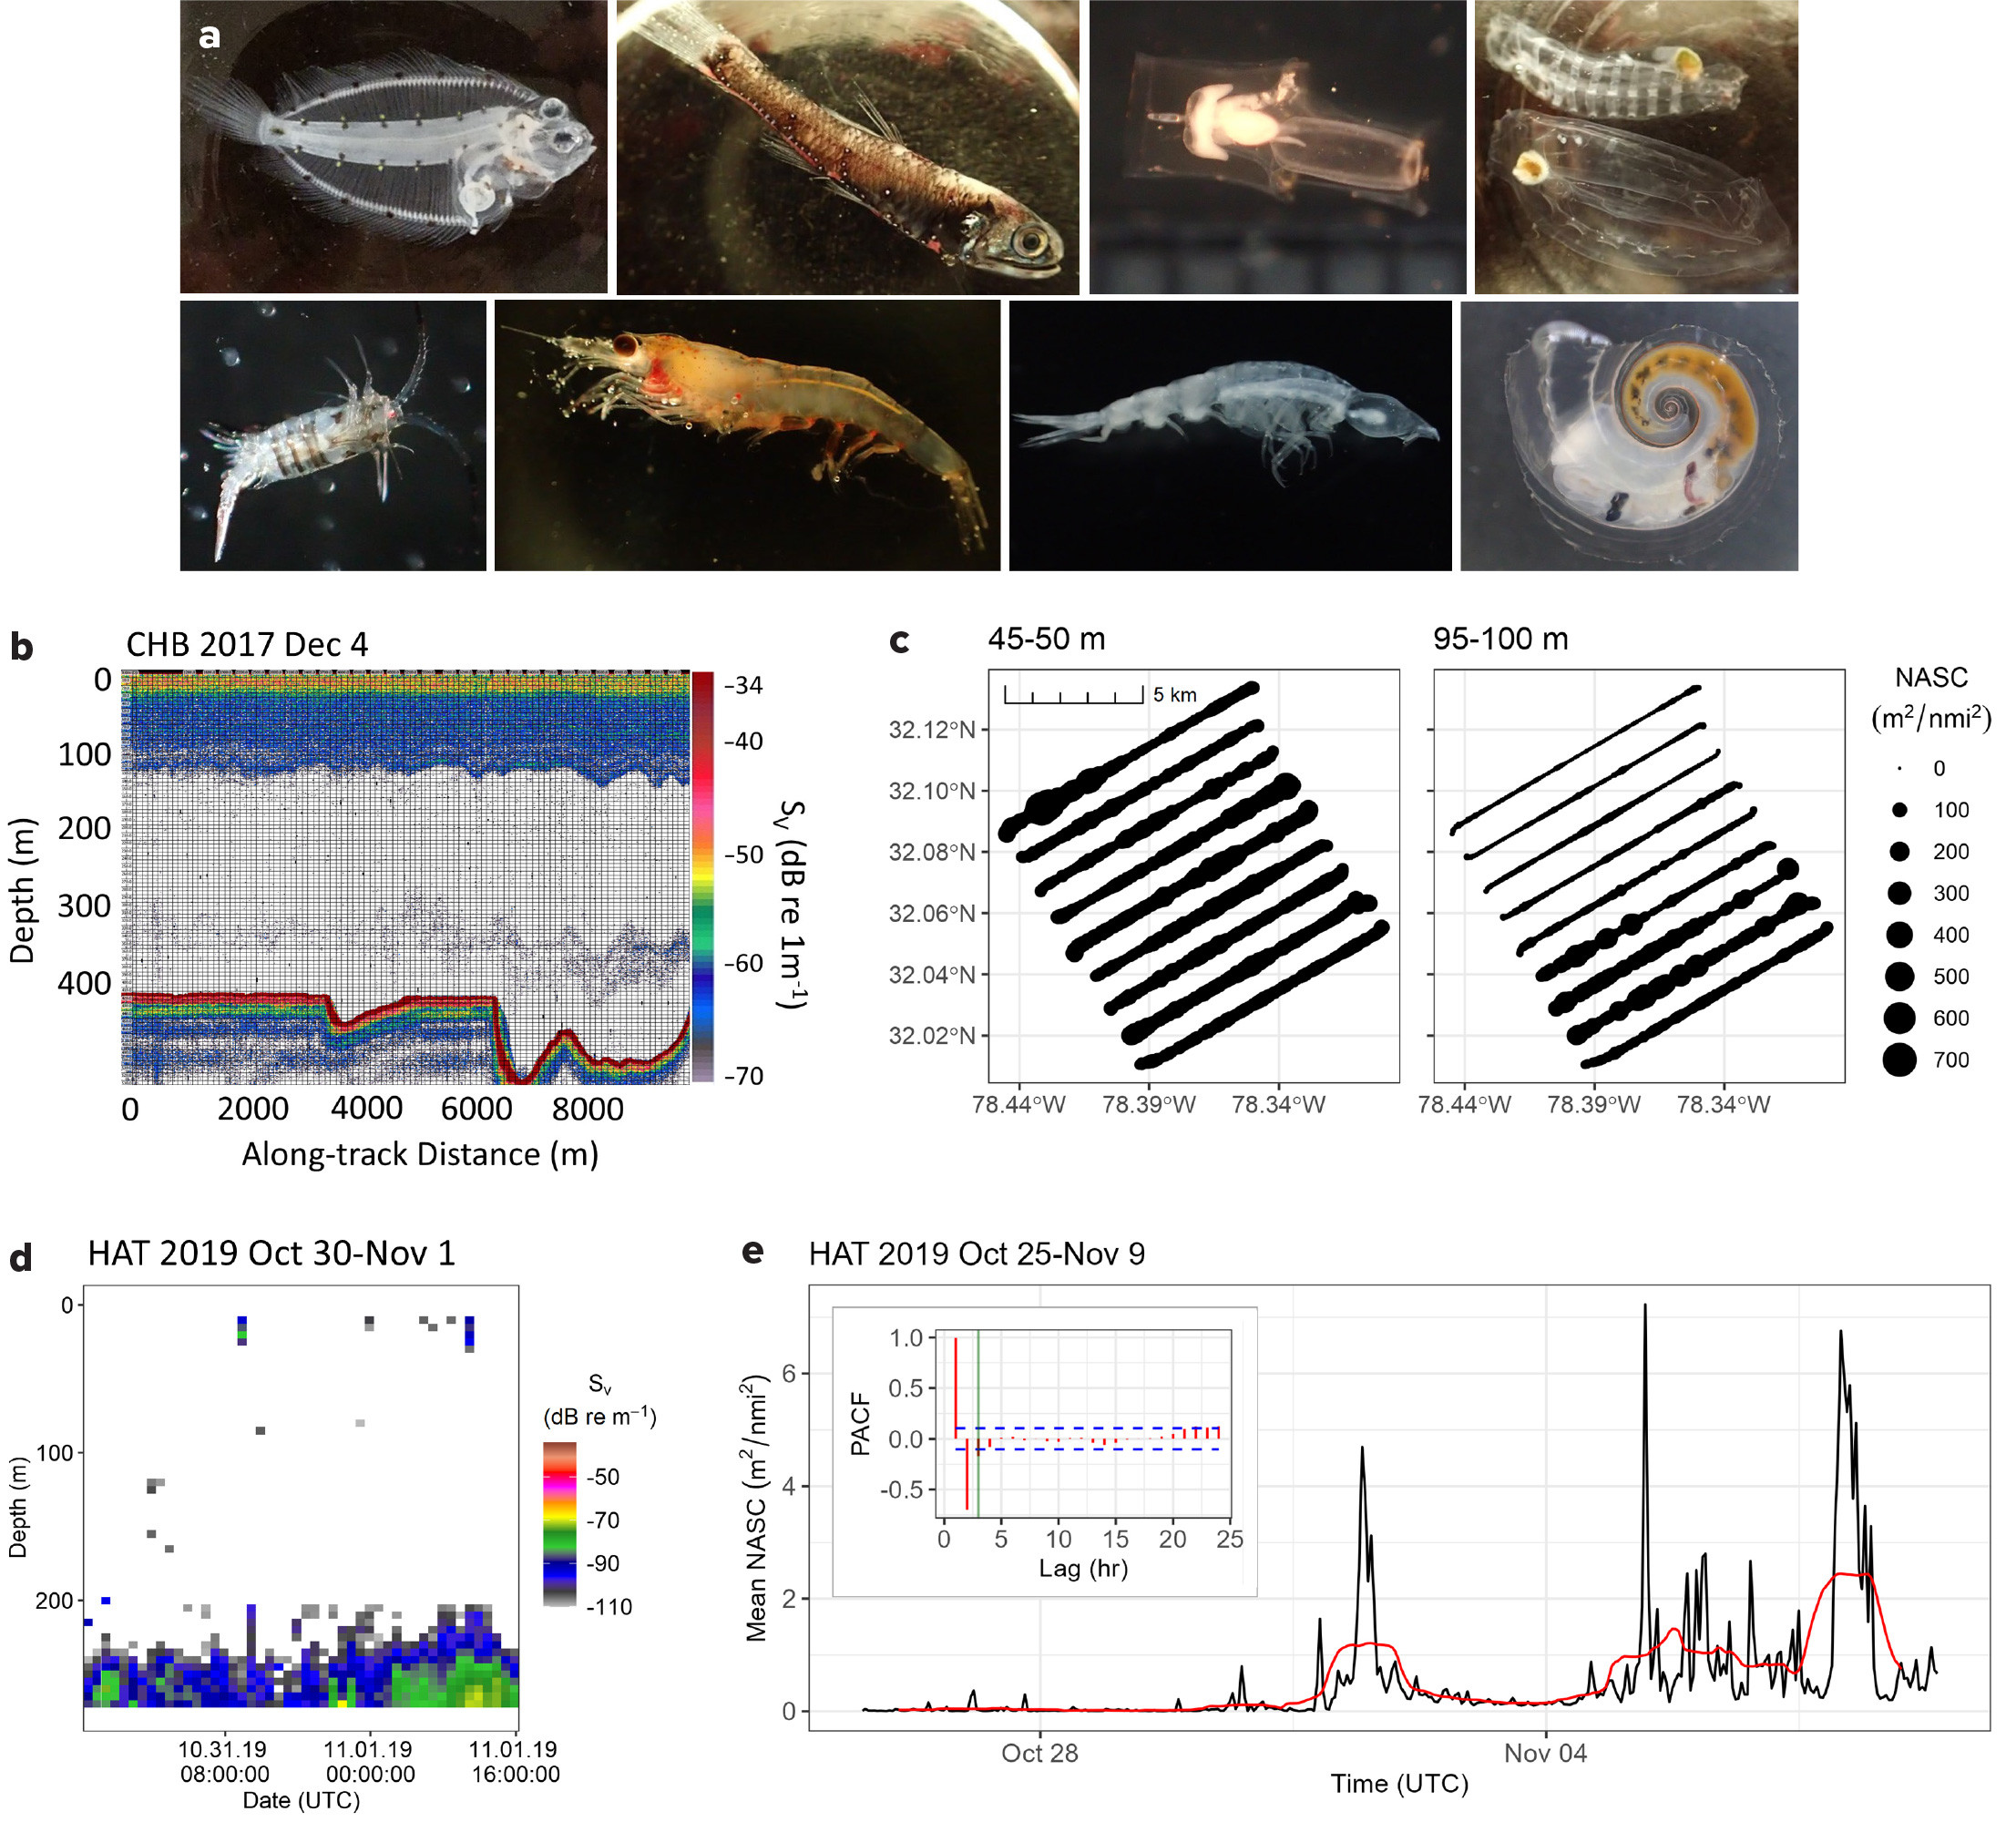
FIGURE 4. Net tows collected samples of the fish and zooplankton at each site. (a) Top row: flatfish larva, adult myctophid, siphonophore, salps. Bottom row: copepod, krill, amphipod, pteropod. Aggregations of these animals in the water column are visible as backscattering layers in echograms of acoustic transects. (b) Fine-scale acoustic surveys (FSASs) measured biological backscatter data in a grid of parallel transects covering an area up to 100 km2 centered on the lander location. (c) Spatial heterogeneity was assessed using the nautical area scattering coefficient (NASC, an acoustic measure proportionate to biomass; NASC = 4 pi × 18,522 × area backscattering coefficient in m2/nmi2), integrated as cells 100 m across and 5 m deep (b, c: Blair et al., 2021). The example transect (b) and FSAS 5 m depth layers (c) were collected at the CHB site the night of December 4, 2017 (UTC). (d) Stationary backscatter collected at VAC, HAT, and JAX landers (example echogram is two days at hourly resolution from HAT) were compared to FSASs for the two-week period centered in time on that FSAS date. (e) The two-week time series (black line) was decomposed to the underlying trend component (red line) for which the partial autocorrelation function (PACF) was calculated (inset). The autoregressive process order defining the temporal autocorrelation of the time series (inset, green line) was divided by the mean current velocity collected during FSASs surrounding the stationary echosounder location to calculate a distance estimate that could be compared with FSAS spatial autocorrelation estimates. > High res figure
|
The spatial characteristics of epi- and mesopelagic scattering layers are rarely measured in the horizontal dimension, yet they are imperative information for the design and implementation of monitoring and management programs for pelagic ecosystems (Horne and Jacques, 2018). These findings demonstrate the importance of considering scale when designing active acoustics monitoring networks and sampling protocols. Comparing scales of space and time in the dynamic ocean is a nontrivial task, and it remains unknown whether the characteristics measured along the US eastern continental shelf are representative of shelf-slope environments in other regions.
Acoustic Propagation Modeling
Soundscape modeling is among a number of considerations used for policy decisions related to ocean sound. It is important to know the performance accuracy of soundscape models (Heaney et al., 2024), and measurements from the ADEON project are extremely valuable for this purpose. For the acoustic modeling component of ADEON, a wind and shipping soundscape model was developed for the Atlantic OCS. This permitted evaluation of the spatial and temporal distributions of the soundscape beyond the data collected at the lander locations. Acoustic propagation in the ocean is sensitive to temperature and salinity fields, bathymetry, seafloor sediment type, and sea surface roughness (a function of wind speed) (Jensen et al., 2011). The soundscape modeling approach consisted of three steps: (1) identify the distributions of sources contributing to sound in the region and collect the relevant environmental information, (2) compute the acoustic propagation loss from all sources to all receiver positions, and (3) sum the contributions and compute the SPL.
The regional SPL was computed for the years 2018, 2019, and 2020 for decidecade bands centered at 20, 50, 100, 200, and 400 Hz. A single snapshot and a monthly average of the SPL for 50 Hz at the seafloor is shown in Figure 5 panels a and b, respectively. The temporal observation window was three hours for 2018 and 2020 and 10 minutes for 2019. The 2019 model was generated first, and the 10-minute temporal observation window proved computationally expensive with an extensive storage requirement; thus, the observation windows for 2018 and 2020 were expanded to three hours. This massive modeling product dataset is served to the public on the ADEON website (https://ADEON.unh.edu) as explained in the visualization section below. One observation of this modeling study was that the SPL on the seafloor was often 3 dB higher than that at 10 m depth, due to the downward refraction of shipping sound (Heaney et al., 2024).
The wind and shipping sound levels for each of the lander positions were computed with a higher resolution time observation window of five minutes. Sediment uncertainty, oceanographic variability, and shipping source depth and level uncertainties were incorporated using a Monte Carlo framework. The sediment uncertainty drives the modeled SPL, permitting an estimate of the local sediment characteristics when compared with the observed data. Figure 5c shows the modeled 125 Hz decidecade band SPL (5th, 50th, and 95th percentiles) along with the measurements for the WIL site for the first week of January 2019. The percentiles relate to the weekly mean SPL distribution across the sediment types. The data match the 5th percentile model across the ensemble with only a few passing ships above the wind noise floor. The comparison of the SPLs using the best sediment value for BLE (sediment grain size parameter, phi = 5.68) is shown in Figure 5d. The short time duration peaks are nearby passing surface ships, and the slowly varying low SPL regions are wind levels. The differences between the two sites can be attributed to the number of passing ships and the sediment (WIL having more ships and sediment with higher acoustic impedance, and BLE having both fewer ships and lower impedance sediment).
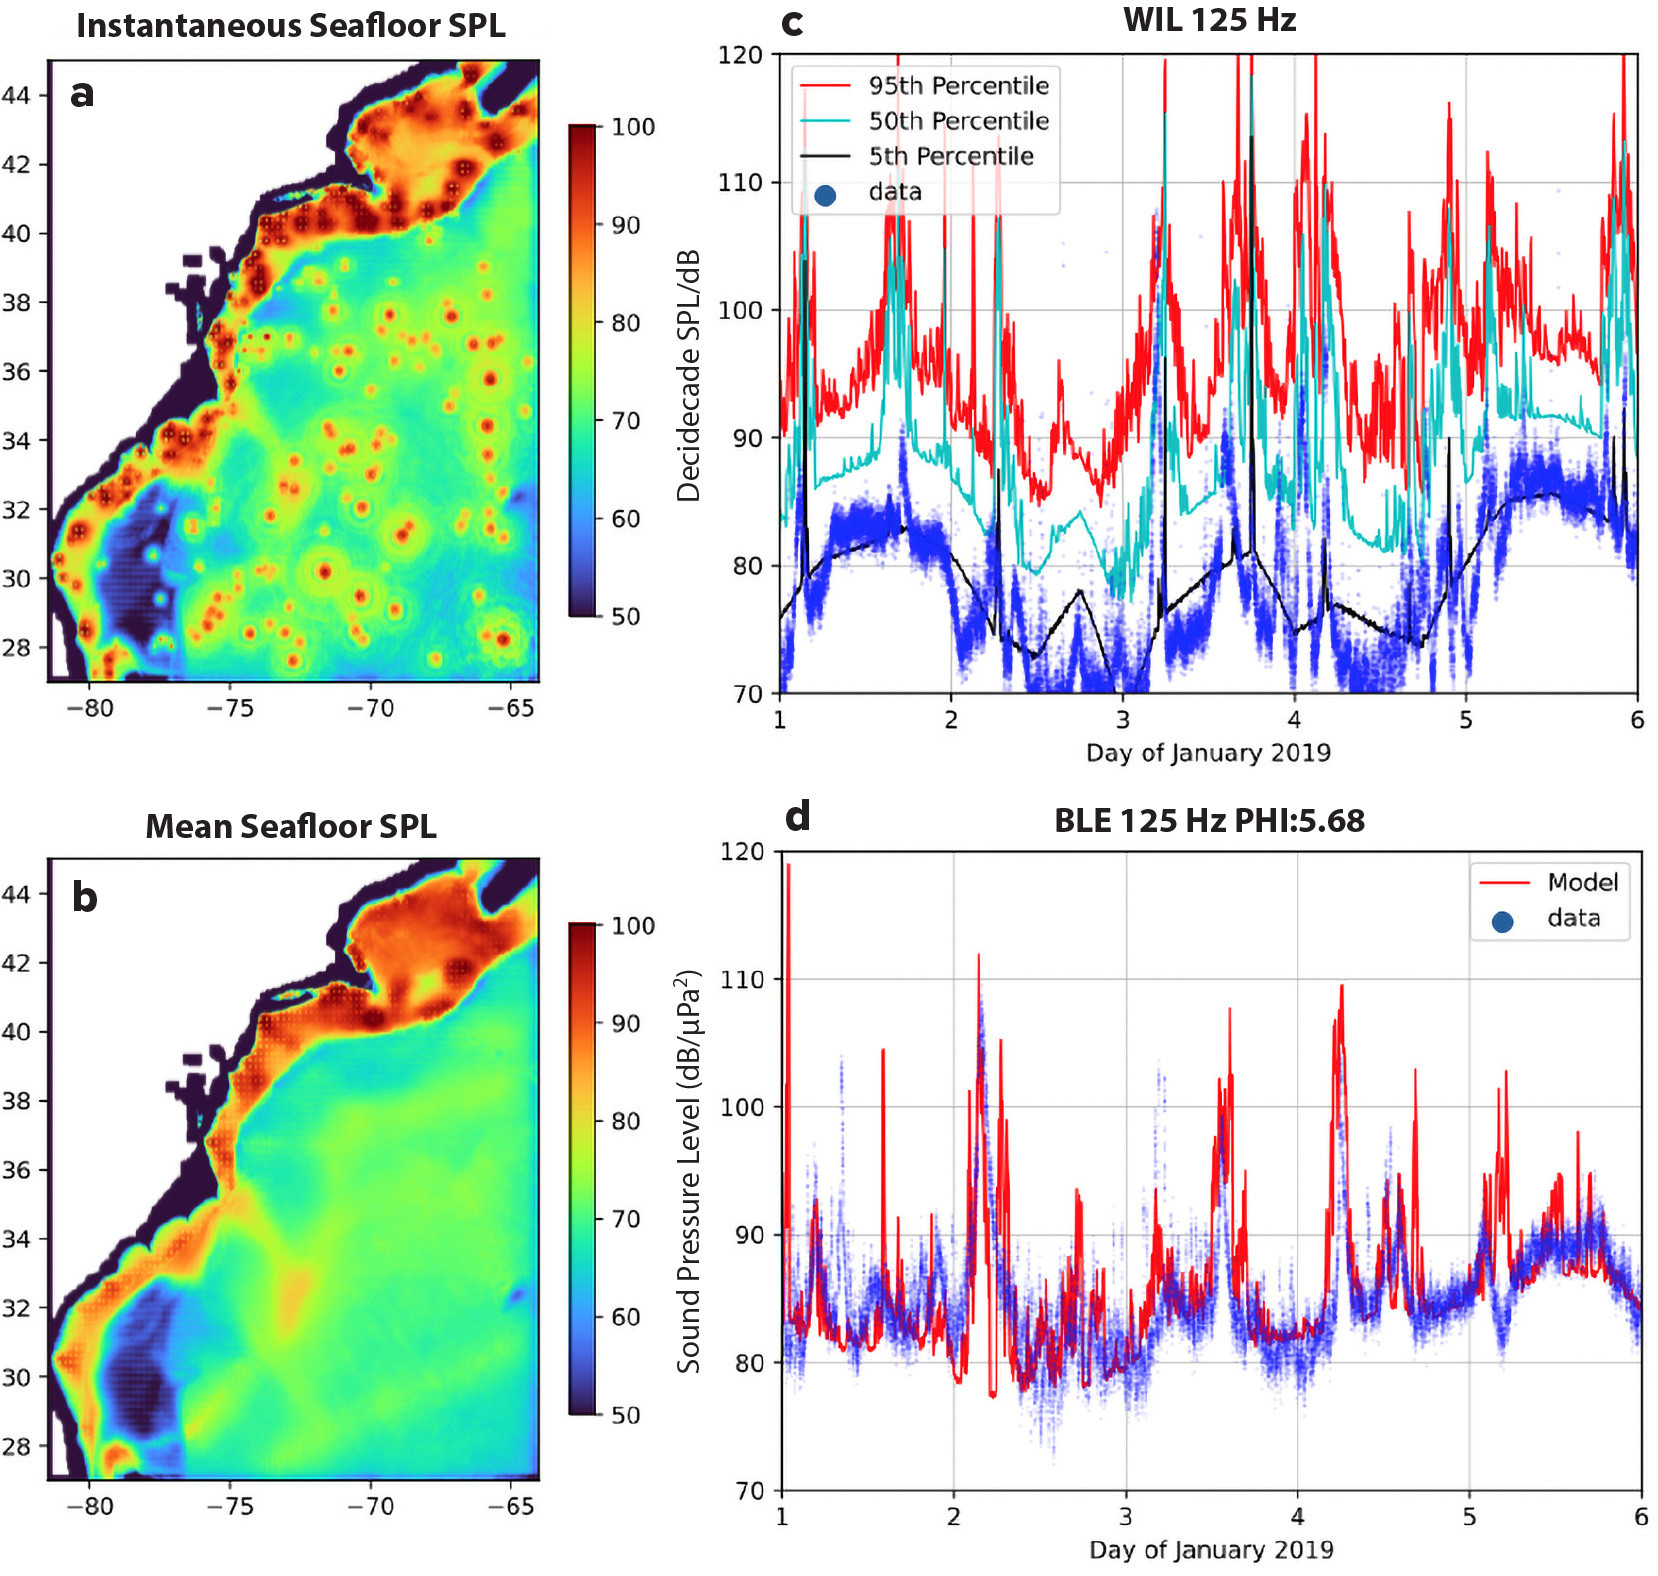
FIGURE 5. (a) Single time snapshot of the modeled 125 Hz decidecade band sound pressure levels (SPL), combined wind and ship SPL (in dB) at the seafloor for the Atlantic OCS for January 3, 2019. (b) Month averaged 125 Hz decidecade band SPL (in dB), combined = wind and ship SPL soundscape model at the seafloor. (c) Wilmington (WIL) measured SPL (blue dots) and 5th, 50th, and 95th percentile modeled SPL for the first week of January 2019, 125 Hz decidecade SPL. (d) Blake Escarpment (BLE) measured SPL (blue dots) and modeled SPL with sediment grain size parameter (PHI) 5.68 for the first week of January 2019, 125 Hz decidecade SPL. The integer tick marks in (c) and (d) are at midnight UTC. The time axis starts at 00:00 on January 1, 2019. The reference sound pressure is 1 µPa. > High res figure
|
Ecosystem Modeling
The ADEON ecological modeling component focused first on describing the temporal abundance patterns of marine mammals across the entire study region (Figure 6a). This information was then used to quantify the variability in marine mammal distribution via call density as it related to changing oceanographic conditions. Both the diversity in calling marine mammals as well as the species-specific detection rates were analyzed concurrent with the lander and remotely sensed oceanographic parameters. Predictive models were built using species-specific call density as the response variable to identify persistent areas of high trophic transfer or biodiversity in the ADEON study site (Figure 6b). Ongoing analysis is examining how changes in abundance and distribution of the forage assemblage varies relative to warm/poor and cool/good productivity years off the US East Coast using taxon-specific community assemblage metrics from the lander multi-frequency echosounder systems (Figure 6c). These data can be used to examine regional and seasonal differences in marine mammal species-environment relationships. Subsequently, estimates of the acoustic community structure, for example, time series of different size classes from acoustic backscatter data, can be compared to the ecological modeling results to gain a better understanding of the relationship between potential prey species and marine mammal predators to further enhance the use of acoustic prey data as an ecological monitoring tool. Acoustically inferred prey community structure and biomass, in addition to surface and at-depth measurements of physical water column features, can be coupled with acoustic detections of marine mammals to better inform the fine-scale response of top predators, initiating a more complete understanding of ecosystem structure and ecosystem changes.

FIGURE 6. (a) Ecosystem modeling framework. (b) Example of a daily spatial prediction of relative fin whale call density on September 7, 2018, using preliminary fitted relationships from a generalized additive model. (c) Acoustic backscatter can be apportioned to different taxonomic or size classes of scatterers (i.e., NRS and RS, non-resonant and resonant scatterers respectively; medium NRS at 125 kHz [10–25 mm], large NRS at 125 kHz [25–122 mm], small RS at 38 kHz indicative of small swim-bladdered fish, and large RS at 38 kHz indicative of larger swim-bladdered fish based on animal total length; Miksis-Olds et al., 2021). These parameters (representing the abundance or biomass of different types of zooplankton or fish) can then be used as model input parameters to determine relationships between prey abundance and marine mammal predator presence or vocal behavior. These are the time series of size classes from the HAT lander. > High res figure
|
EVOLVING THE ADEON COMMUNITY
The terabytes of acoustic and oceanographic data acquired in ADEON are valuable in their own right as a baseline characterization of the Mid- and South Atlantic OCS, but their value will continue to increase through the use of the data in ecological and soundscape modeling to support future predictions and scenarios as environmental conditions change. Innovative development of online visualization tools to explore ADEON’s integration of acoustic observations, soundscape modeling, environmental parameters, visual surveys, and remote sensing (https://adeon.unh.edu/map) promotes the use of ADEON data beyond the program end. These tools assist in creating value-added products so that the information is used as widely as possible.
While all ADEON recordings are publicly available for download, most researchers lack the 116 TB required to store the audio files, and interested parties may not have access to nor the training required for using audio analysis software. To aid researchers and the public in exploring the ADEON datasets, an integrated suite of web-based visualization tools was created. The visualization portal page opens with a map that shows ADEON lander locations surrounded by marine mammal sightings from the project’s cruises (Figure 7a). Animations that can be viewed on the main map allow the site visitor to play back years of soundscape modeling data, showing predicted contributions from wind and AIS-tracked ships. Additional contextual layers can be displayed that show environmental data collected from remote satellite sources, such as chlorophyll concentrations from NASA and surface temperatures from NOAA’s RTOFS model, to explore meaningful relationships among the parameters. Selecting a lander icon on the map opens an interface with details on the lander and shows tabs for accessing lander-specific data visualizations.
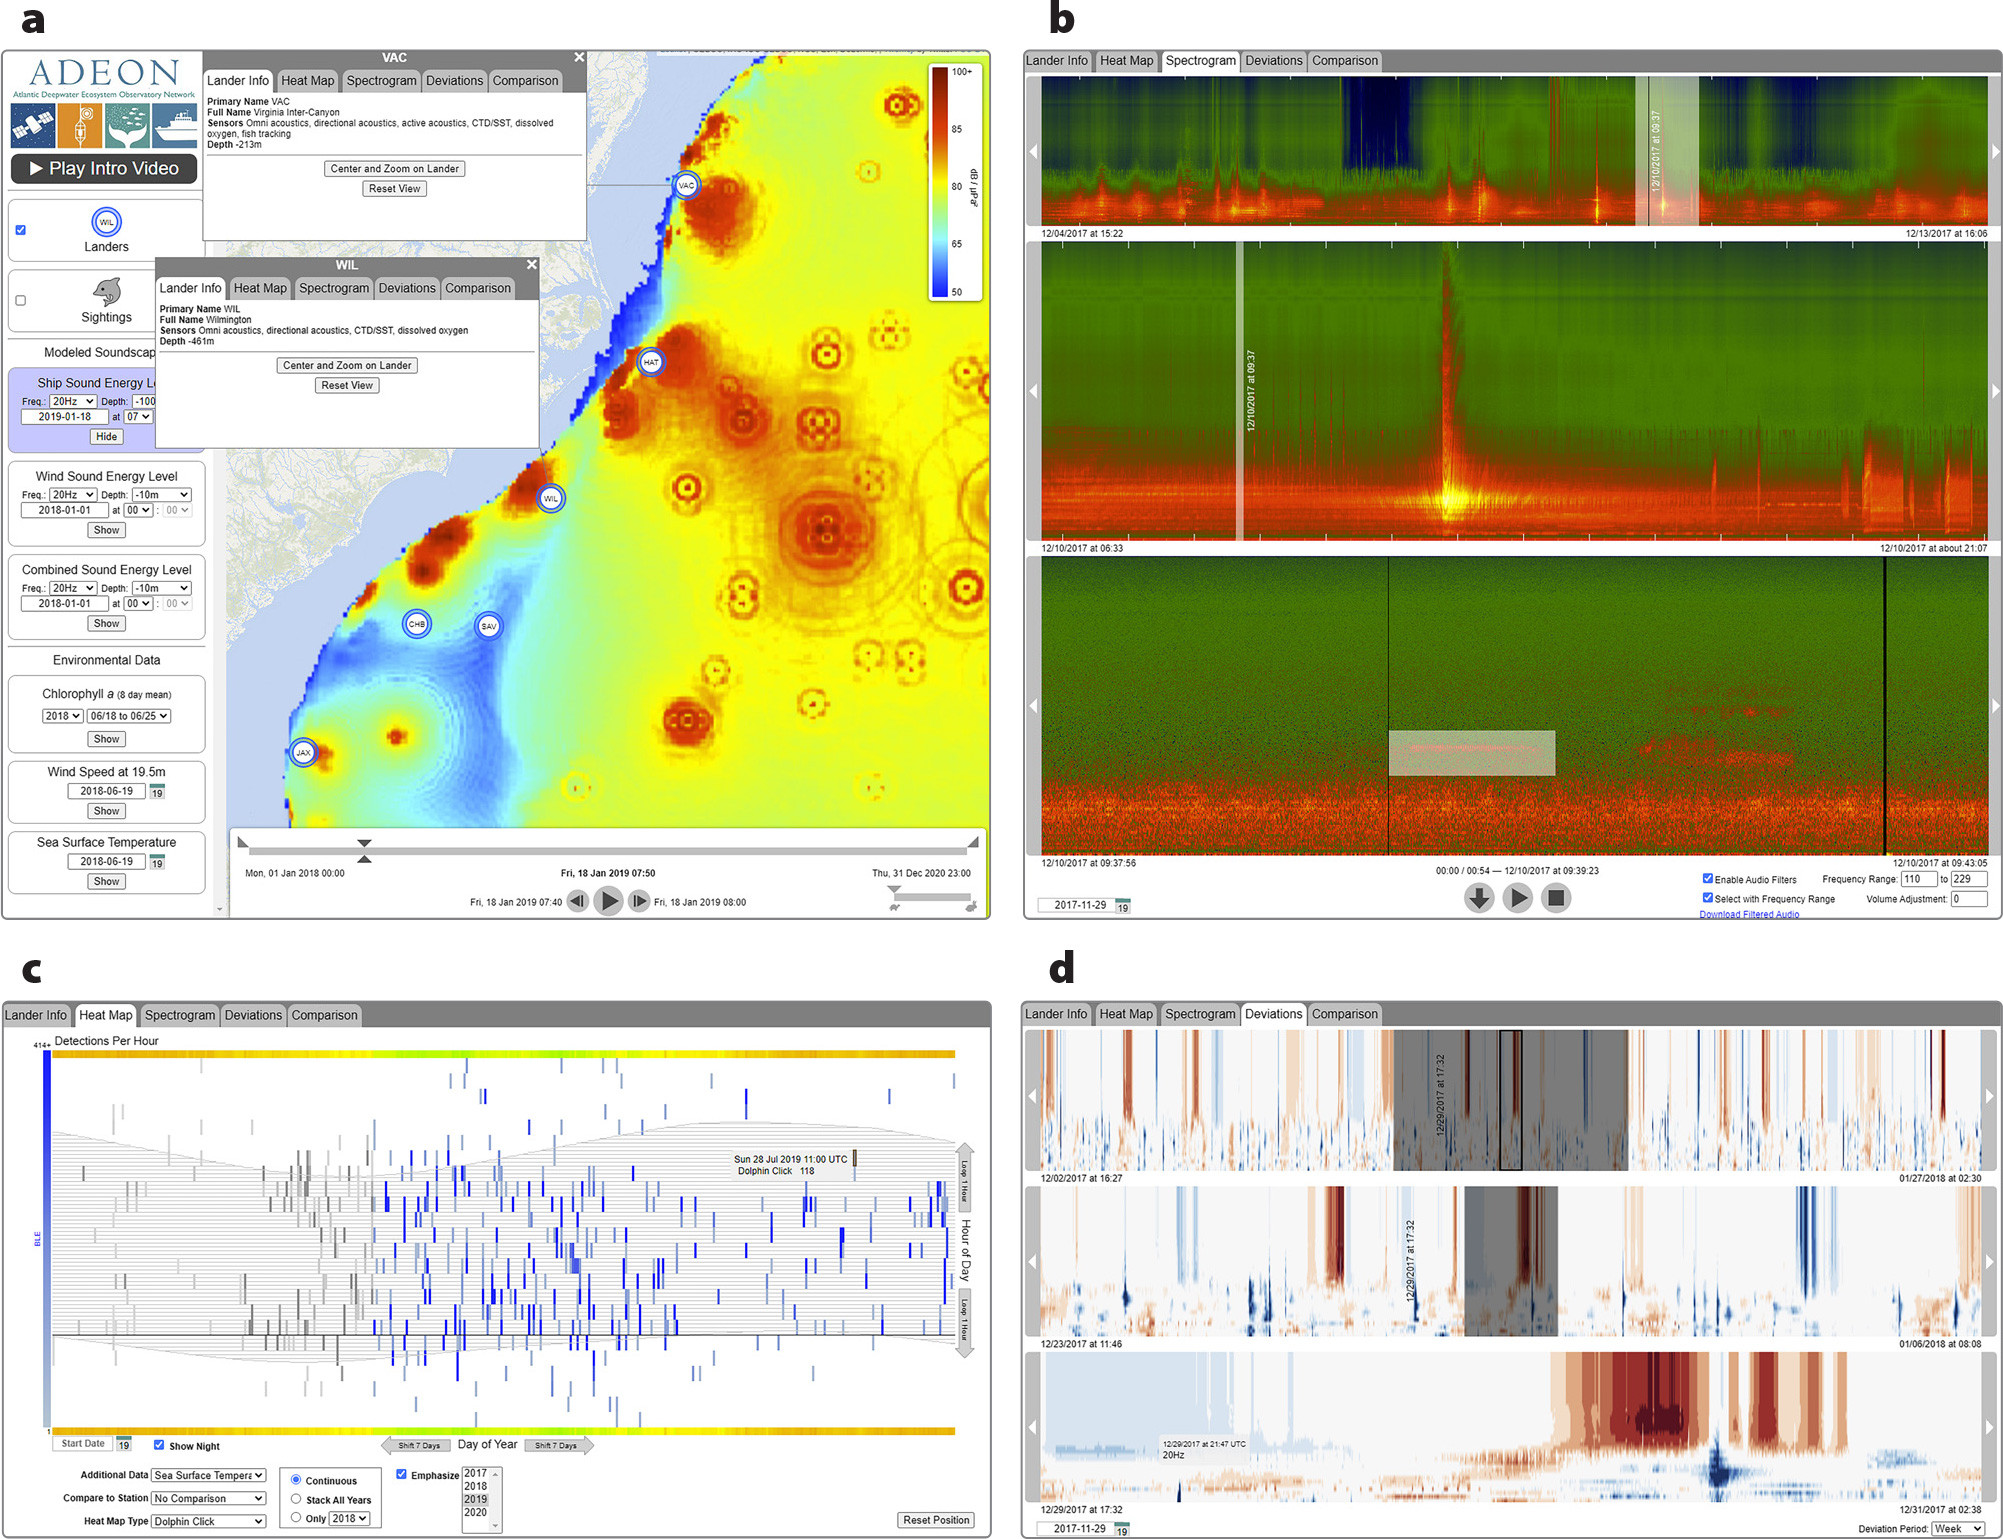
FIGURE 7. The ADEON visualization suite allows users to explore the overlap of regional acoustic measurements, modeling, and remote sensing. (a) Main map interface, showing ADEON regional area, modeled ship noise contribution to soundscape, lander locations, and probe interface windows opened for two landers. Users can select from multiple environmental overlays in the interface window. (b) Tri-level spectrogram viewer interface showing an approximate week (top), day (middle), and hour (bottom). The different time scales highlight specific sources contributing to the soundscape. A vessel passage is captured in the day scale, and a selected whale call is highlighted at the hourly level for user playback and download. (c) Event detection heatmap interface, showing cyclic visualization of dolphin click events over multiple years stacked on top of each other, with a concentration during the nighttime hours, and contributions from a single year highlighted. The colored sea surface temperature (SST) data are time aligned with the marine mammal detections. (d) Deviations viewer, showing times and frequency ranges where it was unusually quiet or loud based on analysis by adjustable-duration moving window. > High res figure
|
An important visualization is the tri-level spectrogram, which presents the acoustic recordings from a lander in an easy-to-use exploratory interface (Figure 7b). Using a color scale perceptually optimized to highlight marine mammal sounds, spectrograms are pre-processed into image files sufficiently compressed to be loaded faster than users can scroll, allowing for seamless exploration. The top level of the spectrogram viewer displays weeks to months of audio (depending on monitor resolution) and allows users to quickly peruse the entire dataset, see trends, and spot major events. The middle level shows roughly a day of spectrogram data, while the bottom level shows a few minutes at full resolution. The levels are linked, so clicking on one level centers the other levels around the same time. Selections can be made in the lower-level view, allowing in-browser playback or download of sound files from specific time ranges, with options to select and filter by frequency.
An event viewer presents marine mammal detections in an interactive heatmap (Figure 7c). Users select an event type (e.g., dolphin click) and view a plot of detected events over the entire project duration. Alternatively, all years can be stacked to produce a cyclic visualization that reveals repeated seasonal patterns, with an option to interactively emphasize contributions from each year. The heatmap can be shifted in direction to center patterns. Clicking on individual heatmap cells switches over to the spectrogram viewer, which jumps to the correlating timestamp. Additional context is provided via a day/night indicator band and environmental data plots (e.g., chlorophyll). A second lander can be selected to perform direct comparisons within a single heatmap (using multiple colors).
Finally, the deviations viewer presents a similar tri-level interface, but instead of spectrograms, it displays times and frequency ranges in which the soundscape was unusually loud or quiet, based on a weekly, monthly, or quarterly moving window analysis (Figure 7d). For the data displayed in the viewer, recordings were processed into 60-second, decidecade frequency bins. Running means and standard deviations were calculated for each window length, and the number of standard deviations above or below the running mean was mapped to a diverging blue-white-red heatmap. See Butkiewicz et al. (2021) for additional details. Since project completion, the visualization interface has been successfully used by the public as indicated by the project webpage visitor log, and it provides a valuable tool to other researchers for studying a wide range of topics from marine mammal behavior to extracting training data for AI/ML detection applications.
SUMMARY
The ADEON team designed and deployed an ocean acoustics observation network on the US OCS between Virginia and Florida from November 2017 to December 2020. The multi-platform network acquired soundscape, acoustic backscatter, oceanographic, and space-based remote sensing data that supported high-resolution time series analysis, soundscape modeling, and ecological modeling to better understand ecosystem dynamics and human use in an under-sampled region. The development of the ALTO lander during the ADEON program has successfully demonstrated its utility for translocation to numerous other national and international monitoring efforts. ADEON standardization and visualization products are now being used globally to explore and compare acoustic datasets acquired in different geographical regions and with different hardware systems. Our results indicated that marine mammal use of the OCS is more complex than previously documented. Beaked whale species were observed to exhibit site fidelity along the OCS, and the offshore area of the Blake Plateau was identified as a hotspot for minke whales during the mating season. Advances in soundscape modeling illustrated that the presence of individual ships significantly impacts the measured and modeled soundscape across the OCS and that acoustic energy is greater at the seafloor compared to the surface in the ADEON region. Continuous measures of predator foraging activity and prey biomass and distribution across multiple years is rare outside of a coastal setting and has proven valuable for predictive modeling of predator presence in changing environmental conditions. Lastly, the partnerships established during the ADEON program, including the artist-at-sea program, positive interactions with commercial fisherman, and collaboration with the Ocean Tracking Network and NOAA’s National Centers for Environmental Information (NCEI), continue to highlight the value of ocean acoustics, marine science, and scientific research to society.
ACKNOWLEDGMENTS
We gratefully acknowledge funding provided by the US Department of the Interior, Bureau of Ocean Energy Management, Environmental Studies Program under contract Number M16PC00003, in partnership with other NOPP funding agencies. Funding for ship time was provided under separate contracts by ONR, Code 32. Thanks to all of the ADEON team at JASCO who contributed to the fieldwork and analysis over the program lifetime. Carmen Lawrence and Jack Hennessey contributed to Figure 1. Colleen Wilson assisted with Figure 2 and Figure 3. This program would not have been possible without the dedicated support of John Macri (UNH), Terry Ridgeway (UNH), Tim Moore (FAU), Ilya Atkin (UNH), and the many students, volunteers, ROV Jason crew, and captains/vessel crews of R/V Neil Armstrong and R/V Endeavor.

