Full Text
MARINE HEATWAVES THREATEN MARINE ECOSYSTEMS
As the ocean has warmed, in recent decades marine heatwaves (MHWs) have emerged as a major threat to marine ecosystems and ecosystem services, presenting challenges for management of marine fisheries, aquaculture, tourism, and conservation, including for marine protected areas (MPAs). An MHW is a period of unusually high ocean temperatures, often defined as ocean temperatures that are warmer than 90% of the previous observations for a given time of year. MHWs along Australia’s coastal regions have led to mass coral bleaching on the Great Barrier Reef, damage to kelp forests and seagrass meadows in Western Australia, shifts in species, and fish and invertebrate mortality, all creating pressures on fisheries management (as reviewed in Smith et al., 2023). Understanding how climate change influences ocean extremes and impacts societal and natural values is key for evaluating future risks. Growing concerns around the effects of MHWs on marine industries, food security, ecosystem dynamics, and conservation efforts led to the development of MHW response plans for Tasmania and New South Wales during the summer of 2023/24 (Hobday et al., 2024).
While satellite sea surface temperature (SST) products reveal an MHW’s surface expression, its subsurface structure remains unknown without in situ monitoring. The ability to investigate subsurface properties in near-real time is critical for understanding MHWs’ impacts on vulnerable habitats and species and can support evidence-based decision-making.
EVENT BASED SAMPLING: A NATIONAL INITIATIVE
Ocean gliders are agile instruments that can be deployed relatively easily to transmit data in near-real time. Gliders measure a range of subsurface oceanographic variables, including water temperature and salinity, and other data important for characterizing the marine environment, such as chlorophyll fluorescence as an estimate of phytoplankton biomass, and light, which is important for photosynthesis. Since 2007, Australia’s Integrated Marine Observing System (IMOS) Ocean Gliders Facility has repeatedly conducted routine missions in specific regions around Australia (Pattiaratchi et al., 2017). Since December 2018, when IMOS enabled an Event Based Sampling program, glider missions have rapidly responded to and sampled emerging MHWs over the Australian continental shelf, creating a step change in our capacity to understand the dynamics and impacts of MHWs on marine ecosystems.
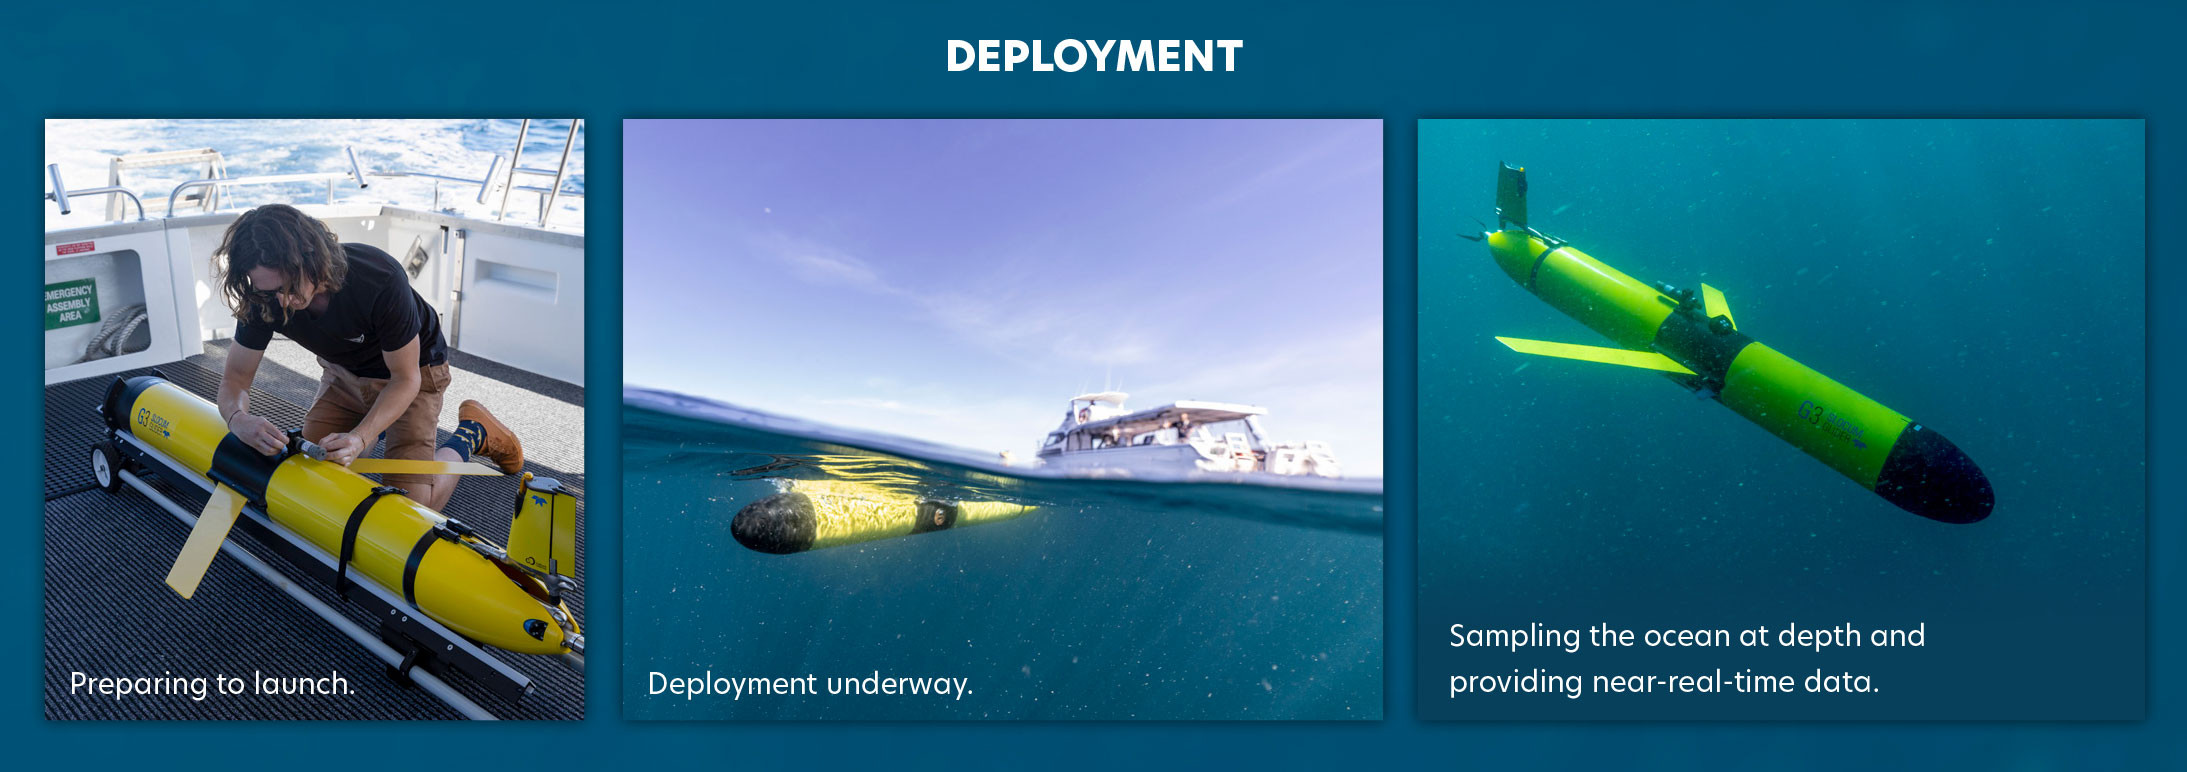
Sampling extreme events is challenging, as their occurrence is rare and somewhat unpredictable. A nationally coordinated strategy guides the selection of glider missions to target MHW events during their growth, peak, and decay phases. A national advisory committee composed of experts from universities, government and science institutions, and stakeholders, including marine park managers, meets every one to two months. The committee reviews risk criteria on emerging MHWs (Figure 1), such as current SST observations and seasonal forecasts, to determine how conditions are likely to change (Smith and Spillman, 2024). Based on available evidence, deployment locations are prioritized according to an event’s severity and duration, likely impacts, consequences for decision-makers, and technical feasibility as well as the availability of existing observations and models for analyzing the event.
|
FIGURE 1. The steps are shown here for planning an Event Based Sampling glider mission, deploying a glider, and providing the resulting data to researchers, marine managers, industry, and the broader community. Photo credits: Nick Thake > High res figure |
Once an emerging MHW has been identified, gliders can be deployed within one to three weeks in most areas around Australia. A glider mission typically lasts for three to four weeks and can be redeployed rapidly if required. Near-real-time data are openly available through the IMOS Australian Ocean Data Network Portal and visualized at the IMOS Ocean Gliders Facility website and the IMOS OceanCurrent glider website, allowing direct access to the latest information on an MHW’s subsurface characteristics. Using their links to different sectors, the multi-partner national committee disseminates the glider mission’s status and findings to stakeholders and data users.
REVEALING SUBSURFACE MARINE HEATWAVES
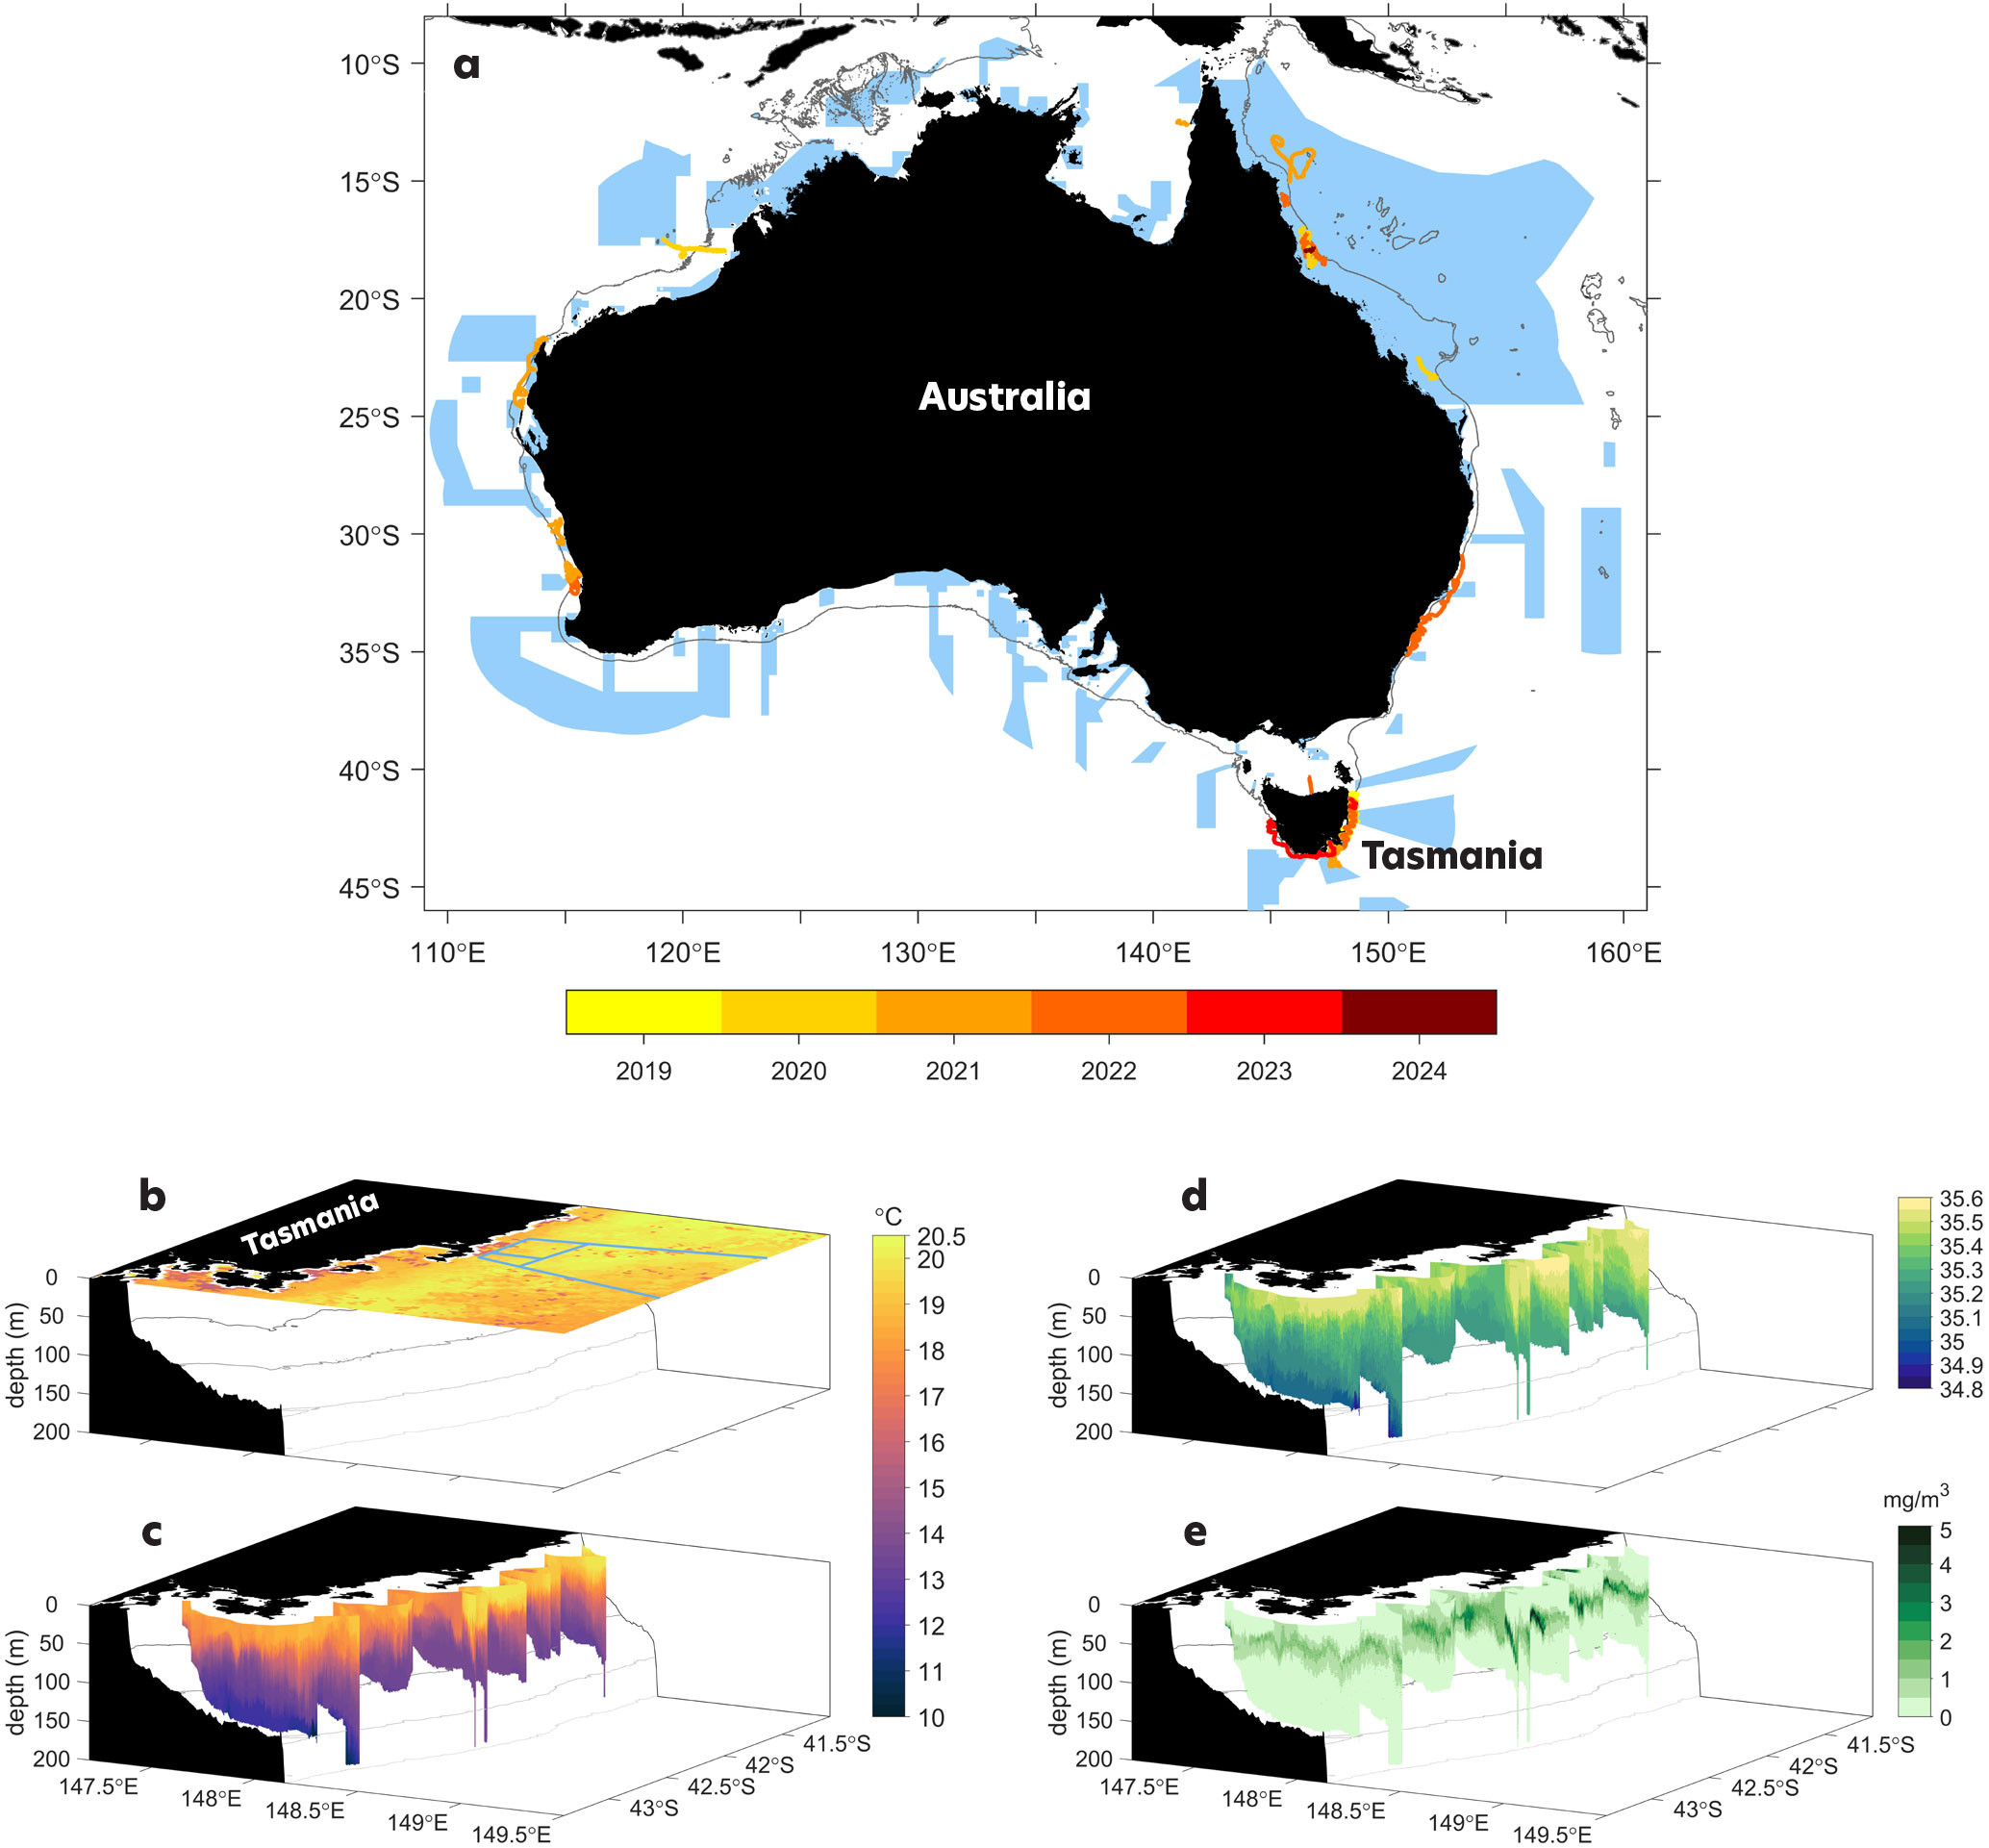
MHWs can span hundreds to thousands of kilometers along the continental shelf and last from weeks to months. Hence, understanding the physical processes that underpin their occurrences, depths, and influence on other biophysical variables is necessary for assessing the risks they pose to marine systems and MPAs, thereby aiding in effective management and conservation. The IMOS Event Based Sampling program has deployed 15 glider missions targeting MHWs, one for a tropical cyclone and one for a cold eddy that occurred post-tropical cyclone (Figure 2a). Since 2019, an additional 11 routine glider missions have sampled MHWs, and they have been instrumental in capturing an MHW generation phase, and 24 missions total have intersected MPAs (Figure 2a).
Repeat glider missions have been conducted off Tasmania, as this region’s long-term warming trend has been associated with long-lasting and intense MHWs (Kajtar et al., 2021). During summer 2022, in response to an MHW off Tasmania’s east coast, a glider mission revealed the vertical extent of extremely warm temperatures (Figure 2c) beyond those observed at the sea surface by satellite remote sensing (Figure 2b). The high salinity signature of warm water (Figure 2d) was indicative of the East Australian Current extension flowing southward through Freycinet Marine Park. A deep chlorophyll maximum was observed from fluorescence measurements (Figure 2e). MHWs can occur in this region due to enhanced and deep poleward movement of heat from an intensified East Australian Current extension or enhanced air-sea heat flux. During the warmest months of the year, near-real-time subsurface data from gliders can be useful for detecting southward shifts in waters that likely influence marine species unable to cope with poleward relocation. A 2019 mission highlighted a larger-scale MHW offshore and cooler coastal waters that created a buffer zone for coastal resources and industries. The findings from these glider missions were communicated to representatives from the seafood industry so they could anticipate MHW conditions and potential impacts on this sector. During winter to spring, MHWs can cause harmful algal blooms, and regular communication with those conducting sampling has enhanced understanding of whether anomalously warm water conditions were causing such events.
|
|
Glider missions around the Great Barrier Reef have provided valuable near-real-time subsurface measurements during coral bleaching events. Mission locations were planned in collaboration with researchers enacting coral bleaching response plans and representatives from the Great Barrier Reef Marine Park Authority. As events unfolded, interpretations of the glider observations were communicated broadly to researchers and government agencies. In some cases, cooler waters were found to be present at depth in reef passages that connect the lagoon to the continental slope, offering corals and other organisms potential refugia from hot surface waters.
RESPONDING TO MARINE ECOSYSTEM CHALLENGES
To date, strategic sampling with IMOS glider deployments has captured ocean conditions associated with a diversity of MHWs to support marine research, management, industry, and the broader community. Event Based Sampling missions provided stakeholders with near-real-time subsurface data at high spatial and temporal resolution at critical times for understanding MHW persistence and biological impacts in coastal areas. The missions have offered opportunities to assess the impacts of MHWs on habitats and species while also improving our understanding of the ocean processes that drive their occurrence. They have helped to address the challenge of data scarcity, reducing uncertainties in characterizing these events in the subsurface where observations are limited but crucial for conservation and management decisions. Scientific data generated through these targeted missions have underpinned research advances that will potentially inform policy related to climate change and environmental adaptation (e.g., Hobday et al., 2024).
The integration of glider data with other near-real-time data streams through web platforms (e.g., IMOS OceanCurrent) offers a valuable one-stop source for stakeholders to monitor the development of extreme weather events in their regions of interest and increases public accessibility of available data. Ocean water temperature and salinity data from gliders are currently compared against coarse resolution climatologies, and work is underway to develop glider-derived subsurface climatologies over the continental shelf and improve understanding of subsurface MHWs. Furthermore, ocean glider measurements offer validation of high-resolution satellite observations in coastal areas and can detect fronts, where sharp changes in oceanographic variables occur and regular buoy data at fixed locations are not sufficient.
With projected changes to Australia’s climate, including rising ocean temperatures, increased tropical cyclone intensity, and extreme rainfall events and subsequent outflows, marine extremes are increasingly recognized as high-priority issues. Looking forward, the scope of IMOS Event Based Sampling will be broadened to monitor those extremes along with marine heatwaves and cold spells. Continued efforts will provide insights into how events affect MPAs, supporting assessment of their impacts on the marine environment, including habitat degradation and changes in species distribution and abundance, the food web, and biodiversity. Now, more than ever before, ocean gliders offer a powerful capability for rapid mobilization and near-real-time monitoring to respond to challenges in marine ecosystems and their management.


