Introduction
In 1751, the captain of an English slave-trading ship made a historic discovery. While sailing at 25°N in the subtropical North Atlantic Ocean, Captain Henry Ellis lowered a “bucket sea-gauge,” devised and provided to him by the British clergyman Reverend Stephen Hales, through the warm surface waters into the deep. By means of a long rope and a system of valves, water from various depths could be brought up to the deck where its temperature was read from a built-in thermometer. To his surprise, Captain Ellis found that the deep water was icy cold.
He reported his findings to Reverend Hales in a letter: “The cold increased regularly, in proportion to the depths, till it descended to 3900 feet: from whence the mercury in the thermometer came up at 53 degrees (Fahrenheit); and tho’ I afterwards sunk it to the depth of 5346 feet, that is a mile and 66 feet, it came up no lower.”
These were the first ever recorded temperature measurements of the deep ocean. They revealed what is now known to be a fundamental and striking physical feature of the world ocean: deep water is always cold. The warm waters of the tropics and subtropics are confined to a thin layer at the surface; the heat of the sun does not slowly warm the depths during centuries or millennia as might be expected.
Ellis’s letter to Hales suggests he had no inkling of the far-reaching significance of his discovery. He wrote: “This experiment, which seem’d at first but mere food for curiosity, became in the interim very useful to us. By its means we supplied our cold bath, and cooled our wines or water at pleasure; which is vastly agreeable to us in this burning climate” (Ellis, 1751).
In fact, Ellis had struck upon the first indication of the ocean’s overturning circulation, the system of deep ocean currents that circulates cold waters of polar origin around the planet.
But it was not until several decades later, in 1797, that another Englishman, Count Rumford, published a correct explanation for Ellis’s “useful” discovery: “It appears to be extremely difficult, if not quite impossible, to account for this degree of cold at the bottom of the sea in the torrid zone, on any other supposition than that of cold currents from the poles; and the utility of these currents in tempering the excessive heats of these climates is too evident to require any illustration” (Thompson, 1797).
Now, over 200 years later, we have a reasonable understanding of the complex system of deep ocean circulation and, what Rumford found so evident, the role it plays in climate. However, some major puzzles remain that may be of fundamental importance to our future.
Fifty Times the Human Energy Use
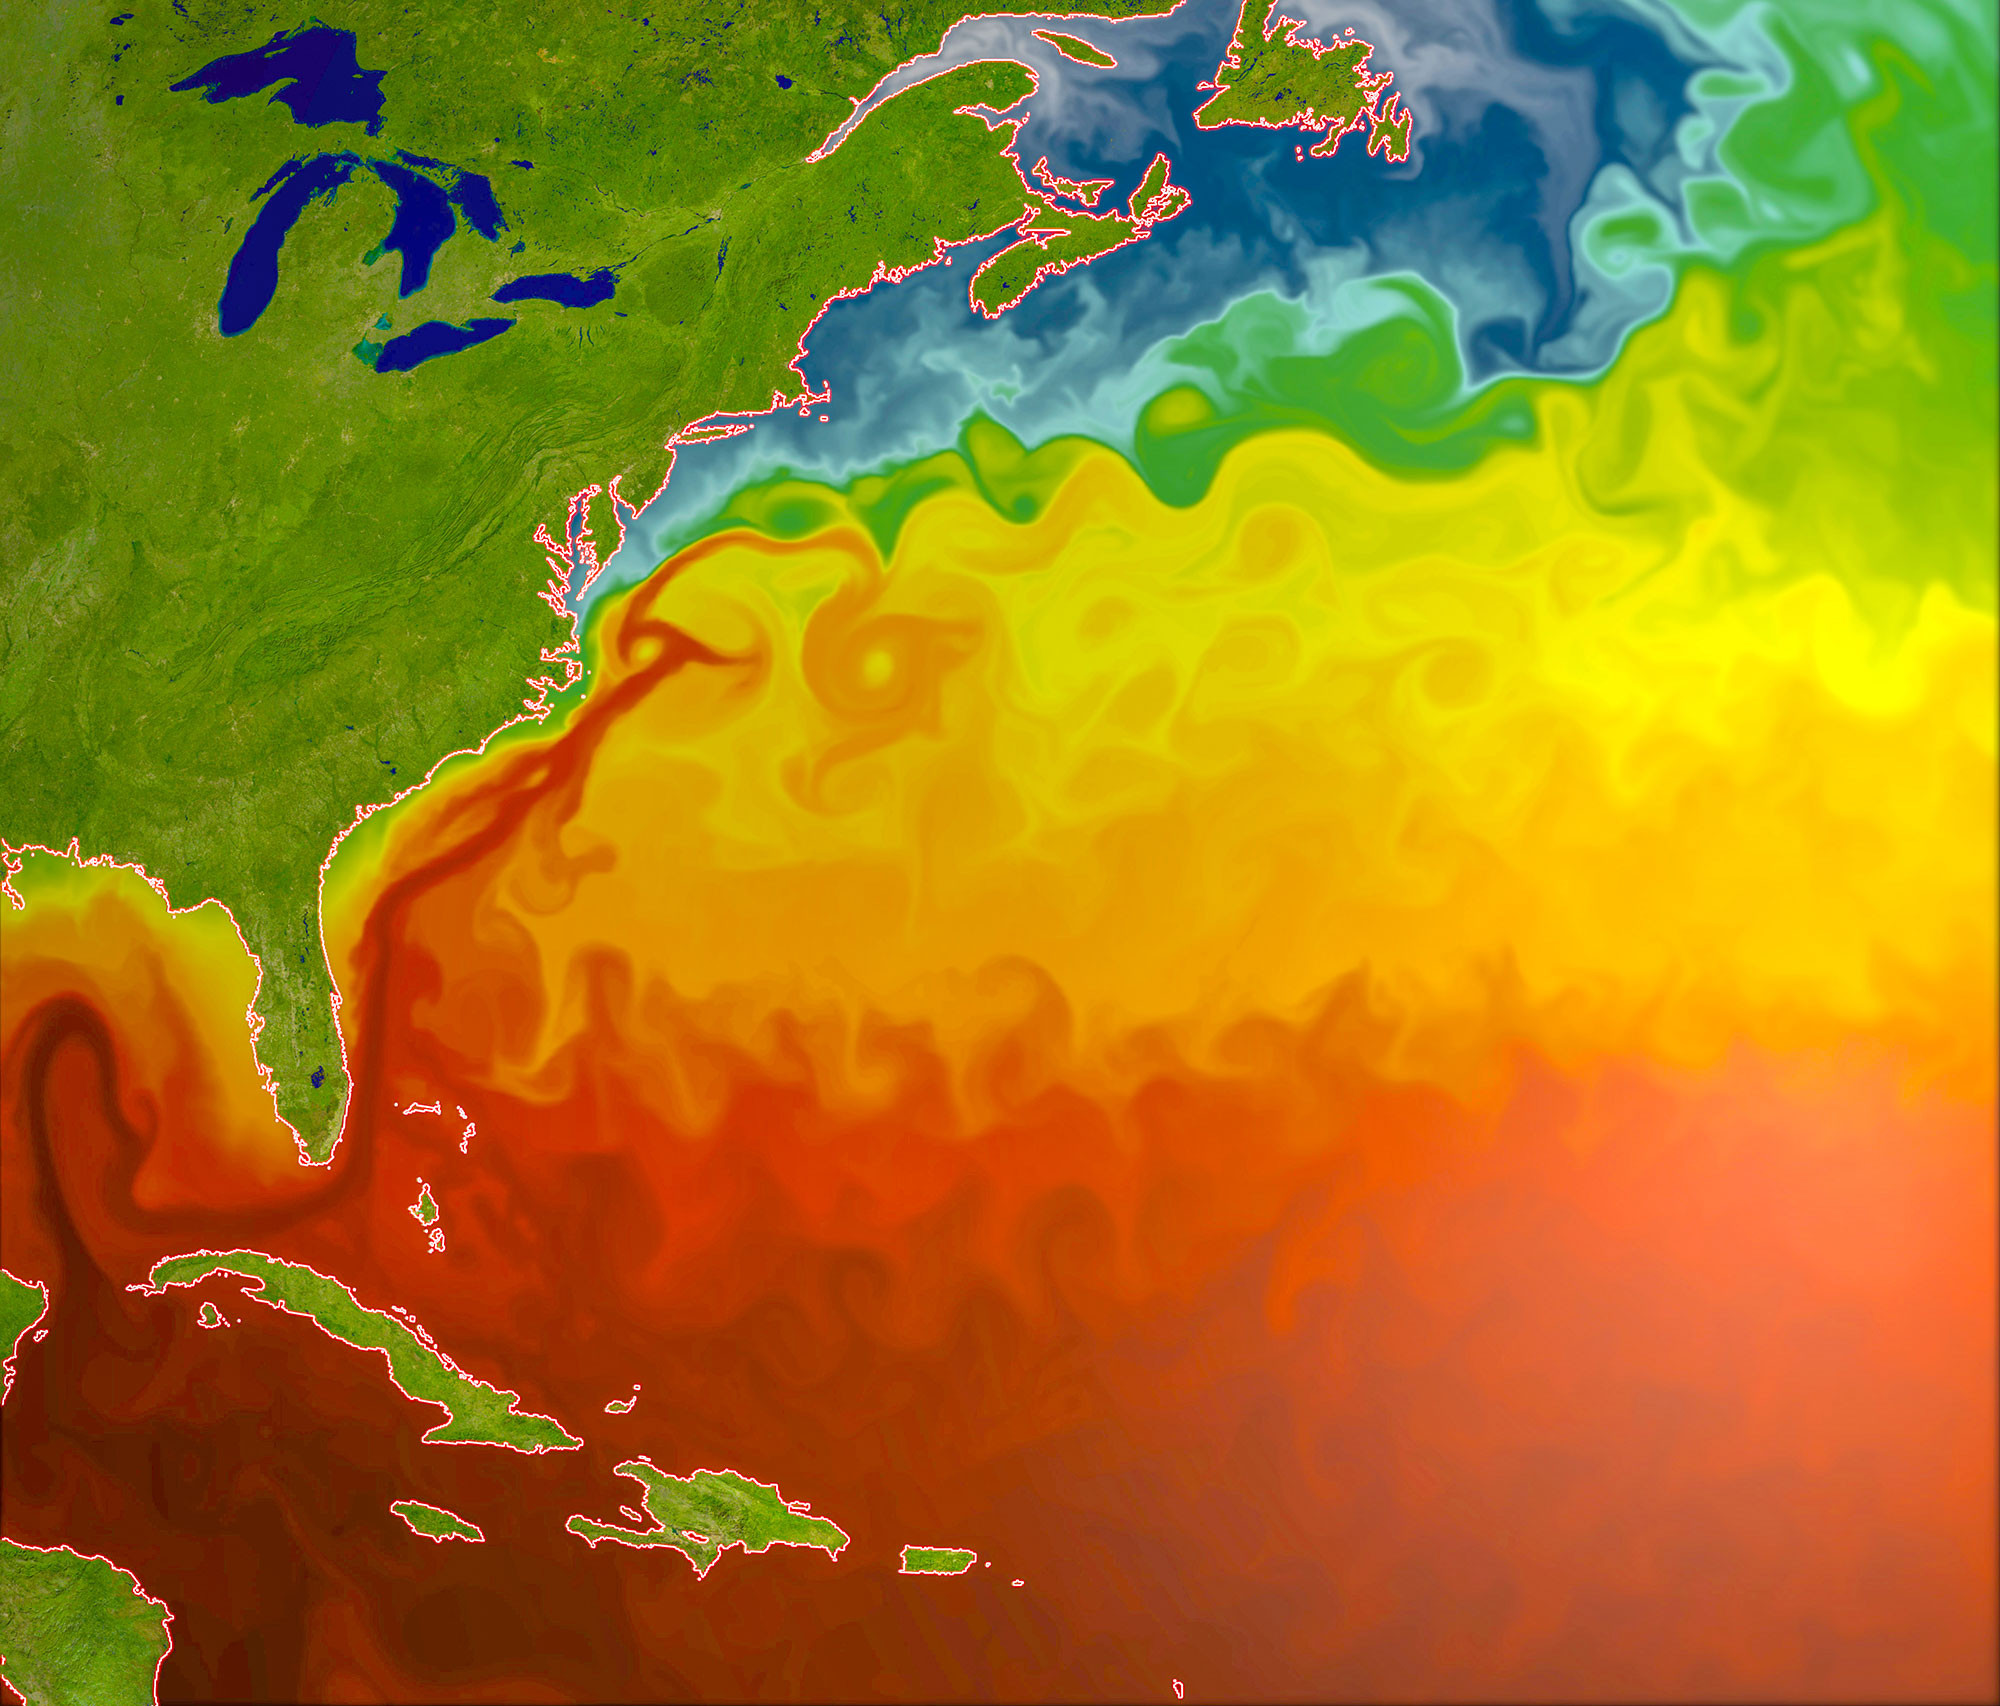
In this article, I discuss the Atlantic branch of the global overturning circulation, a major player in past and quite likely future climate change. It is called the AMOC (short for Atlantic Meridional Overturning Circulation). Its northward flow of warm surface waters and deep cold return flow makes the South Atlantic a curiosity: it transports heat from the southern high latitudes toward the equator, from cold to warm (Figure 1). All other ocean basins behave “normally,” by moving excess heat away from the sun-soaked tropics.
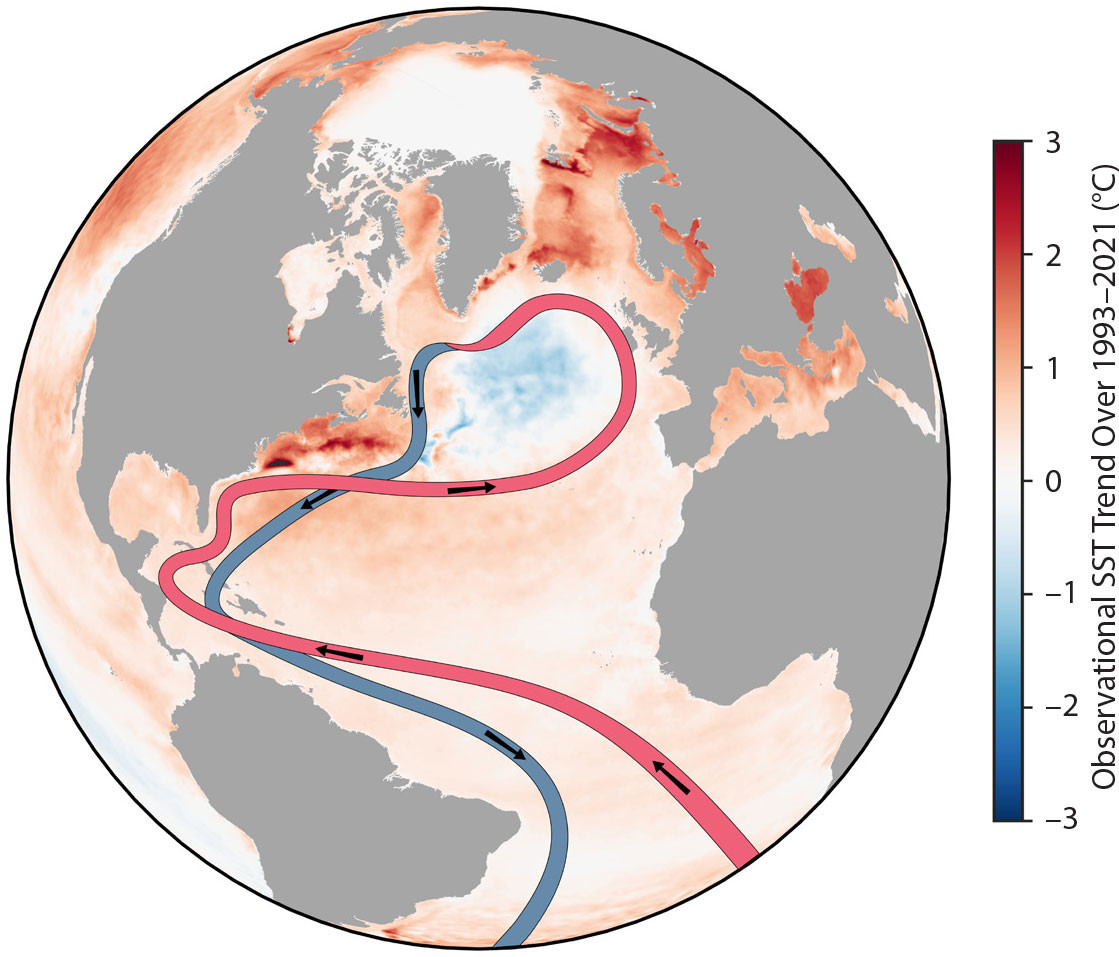
FIGURE 1. This graphic shows a highly simplified schematic of the Atlantic Meridional Overturning Circulation (AMOC) against a backdrop of the sea surface temperature trend since 1993 from the Copernicus Climate Change Service (https://climate.copernicus.eu/). Image credit: Ruijian Gou. > High res figure
|
In the North Atlantic, the overturning circulation moves heat at a rate of one petawatt (1015 Watt; Trenberth et al., 2019), about 50 times the energy use of all humankind, or 3.5 times the rate of global ocean heat uptake in recent decades due to human-caused global warming (Z. Li et al., 2023). It delivers heat all the way up to the region south of Greenland and Iceland, and some even further north past Iceland into the Nordic Seas. There, it generously gives away its heat to the cold winds above until the water is so cold and dense that it sinks into the abyss, down to between 2,000 and 3,000 m depth. There it “flows as a great river, down the full length of the Atlantic” (Broecker, 1987). The heat released to the atmosphere makes the North Atlantic region much too warm for its latitude, particularly downwind of the ocean (Figure 2). It is also the main reason why the Northern Hemisphere is on average ~1.4°C warmer than the Southern Hemisphere, and why the thermal equator, the latitude where Earth is the hottest, is located at ~10° north of the geographic equator (Feulner et al., 2013).
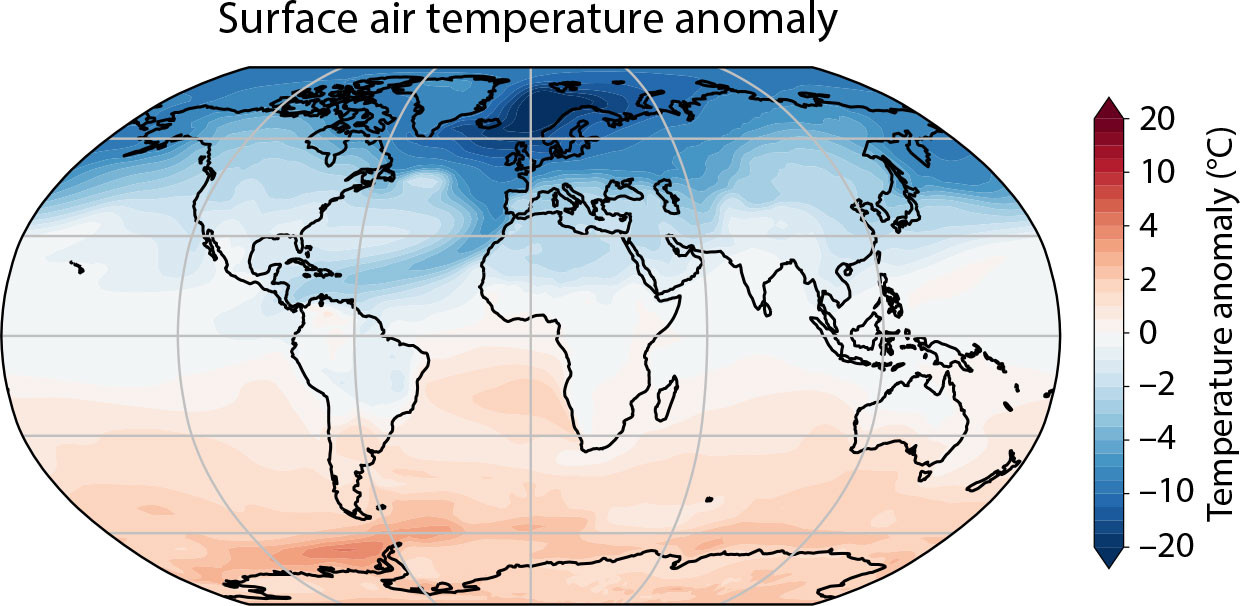
FIGURE 2. “The Earth’s climatic system currently works in a way beneficial to northern Europe,” the late Wally Broecker wrote (Broecker, 1987). This map shows what the world would be like without the AMOC. Nearly the entire Northern Hemisphere would be colder, especially Iceland, Scandinavia, and Britain. Figure by R. van Westen, adapted from van Westen et al. (2024). > High res figure
|
Temperature is not the only key ingredient of the AMOC—the second factor is salinity: the saltier the water, the denser it is. Salinity is therefore an important factor for the sinking described above. Hence, this overturning circulation is also called thermohaline circulation, meaning a circulation driven by temperature and salinity differences, in contrast to circulation driven by wind and tidal currents. While temperature has a stabilizing influence on the AMOC, salinity has the power to destabilize it.
A Tale of Two Instabilities
In 1961, US oceanographer Henry Stommel (Stommel, 1961) recognized how the Atlantic waters’ salinity leads to an AMOC tipping point, a phenomenon that made newspaper headlines once again last year and this year. Water sinks in the northern Atlantic because it is salty enough (unlike in the North Pacific; Warren, 1983). The water is salty because the AMOC brings salty water from the subtropics, a net evaporation region, to the higher latitudes, a net precipitation region. In other words, the AMOC flows because the northern Atlantic is salty, and it’s salty because the AMOC flows. Chicken and egg, or in more technical terms, a self-sustaining feedback effect.
This works the other way around as well: If the northern Atlantic becomes less salty because of an inflow of freshwater (rain or meltwater), the water becomes less dense and the AMOC slows down. Thus, it brings less salt to the region, which slows the AMOC further. This process is called the salt transport feedback. Beyond a critical threshold, it becomes a self-amplifying vicious circle, and the AMOC grinds to a halt. That threshold is the AMOC tipping point (called Stommel Bifurcation in Figure 3). As Stommel wrote in 1961: “The system is inherently fraught with possibilities for speculation about climatic change.”
Stommel’s model just consisted of a high-latitude box and a subtropical box that were connected by an overturning flow proportional to the density difference between them. The model predicted this flow and the temperature, salinity, and density in both boxes. Figure 3 shows the equilibrium AMOC strength as computed by Stommel’s box model, and the tipping point he found.
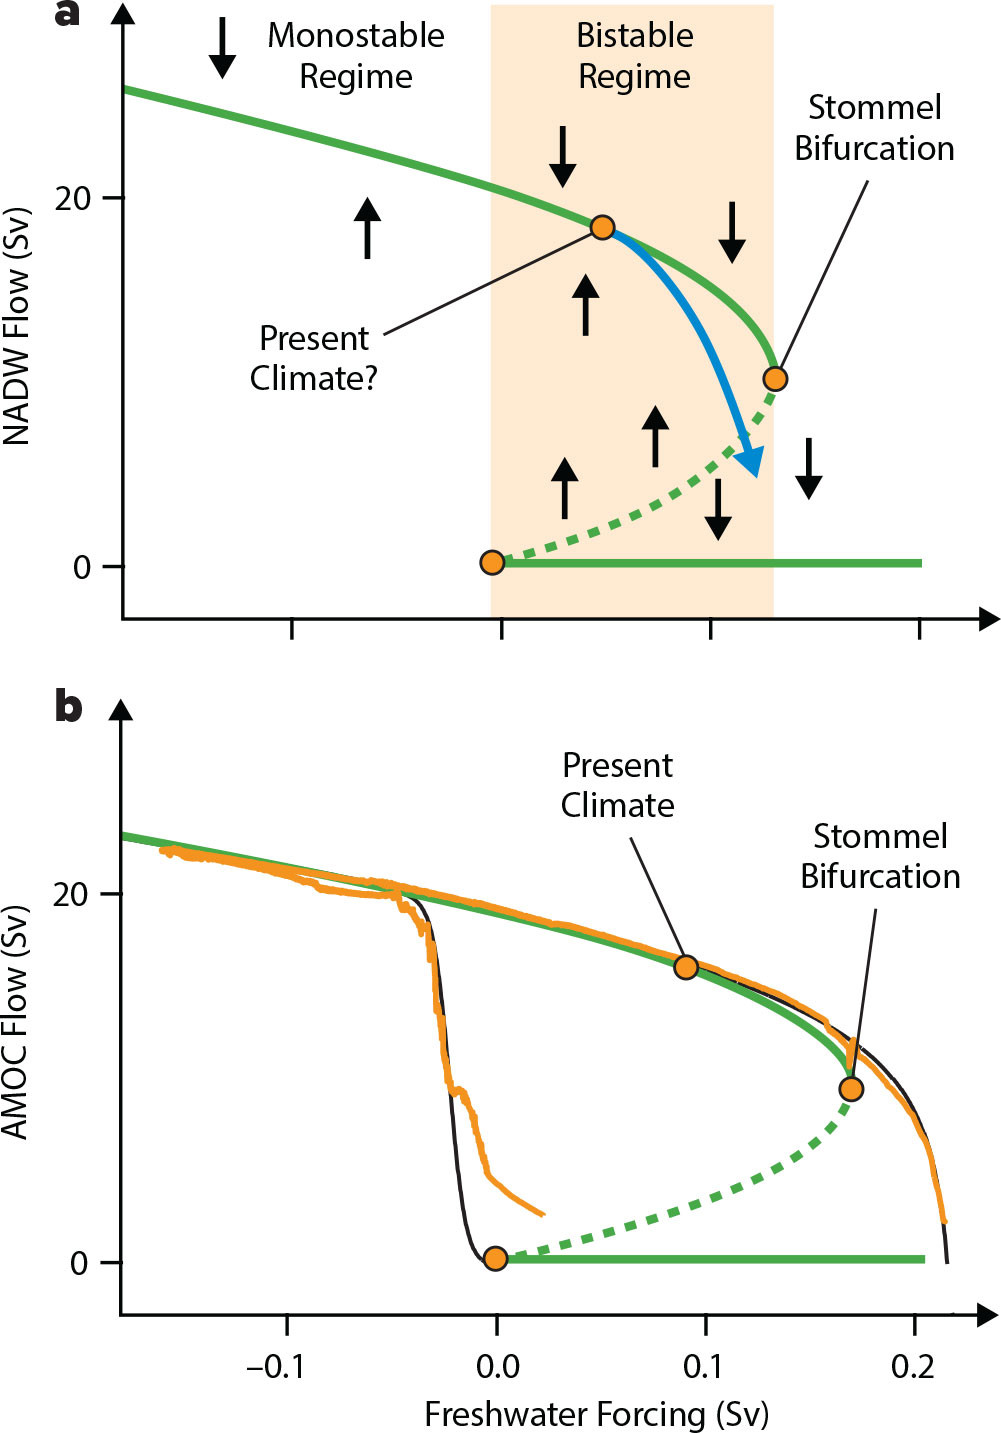
FIGURE 3. (a) Stability diagram of the AMOC in Stommel’s box model, as it depends on the amount of freshwater entering the northern Atlantic. Solid green lines show stable equilibrium states, the dashed green line an unstable one. The blue curve shows a path leaving the equilibrium lines during rapid climate change. After Rahmstorf (2002) (b) Here, the orange line traces the AMOC equilibria in a three-dimensional global ocean circulation model. The black line is the same tracing experiment done with the box model. The upper orange and black lines are traced from left to right starting from AMOC “on,” the lower from right to left starting from AMOC “off.” After Rahmstorf (1996). > High res figure
|
For box models like Stommel’s, the equilibrium curves can be computed analytically—the solution for the green curve is simply a parabola. To trace the equilibrium states of a complex model, freshwater is added to the northern Atlantic at a very slowly increasing rate (e.g., rising by 0.1 Sv over 2,000 years; 1 Sv = 106 m3 s–1) to remain close to equilibrium and to see where internal feedbacks start to dominate the weakening, which happens beyond the tipping point. A Dutch research team in Utrecht developed methods to directly compute equilibrium states in three-dimensional ocean models (Dijkstra et al., 1995), but they don’t work in complex coupled ocean-atmosphere models, so the tracing approach of slowly adding freshwater needs to be applied.
In the monostable regime (to the left of zero freshwater forcing in Figure 3), an AMOC shutdown can still be forced by a large temporary addition of freshwater, but the AMOC will recover after the forcing is over. In the bistable regime, the system can be permanently in either of two stable states, with AMOC “on” or “off,” depending on initial conditions. So, AMOC flow terminated by a temporary forcing will not recover but will remain in the stable “off” state. Experiments with such a temporary freshwater addition show that many, if not most, climate models are in the monostable regime and thus comparatively far from the tipping point. This does not imply that they do not have this tipping point or that they do not have a bistable regime; it just shows they are not in it for their present climate (probably wrongly, see section “Can Climate Models Be Trusted” below).
Climate change can drive the AMOC away from the equilibrium line, following something like the blue path in Figure 3a, because modern global warming proceeds too fast for the ocean to fully adjust. After crossing the dashed line, the AMOC will be attracted toward the “off” state even without further pushing. Note that the AMOC is all the more vulnerable to more rapid forcing (Stocker and Schmittner, 1997). That means that the very slow equilibrium-tracing experiments shown in Figure 3b understate how close the AMOC tipping point is in a situation of rapid climate change, as we are in today.
That this tipping point and the bistable regime are real, and not just an artifact of Stommel’s simple model, has been confirmed in numerous models from the entire model spectrum since Stommel’s 1961 paper, including sophisticated three-dimensional ocean circulation models, intermediate-complexity Earth system models, and fully fledged coupled climate models, for example, the Community Earth System Model (CESM) (van Westen et al., 2024). An early model comparison found the bistable regime in all 11 participating models (Rahmstorf et al., 2005), and I’m not aware of any model that has been tested and did not have this property. While this type of experiment cannot be performed with models explicitly simulating mesoscale eddies in the ocean, I do not expect that this would make a major difference, given that the relevant salt advection feedback operates on a very large scale.
A second type of tipping point may also affect the AMOC. An important part of the sinking process in the northern Atlantic (called “deep water formation”) is deep vertical mixing (convection) when the water column becomes vertically unstable, due to denser water sitting above less dense water. The Swedish oceanographer Pierre Welander showed in 1982 that convection, too, could be flipped off like a switch, again because of the destabilizing effect of salinity (Welander, 1982). In high-latitude regions, the ocean typically gains freshwater from rain at the surface, so once convection stops for long enough, freshwater can accumulate and form a low-density surface layer. That makes it harder and harder to restart convection, and at some point, it is switched off permanently. In subsequent work, we showed how this works even if convection is intermittent in the presence of random weather variability (Kuhlbrodt et al., 2001; Rahmstorf, 2001).
There are two main convection regions within the present-day AMOC: one in the northern Atlantic subpolar gyre region (including the Labrador and Irminger Seas) and one further north in the Nordic Seas. In many model experiments, the Labrador Sea convection has been prone to shut down (Weijer et al., 2019), slowing not just the AMOC but also the subpolar gyre, a huge counterclockwise rotating flow south of Greenland and Iceland (Figure 4). Once convection (which normally extracts heat from the water column by mixing warmer water up to the surface, where heat is lost to the atmosphere) has been capped in this way, less heat gets lost through the sea surface, and the whole water column gets less dense. This slows the AMOC, which after all is driven by the cold, high-density waters pushing south from the high latitudes. Thus, a convection shutdown can help trigger an AMOC shutdown. And because convection is a small-scale process, it is not captured well in most current models (Jackson et al., 2023), adding a layer of uncertainty about the future.
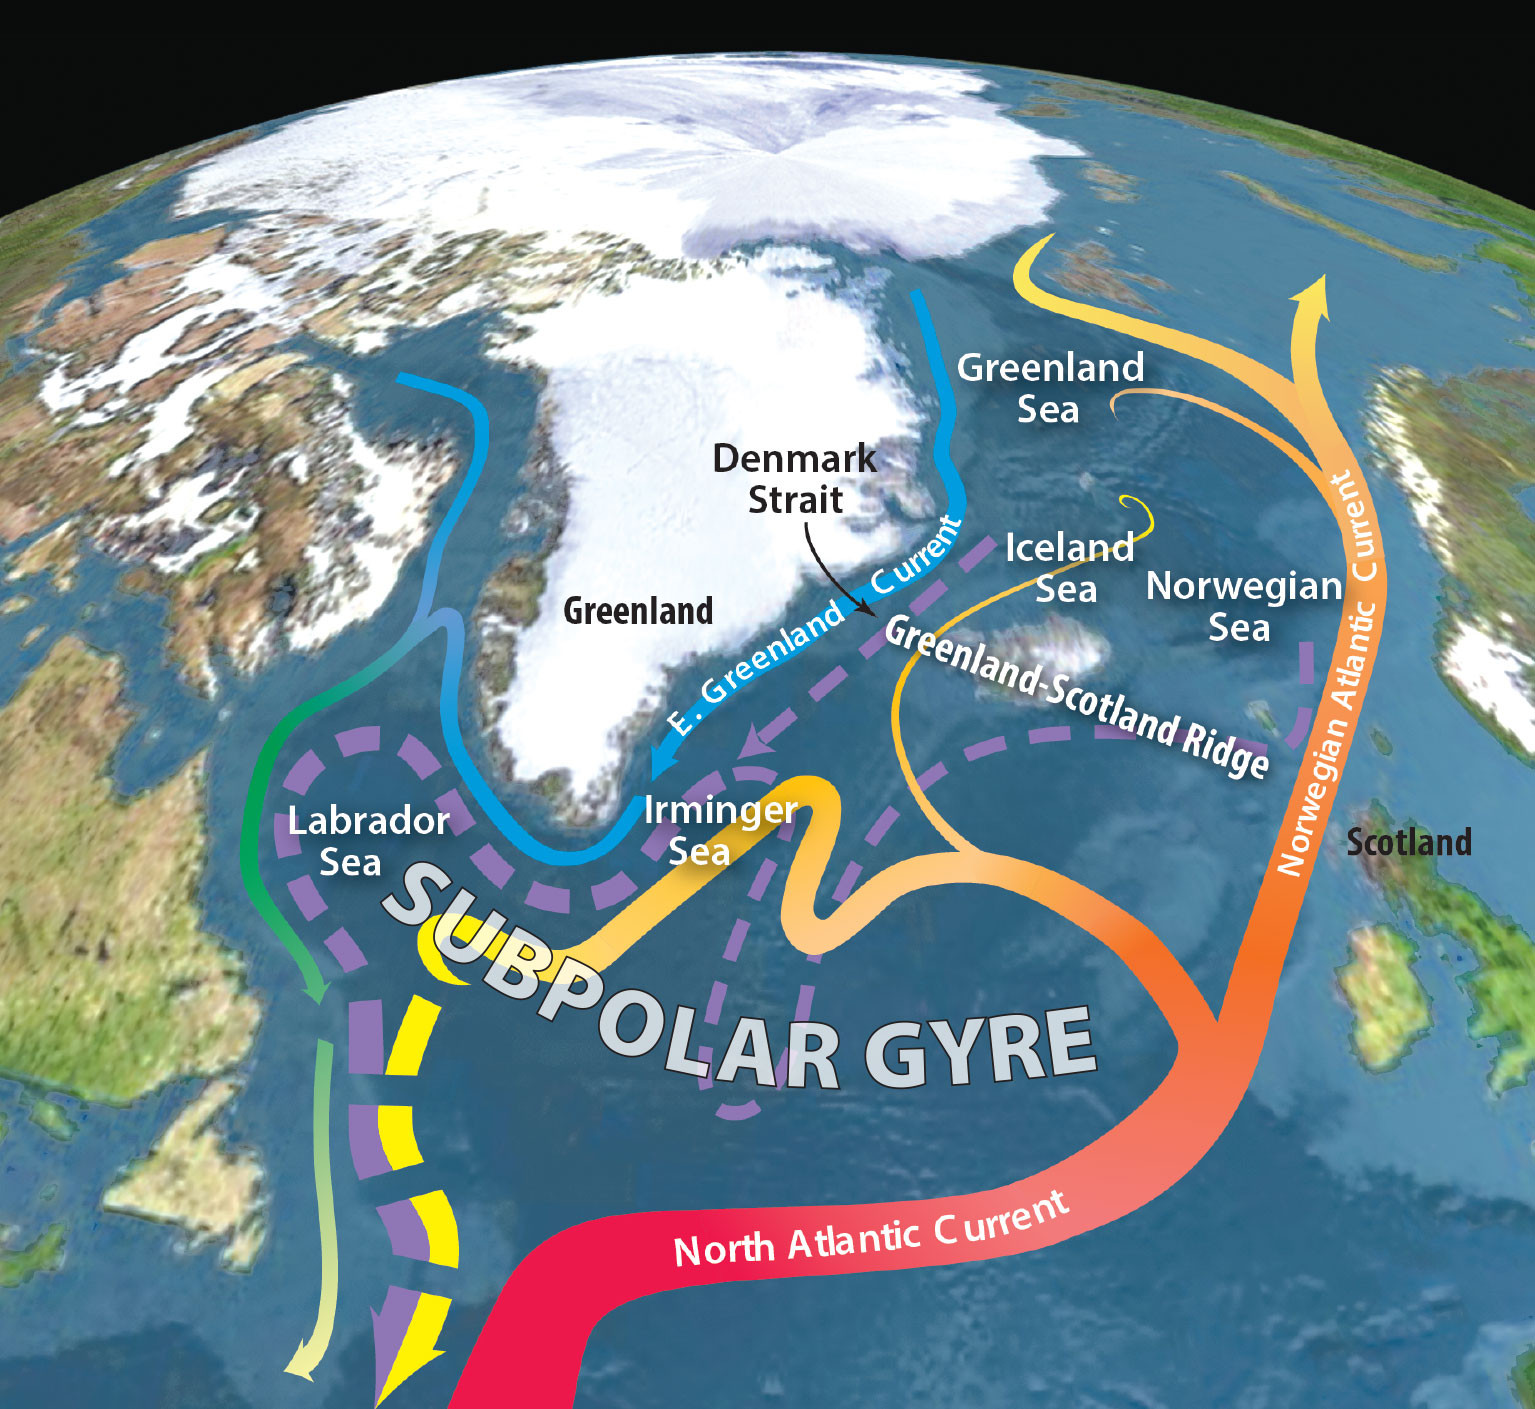
FIGURE 4. Present surface flows (solid lines) and deep flows (dashed lines) are shown for the northern Atlantic and the Nordic Seas. Figure modified from R. Curry and C. Mauritzen © Woods Hole Oceanographic Institution. > High res figure
|
Drastic Past AMOC Changes
Based on this understanding of AMOC instability mechanisms, we can examine some dramatic climate changes that have happened in the recent past—“recent,” that is, from a paleoclimate perspective, namely in the last 100,000 years.
In 1987, Wally Broecker published a now famous article in the journal Nature titled “Unpleasant surprises in the greenhouse?” (Broecker, 1987). In it, he discusses data from deep-sea sediment cores and holes drilled into the Greenland ice cap, noting that these data reveal that “climate changed frequently and in great leaps” rather than smoothly and gradually. Given the regional patterns of these changes, he identified the AMOC (at the time referred to as the “Atlantic conveyor belt”) as the culprit. He warned that by releasing greenhouse gases, “we play Russian roulette with climate [and] no one knows what lies in the active chamber of the gun.”
In the decades since then, we have come to distinguish two types of abrupt climate events that repeatedly occurred during the last Ice Age, centered around the northern Atlantic but with global repercussions (Rahmstorf, 2002).
The first type is Dansgaard-Oeschger (DO) events, named for Danish ice core researcher Willy Dansgaard and his Swiss colleague Hans Oeschger. More than 20 events prominently show as abrupt warming spikes of 10°–15°C within a decade or two in Greenland ice core data (Dansgaard et al., 1982). They can be explained as sudden start-ups of ocean convection in the Nordic Seas when Ice Age convection was mostly only occurring in the open Atlantic to the south of Iceland (Figure 5). The warm ocean circulation configuration that reached far north was apparently not stable under Ice Age conditions: it gradually weakened, until after some hundreds of years, the convection and warm event ended again. It is thus an example of a convective flip-flop as discussed above, with the Nordic Seas convection turning on and off.
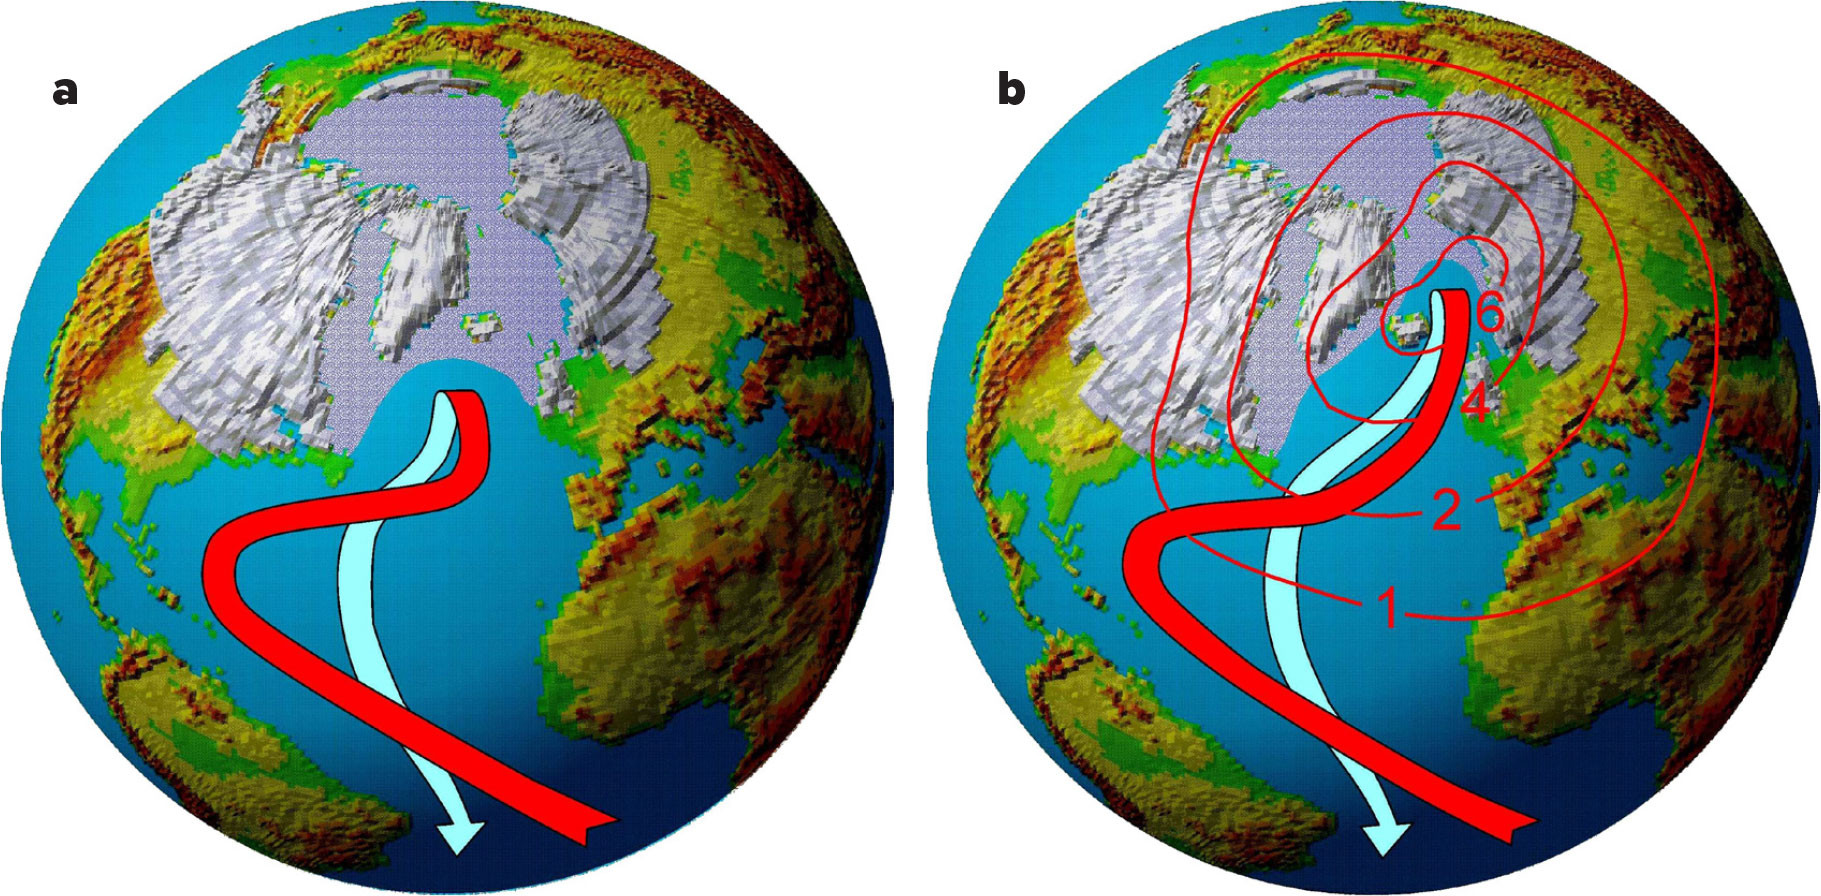
FIGURE 5. The AMOC during the last Ice Age. (a) The prevalent cold (stadial) state. (b) The warmer (interstadial) state during Dansgaard-Oeschger events, showing the modeled temperature change from Ganopolski and Rahmstorf (2002). The very coarse resolution of that model underestimates the warming effect of Dansgaard-Oeschger events. > High res figure
|
The second type is Heinrich events, named for the German scientist Hartmut Heinrich (Heinrich, 1988). It involves huge masses of ice that episodically slid into the sea from the thousands of meters thick Laurentide Ice Sheet that covered northern America at that time. These iceberg armadas drifted out across the Atlantic, leaving behind telltale layers of ice-rafted debris on the ocean floor and adding fresh meltwater to the ocean surface. This led to even more dramatic climate changes, linked to a complete breakdown of the AMOC. So much ice entered the ocean that sea levels rose by several meters (Hemming, 2004). Evidence that this amount of freshwater entering the northern Atlantic shut down the AMOC is found in the fact that Antarctica warmed while the Northern Hemisphere cooled (Blunier et al., 1998), indicating that the AMOC’s huge heat transport from the far south across the equator to the high north had essentially stopped.
Both the Dansgaard-Oeschger events and the Heinrich events, although strongest around the northern Atlantic, had major global climate repercussions even far from the Atlantic as they affected the tropical rainfall belts that result from the rising motion of warm air above the “thermal equator.” During the warm Dansgaard-Oeschger events, these rainfall belts shifted north, leading to warm and humid conditions in the northern tropics as far as Asia. But during Heinrich events, the rainfall belts shifted south, leading to catastrophic drought in the Afro-Asian monsoon region (Stager, 2011). Could similar shifts in tropical rainfall belts be in store for us in future?
The “Cold Blob”: An Ominous Sign of a Slowing AMOC?
Let us look how the AMOC is already responding to ongoing global warming, which has already pushed Earth’s climate outside the envelope of the stable Holocene (Osman et al., 2021) in which Homo sapiens developed agriculture and started to build cities.
Unfortunately, AMOC data only go back a few decades, drawn from just a handful of cross-Atlantic cruises since the 1950s and the RAPID-AMOC array of stations that has collected continuous measurements of salinity and current velocities from the near surface to the seafloor across the Atlantic at 26°N since 2004 (Smeed et al., 2020). Therefore, we must turn to indirect evidence. Exhibit No. 1 is the “warming hole” or “cold blob” found on maps of observed global temperature change (Figure 6). While the entire globe has warmed, the subpolar North Atlantic has resisted and even cooled. This is exactly the region where the AMOC delivers much of its heat, and exactly the region where climate models have long predicted cooling as a result of the AMOC slowing down.
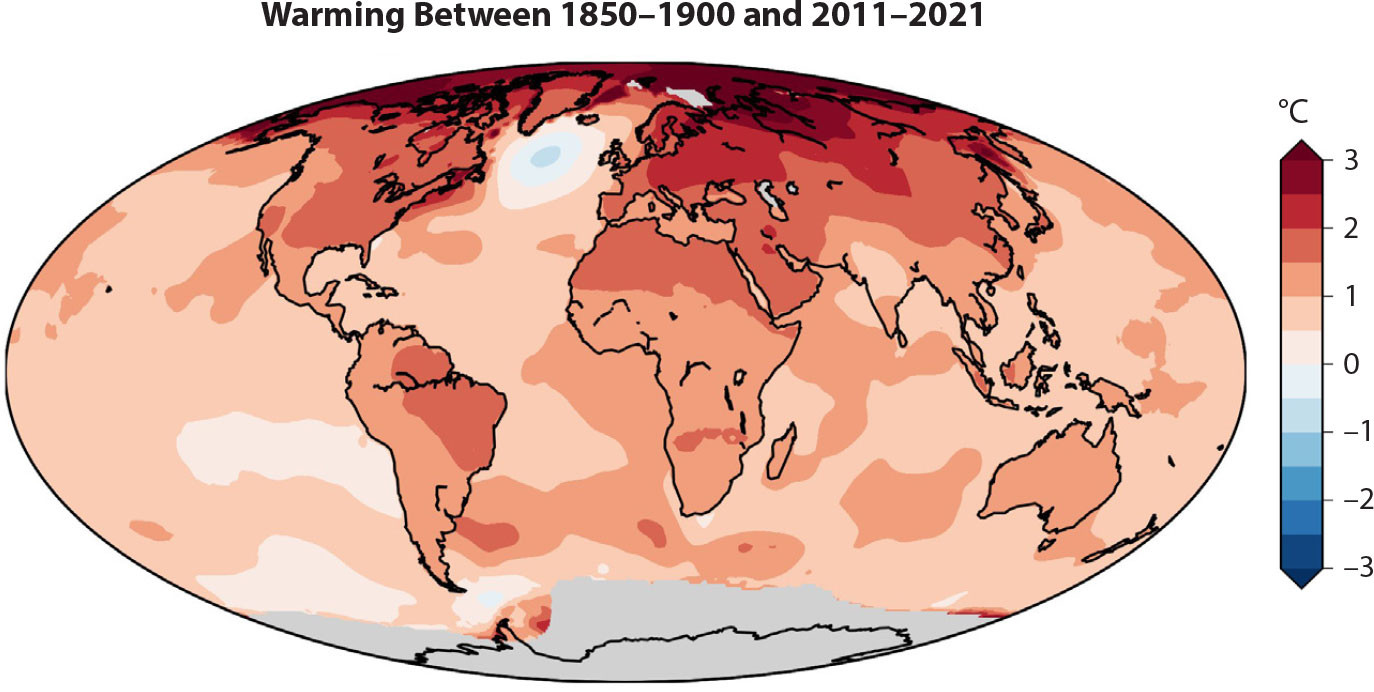
FIGURE 6. Map of observed near-surface air temperature changes since the late nineteenth century. Gray areas indicate lack of data. Image credit: Zeke Hausfather, Berkeley Earth. > High res figure
|
A seminal study by Dima and Lohmann (2010) analyzed global patterns of sea surface temperature changes since the nineteenth century and concluded “that the global conveyor has been weakening since the late 1930s and that the North Atlantic overturning cell suffered an abrupt shift around 1970.” Two years later, a Dutch group, analyzing an ensemble of model results, confirmed that an AMOC slowdown causes the northern Atlantic cooling and dubbed the feature the “warming hole” (Drijfhout et al., 2012). In 2015, I joined forces with US climate scientist Michael Mann and other colleagues in using Mann’s paleoclimatic proxy reconstruction of surface temperatures to suggest that the modern AMOC slowdown is probably unique in at least the last millennium (Rahmstorf et al., 2015). The term “cold blob” originated in a quote from Mann in a Washington Post article on our study (Mooney, 2015), and it has since stuck.
Theoretically, the cold blob could have also arisen from an increase in net heat loss at the ocean surface (He et al., 2022). For short-term variability from year to year, weather conditions are expected to play a dominant role in changing the sea surface temperature—particularly in summer when the surface mixed layer is thin and its thermal inertia is small (thus, in later studies, we focus on the period November–May). The observations-based reanalysis data show, however, that since the mid-twentieth century, net heat loss through the ocean surface in the cold blob region has decreased, not increased—exactly what would be expected when the ocean is bringing less heat into that region, so less is passed on to the atmosphere (Figure 7). Also, analysis of climate models, in which AMOC changes are known, shows that the AMOC strength correlates closely with the cold blob temperature change (Caesar et al., 2018). This result confirms that on longer timescales, the AMOC is the dominant factor, allowing the conclusion that the cold blob so far corresponds to about 15% weakening of the AMOC.
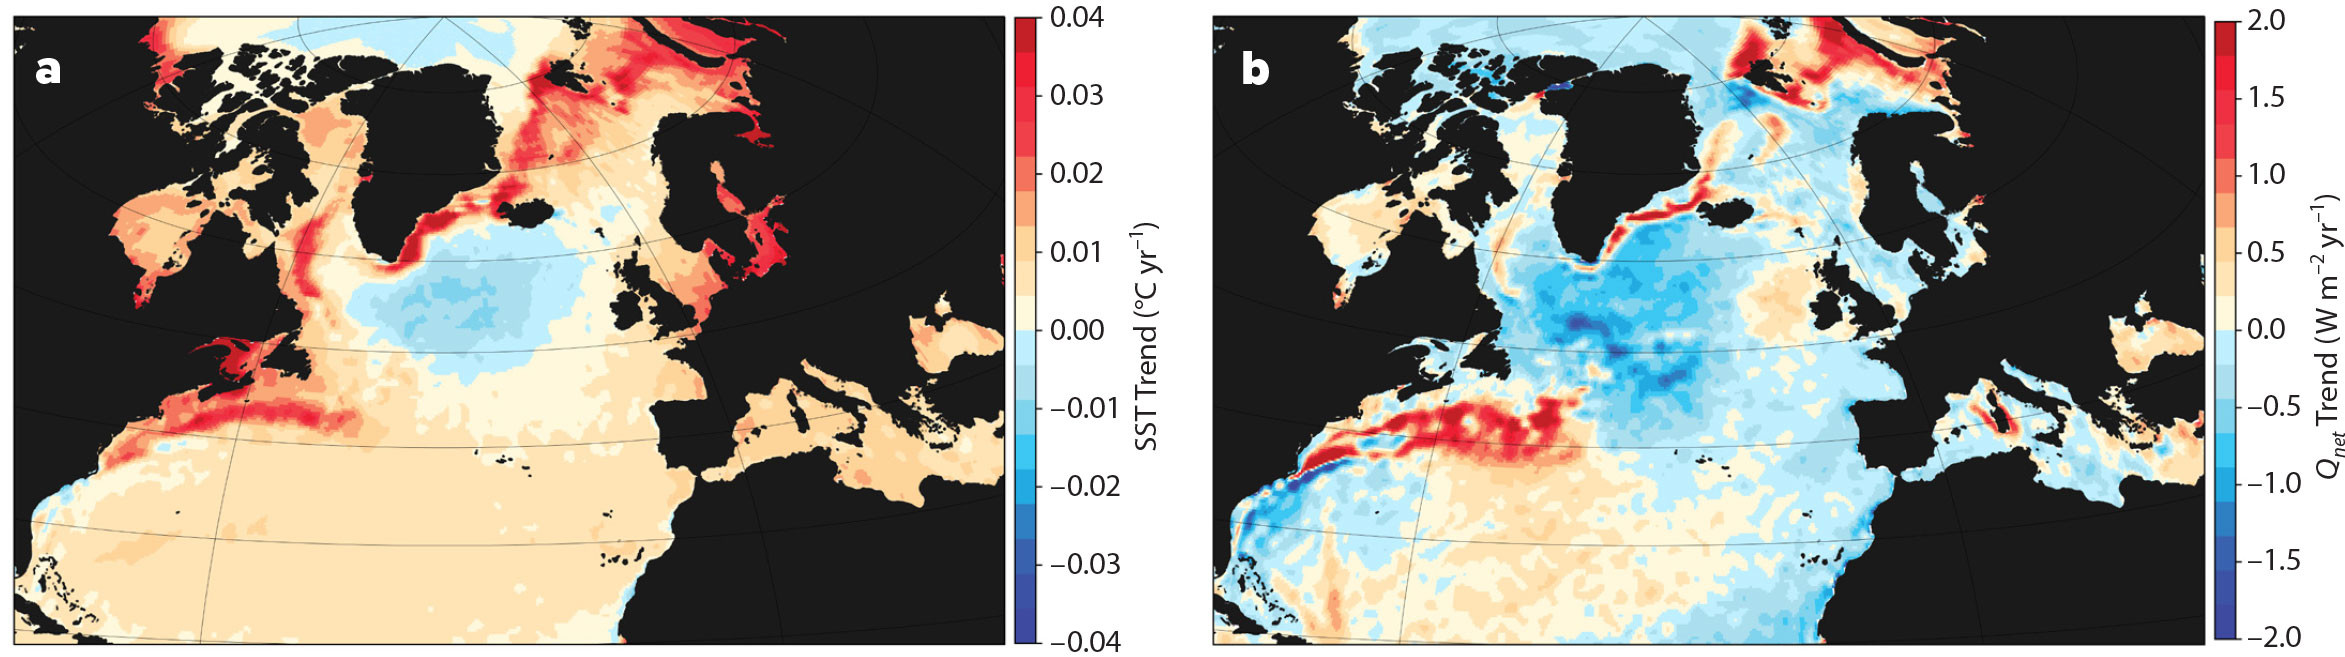
FIGURE 7. The AMOC slowdown fingerprint in the observations-based reanalysis data from 1940 to 2022. (a) Sea surface temperature (SST) trends. (b) Trend of net heat loss from the ocean surface (sensible, latent, and radiative). The heat flux trends go in the opposite direction of being a cause of the SST trends. From Jendrkowiak (2024). > High res figure
|
The cold blob is not just a surface phenomenon; it is also clearly visible (Figure 8) in the trend of ocean heat content of the upper 2,000 m (Cheng et al., 2022).
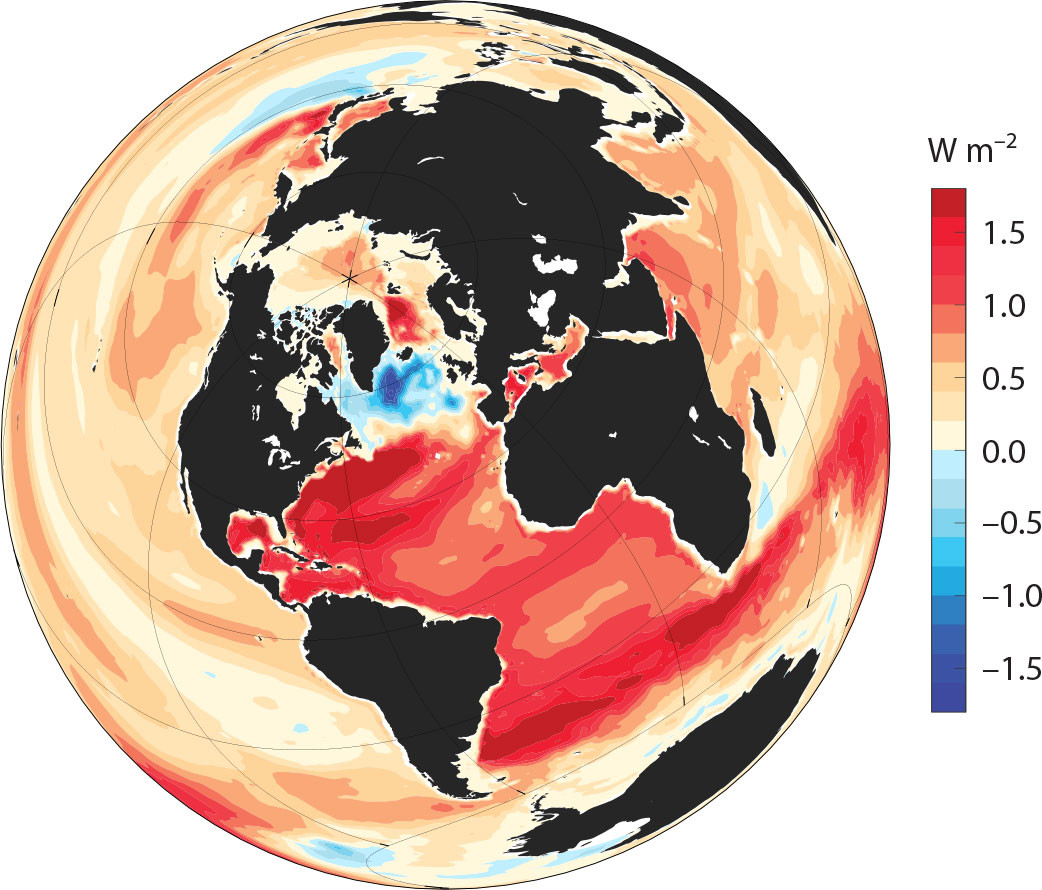
FIGURE 8. Trend in ocean heat content of the upper 2,000 m, 1958–2023. IAP data. Image credit: Lijing Cheng. > High res figure
|
But apart from the cold blob, AMOC slowing has another telltale effect.
A Shifting Gulf Stream
Fluid dynamics on a rotating globe like Earth has some peculiar effects that are not intuitive. They result from the fact that the Coriolis force changes with latitude. In 2007 and 2008, two studies conducted by AMOC researcher Rong Zhang demonstrated how a basic law of physics, angular momentum conservation, acting at the point where the deep southward AMOC flow crosses under the Gulf Stream, makes the Stream shift closer to shore when the AMOC weakens (Zhang and Vallis, 2007; Zhang, 2008). Her studies describe a “fingerprint” of a weakening AMOC that not only includes the cold blob but also a sea surface temperature anomaly of opposite sign off the American Atlantic coast north of Cape Hatteras.
Caesar et al. (2018) compared this fingerprint to observed sea surface temperature changes since the late nineteenth century and found strong agreement (see Figure 9). The observational data are much less detailed because they rely on relatively sparse ship measurements, but more detail is in the satellite data. Although the time periods for the observed and the satellite data are different, the trends are divided by the global mean temperature change to make them roughly comparable in magnitude. Thus, for the relatively short satellite period there is much stronger random variability relative to the signal (“noise”), and the signal-to-noise ratio declines from top to bottom in the three images. Despite the differences in other variability, the fingerprint of AMOC decline is very clear in all three Figure 9 plots.
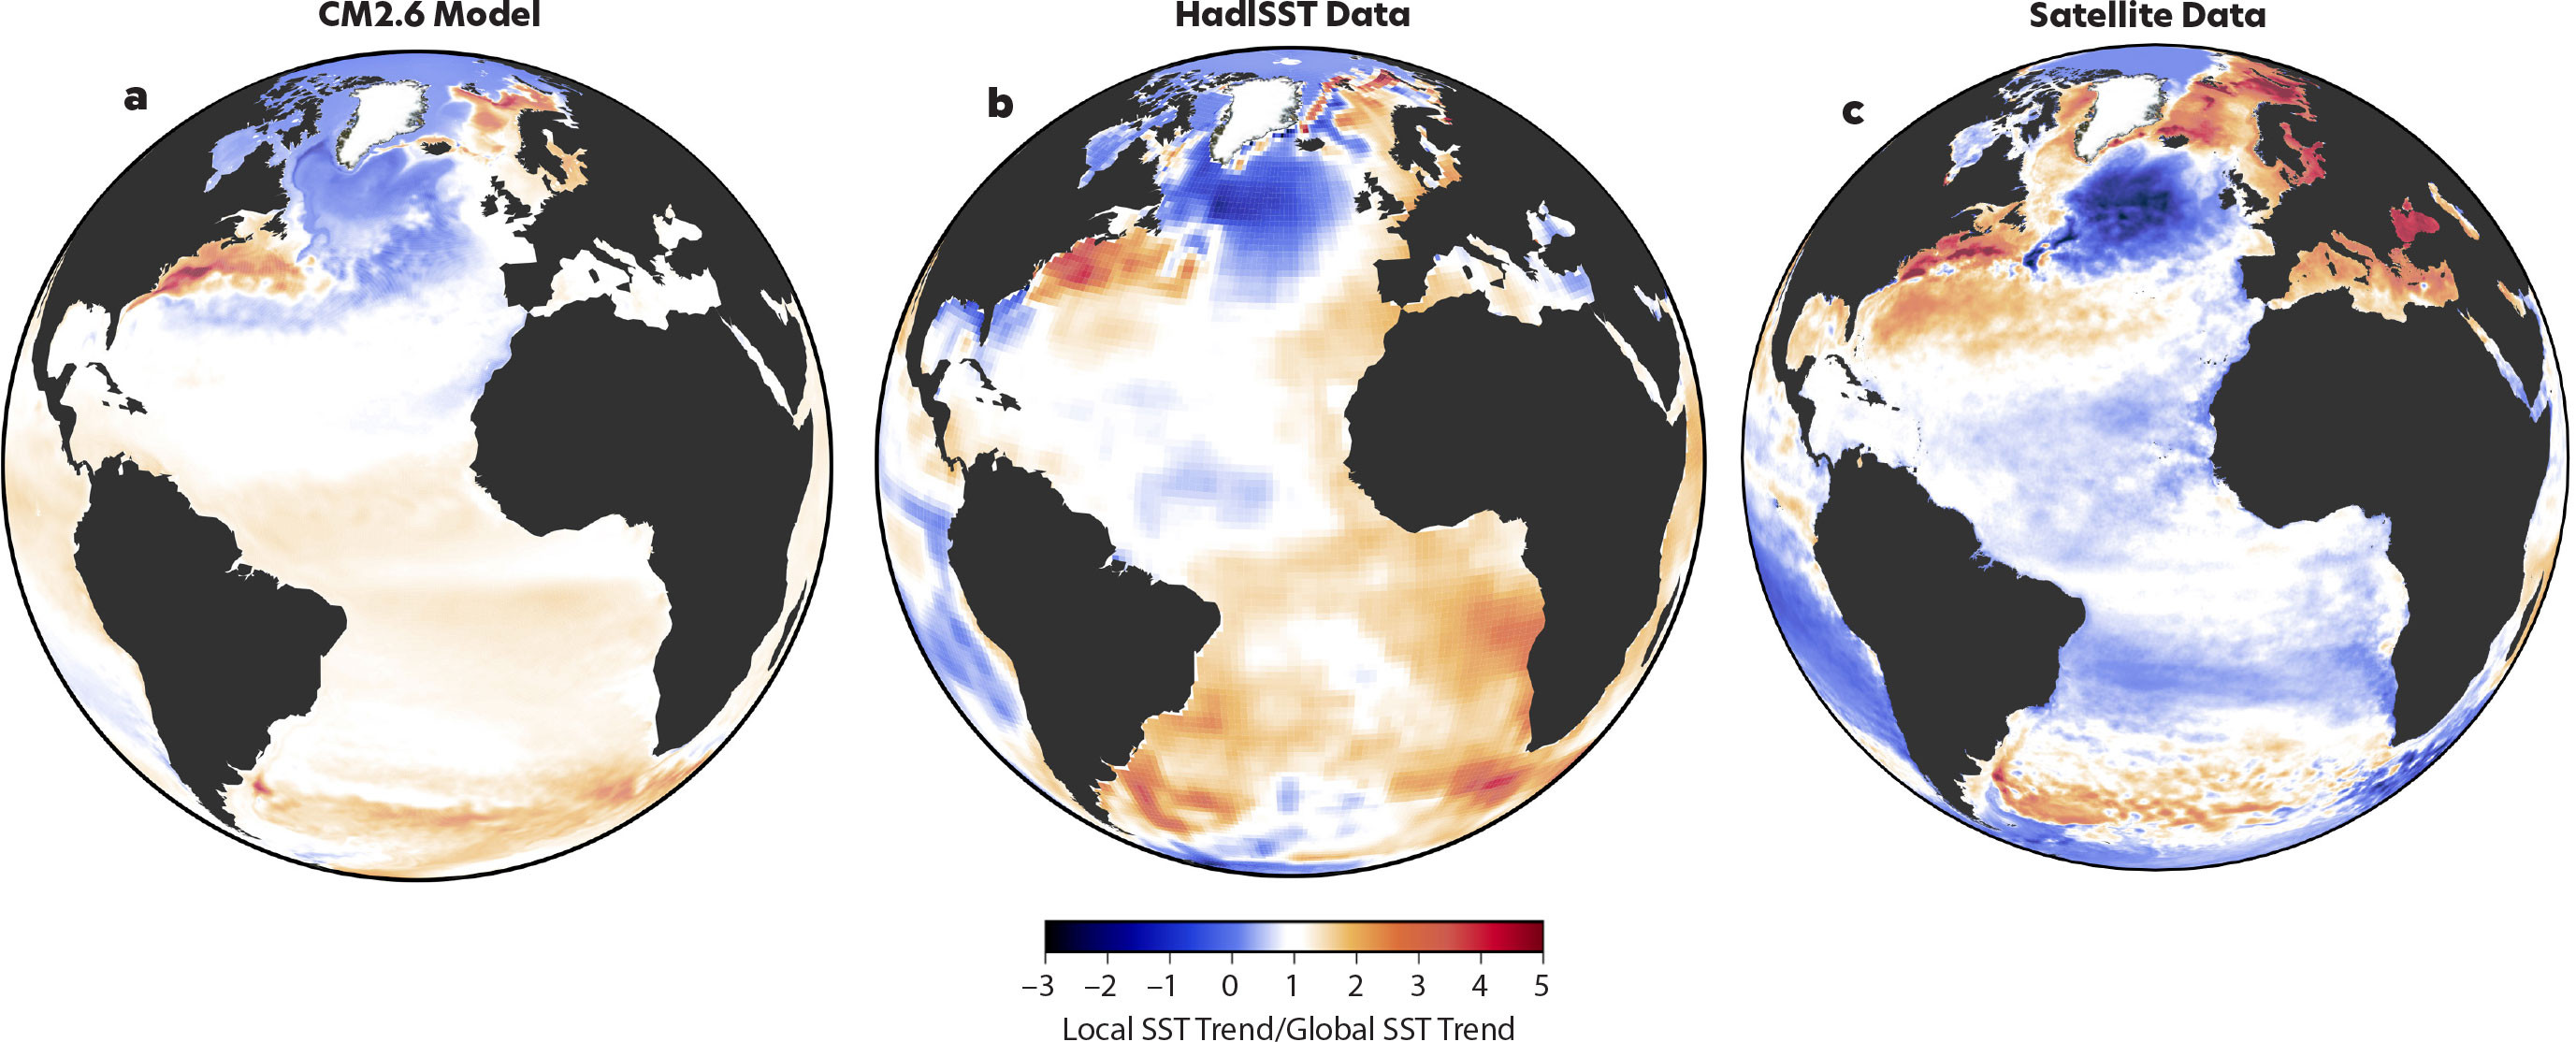
FIGURE 9. In these maps of sea surface temperature (SST) trends divided by their global mean trend, white signifies the same trend as the global mean. (a) Result of a CO2 doubling experiment with the CM2.6 climate model also shown on the title page of this article, (b) shows the observed trend over 1870–2016, and (c) plots data from the Copernicus satellite collected during 1993–2021. (a) and (b) from Caesar et al. (2018). (c) Courtesy of Ruijian Gou. > High res figure
|
As a side note, all three diagrams show a warming patch in the Arctic off Norway; in the model, this is due to increasing ocean heat transport from the Atlantic into the Arctic Ocean (Fiedler, 2020). This flow may be unrelated to the AMOC, or possibly anti-correlated to the AMOC and thus a third part of its fingerprint.
The strong warming off the North American Atlantic coast is again not caused by surface heat fluxes, as the reanalysis data show the surface heat flux has changed in the opposite direction, toward increasing heat loss (Figure 7). Also, the current generation of climate models (CMIP6) indicate a clear correlation of AMOC strength with this fingerprint pattern of sea surface temperatures, including both the cold blob and the warming part (Latif et al., 2022).
Furthermore, a recent study using the three-dimensional observational ocean data collected by Argo profiling floats (https://argo.ucsd.edu/) shows that the Gulf Stream has shifted about 10 km closer to shore since the beginning of this century (Todd and Ren, 2023). From the RAPID array we know that the AMOC has indeed weakened during this time span. In addition, there has been a “robust weakening of the Gulf Stream during the past four decades observed in the Florida Straits” (Piecuch and Beal, 2023), which, although not necessarily linked to an AMOC weakening, is at least consistent with it.
Additional evidence consistent with AMOC slowing also comes from salinity changes. The northeastern subpolar Atlantic is freshening (Figure 10), likely through a combination of increased freshwater input from rainfall and rivers as well as the melting of sea ice and the Greenland ice sheet, plus the effect of ocean circulation changes bringing less salty subtropical waters to the north. The Iceland Basin registers the lowest salinity in 120 years of measurements (Holliday et al., 2020).
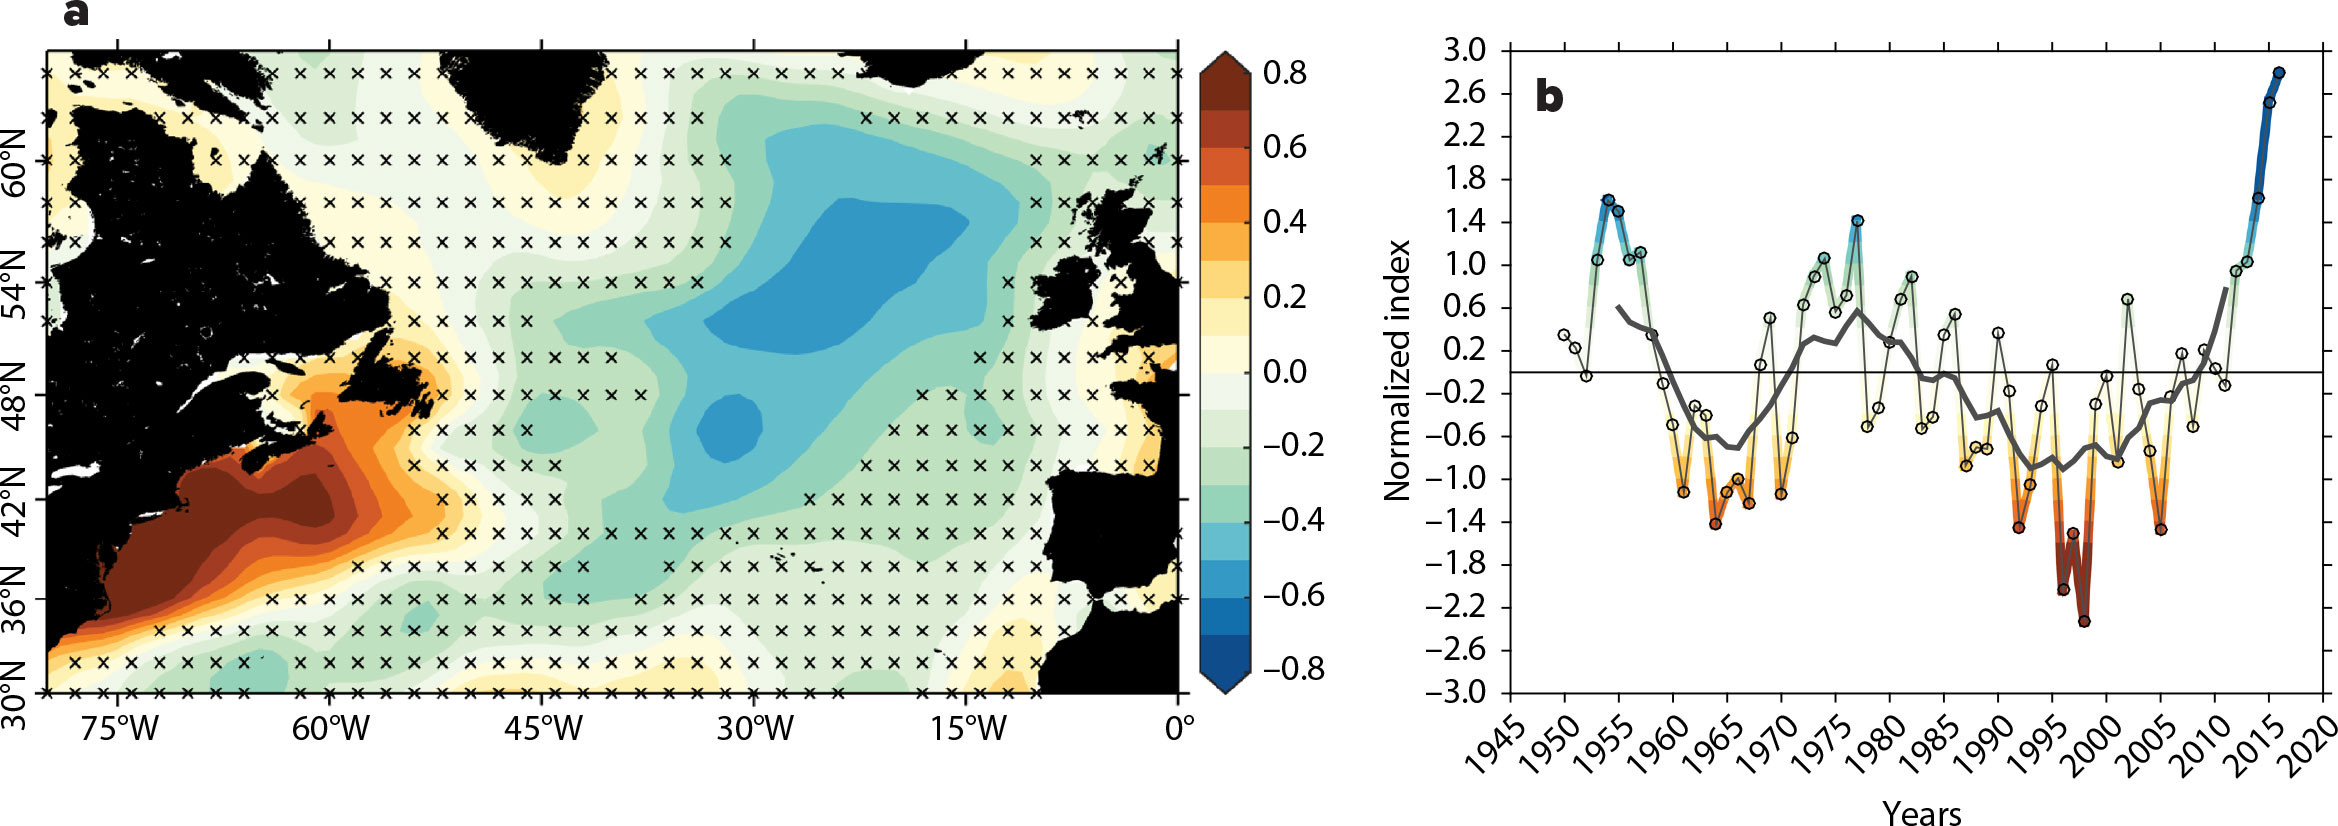
FIGURE 10. The “fresh blob” in the northeastern North Atlantic, with a corresponding salty anomaly along the North American coast and the associated time evolution. Blue indicates anomalously low salinity and brown high salinity. Compare the sea surface temperature fingerprint in Figure 9. Image credit: N. Penny Holliday, © National Oceanography Centre, 2020, CC-BY 4.0, https://creativecommons.org/licenses/by/4.0/. > High res figure
|
At the same time, salinity is increasing in the subtropical South Atlantic, which is considered an AMOC fingerprint less affected by short-term variations than the northern Atlantic temperature fingerprint; this suggests an acceleration of AMOC slowdown since the 1980s (Zhu et al., 2023).
Yet more evidence comes from analysis of seawater density in the upper 1,000 m in the subpolar gyre region, which correlates closely with the AMOC and shows a decline over the past 70 years. This decline implies an AMOC weakening of ~13% over this period (Chafik et al., 2022), consistent with the 15% weakening suggested by the cold blob data.
More Lessons from Paleoclimate
To understand conditions before regular temperature measurements began, we must turn to proxy data: the traces of past climate change left behind in slowly accumulating archives such as ice sheets or seafloor sediments. These proxies allow us to reconstruct past sea surface temperatures and other parameters. For example, the ratio of oxygen isotopes found in the microscopic skeletons that make up much of deep seafloor sediment provide a record of past surface water temperatures, and the sizes of sediment grains on the ocean floor reveal current speeds above it. Caesar et al. (2021) compiled a number of published reconstructions of past AMOC flow and concluded that the AMOC is currently at its weakest in the last millennium (Figure 11).
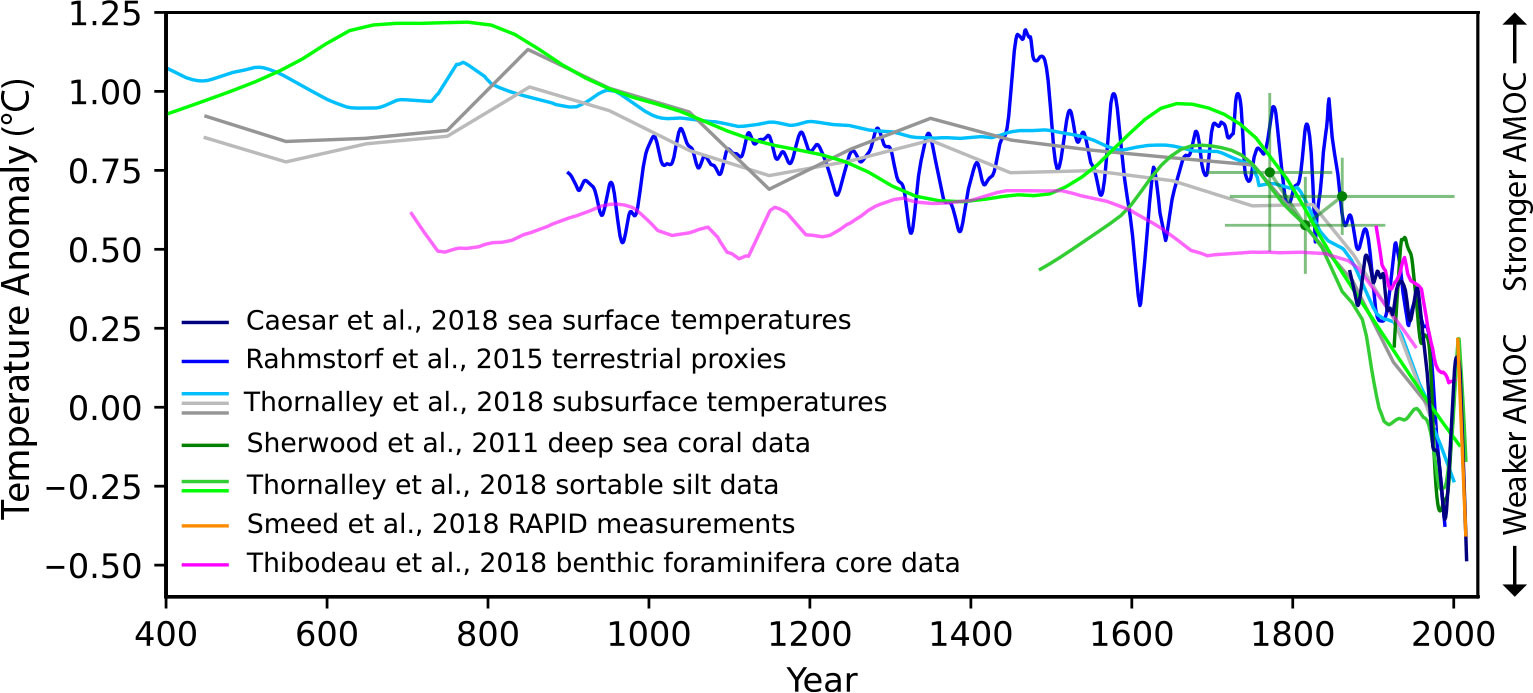
FIGURE 11. AMOC strength for the past 1,600 years as reconstructed from different paleoclimatic data sets. After Caesar et al. (2021) The vertical axis shows the temperature anomaly in the “cold blob” region from Caesar et al. (2018); other data are scaled to that. > High res figure
|
Though the validity of proxy data can always be questioned, there is general agreement in data collected from different regions analyzed by different research teams using very different methods. For those proxy data series that extend to recent decades, the agreement between observation- and model-based AMOC reconstructions is good (Caesar et al., 2022).
Given the many independent lines of evidence, there is overwhelming evidence for a long-term weakening of the AMOC since the early or mid-twentieth century. Note that there is substantial decadal variability in the AMOC in addition to its long-term decline, which makes it essential to be clear about the exact time period when discussing AMOC changes.
Is the long-term AMOC weakening human-caused? Multiple lines of evidence point to its being a result of fossil-fuel-caused global warming. First, climate models have long predicted its decline in response to global warming, and the physics behind these predictions is understood. At least two studies analyzing state-of-the-art climate models and observations have shown “that the recent North Atlantic warming hole is of anthropogenic origin” and is caused by reduced northward oceanic heat transport related to greenhouse gas emissions (Chemke et al., 2020; Qasmi, 2023). In addition, the paleoclimatic data shown in Figure 11 also strongly point to human activities as the cause, in that AMOC weakening coincides with the period of unprecedented modern global warming.
Can Climate Models Be Trusted?
Climate models have long predicted a significant AMOC slowdown in response to global warming, including a corresponding cold blob (see Figure 12 for a recent version). In fact, I wrote two commentary pieces for Nature on that topic in the 1990s (Rahmstorf, 1997, 1999), and then as now, the amount of predicted weakening differed greatly among different models. The latest, sixth IPCC report found that, even for a low emissions scenario, the AMOC will weaken between 4% and 46% by the year 2100, depending on the model. In the high emissions scenario, the reduction ranges between 17% and 55% (IPCC, 2021). The IPCC report also concluded: “While there is medium confidence that the projected decline in the AMOC will not involve an abrupt collapse before 2100, such a collapse might be triggered by an unexpected meltwater influx from the Greenland Ice Sheet.”
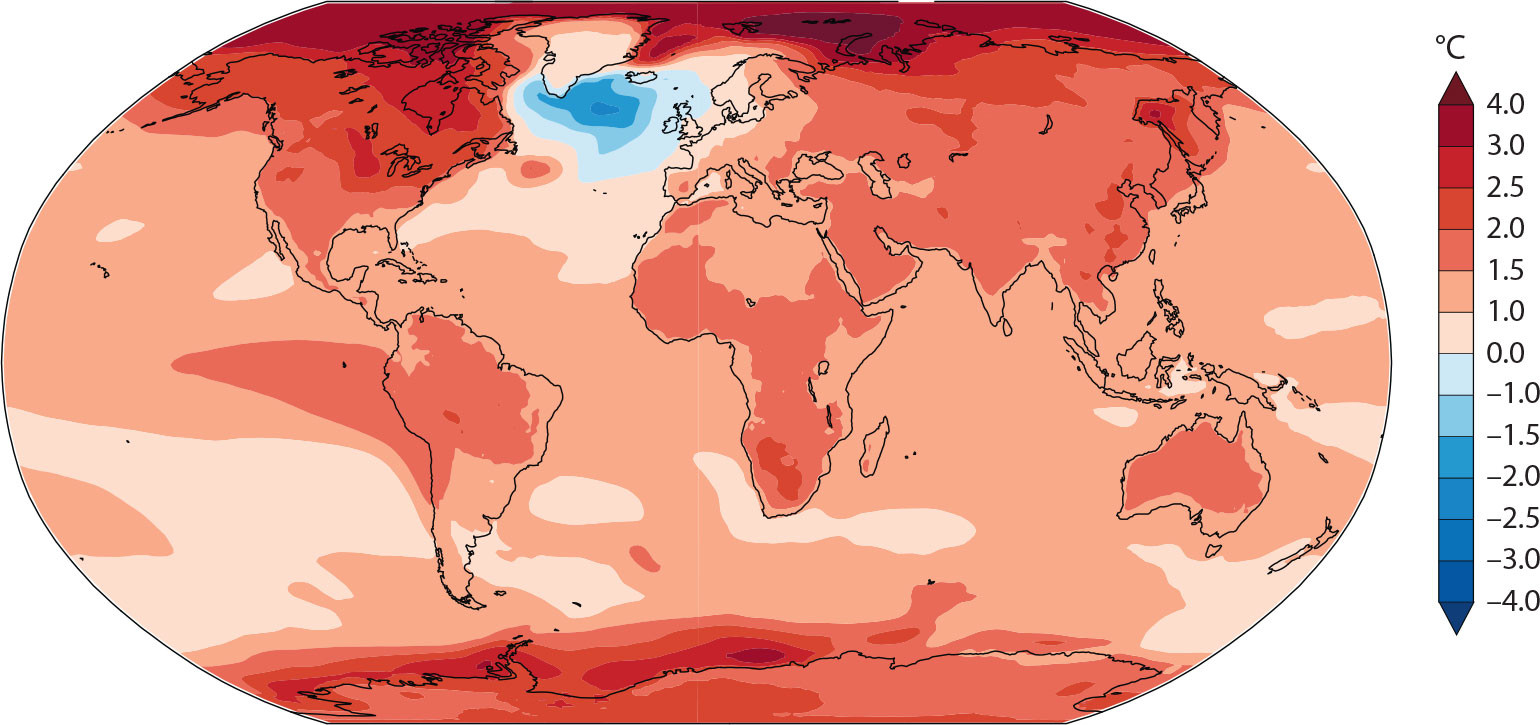
FIGURE 12. This Intergovernmental Panel on Climate Change (IPCC) figure illustrates global temperature changes by the year 2100 for a low emissions scenario (SSP1-2.6) in high-warming models (IPCC, 2021, Figure 1 of Box TS.3). > High res figure
|
This brings us to an important question: Can we trust climate models on this? Generally, climate models have done a great job in predicting global mean temperatures. Even rather simple models from the 1980s predicted global warming quantitatively correctly—including the models run by Exxon (Supran et al., 2023). But that’s relatively easy, as it just depends on Earth’s energy balance.
Changes in thermohaline ocean circulation are far more difficult to predict, as they depend on subtle temperature and salinity differences across the ocean, in three dimensions. The models haven’t done well at reproducing past AMOC changes (McCarthy and Caesar, 2023). The last IPCC report shows that current climate models on average don’t even generate the observed cold blob (though many earlier models did; see Figure 13).
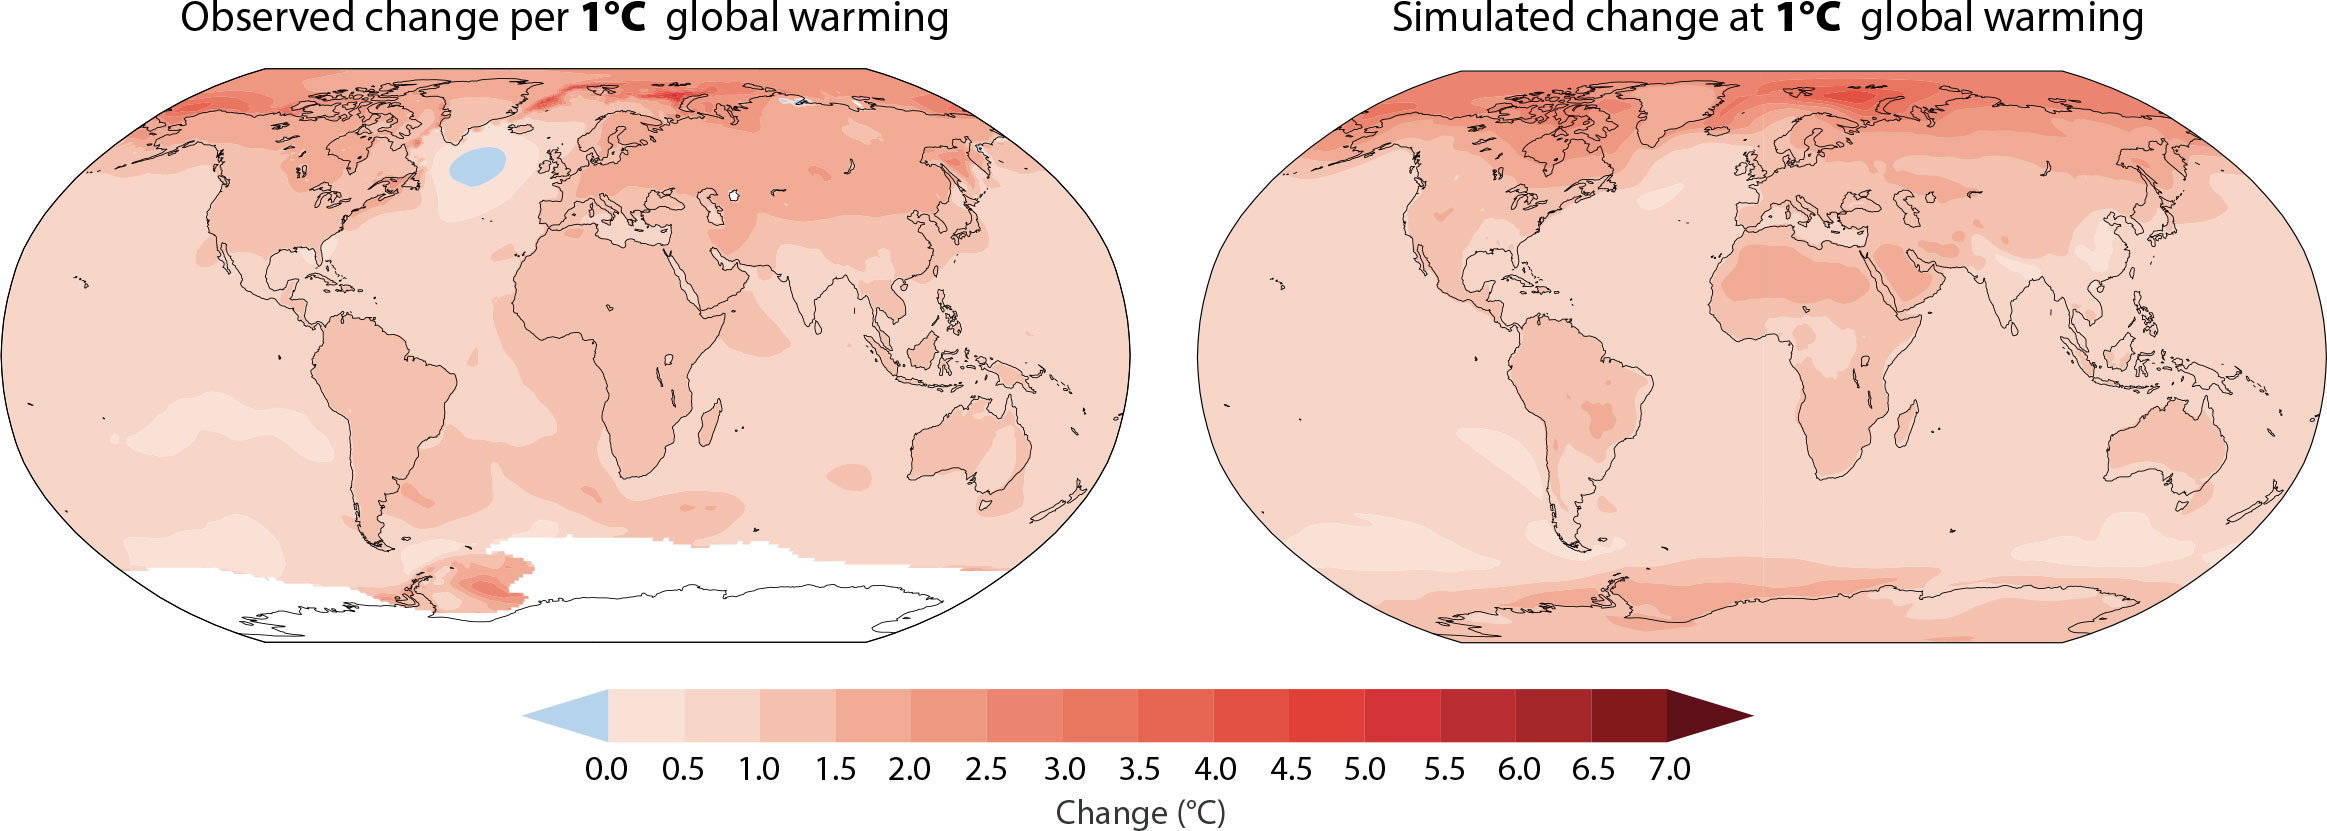
FIGURE 13. Comparison of observed and simulated annual mean surface temperature change for 1°C global warming (IPCC, 2021, Figure SPM.5). The models on average do not reproduce the observed cold blob. > High res figure
|
There is in fact a substantial body of research suggesting that the AMOC is generally too stable in climate models. One reason might be what the IPCC has called “tuning towards stability.” If a model has a too unstable AMOC that already collapses for the present climate, as has happened in a number of models (e.g., Manabe and Stouffer, 1988), the model will be “repaired” (i.e., improved to better reflect reality). But if the AMOC is too stable, that model will not look wrong because the present-day climate is correctly reproduced.
Another problem is even featured in the 2004 Hollywood blockbuster The Day After Tomorrow, where the scientist Jack Hall (Dennis Quaid) says: “No one has taken into account how much freshwater is being dumped into the ocean because of melting polar ice! I think we’ve hit a critical desalinization point.” Until now, most climate models have not incorporated an interactive Greenland Ice Sheet (which has its own tipping point; e.g., Robinson et al., 2012) and neglect its growing meltwater input.
This “critical desalinization point” is, of course, Stommel’s tipping point discussed earlier, and finding out how far we are from that point is a very hard problem indeed.
Where is that Tipping Point?
One way to find the tipping point is to perform an experiment like the one shown in Figure 3. But this is very computationally expensive, and in models where it has been tried, the distance to the tipping point differs a lot. In 1996 I proposed that whether the AMOC transports freshwater out of or into the Atlantic at the latitude of South Africa determines whether it is in the bistable regime marked in Figure 3, or further away from the tipping point toward the left (Rahmstorf, 1996). Other studies have supported this idea, and observational data suggest the real AMOC is in the bistable regime, meaning relatively close to the critical point. In contrast, in most models, the AMOC is in the monostable regime, far away from the tipping point (see the review by Weijer et al., 2019). The reason is apparently subtle biases in the Atlantic salinity distribution in the models. This salinity distribution can be nudged toward more realistic, observed salinity values, rather than letting the salinity evolve freely under the influence of computed rainfall, evaporation, and ocean currents. When this was done in a climate model, the AMOC collapsed in a scenario of doubling CO2 concentration, while it remained stable in the original unadjusted model (Liu et al., 2017).
Given the limitations of current climate models, some researchers have turned to methods borrowed from nonlinear physics to look for early warning signals of an approaching tipping point in observational data. These are based on the fact that in a “noisy” system like climate, such parameters as AMOC’s strength randomly “wiggle around” a bit under the influence of stochastic (random) variations, such as the weather. But when the system is close to a tipping point, the forces that push it back to its stable equilibrium get progressively weaker—so the system takes longer to swing back. This is called “critical slowing down.”
Several studies have analyzed AMOC data in that light. Boers (2021) analyzed four temperature and four salinity data series that have been linked to AMOC strength and concluded there is “strong evidence that the AMOC is indeed approaching a critical, bifurcation-induced transition.” In another study, Michel et al. (2022) used 312 paleoclimatic proxy data series going back a millennium and found a “robust estimate, as it is based on sufficiently long observations, that the Atlantic multidecadal variability may now be approaching a tipping point after which the Atlantic current system might undergo a critical transition.” In 2023, Danish researchers made news headlines with their “warning of a forthcoming collapse of the AMOC,” starting any time between 2025 and 2095 and most likely around the middle of this century (Ditlevsen and Ditlevsen, 2023). A recent study by the Dutch group at Utrecht University—one of the world’s leading research groups on AMOC stability—introduced a “new physics-based early warning signal [which] shows AMOC is on tipping course” (van Westen et al., 2024).
All of these predictions have their limitations—for example, changes in the variability might conceivably have other reasons than an approaching tipping point. But the fact that all these studies, using different methods, point in the same direction, toward a risk that is much larger and earlier than we had thought until a few years ago, is a major concern. My assessment of these early warning signal studies is that by the time they can provide a reasonably reliable warning of an impending AMOC tipping, it will be too late to prevent it. In this situation, the only responsible policy reaction is to be guided by the precautionary principle (i.e., the responsibility to protect the public from harm when scientific investigation has found a plausible risk).
To some extent, tipping may even depend on the vagaries of weather. In NASA’s climate model, in 10 simulations using the same “middle-of-the-road” greenhouse warming scenario (SSP2–4.5) with under 3°C global warming, the AMOC collapses in two but recovers after significant weakening in eight; the difference is merely stochastic internal variability (Romanou et al., 2023). This is also part of the nature of tipping points.
Apart from a full shutdown of the AMOC, there is still the second type of tipping point to consider, the one where convection shuts down in one region. That happens in a surprising number of climate models, and so far hasn’t gotten the public attention it deserves. The first documented case, the British Hadley Centre model, was published in 1999 (Wood et al., 1999). Of the latest model generation (CMIP6), in four out of the 35 models, subpolar gyre convection breaks down—and all four are in the group of the 11 best models in terms of reproducing the vertical density profiles in the subpolar gyre (Swingedouw et al., 2021). That’s in 36% of those high-quality models. In the previous model generation (CMIP5), that number was 45%. What’s more, it typically happens as soon as the year 2040 and for moderate emission scenarios—even without properly accounting for Greenland melt. Thus, a collapse of convection in the subpolar gyre, resulting in rapid AMOC weakening and abrupt regional cooling, must be considered a high risk urgently requiring attention.
What does this mean for our future? Let’s first look at the impacts of an AMOC slowdown or collapse, and then discuss the implications.
How Bad Would It Be?
The current cold blob is already affecting our weather, though not in the way that might be expected: a cold subpolar North Atlantic correlates with summer heat in Europe (Duchez et al., 2016). The cooling of the sea surface is enough to influence the air pressure distribution in a way that encourages an influx of warm air from the south into Europe. For example, in summer 2015, the subpolar Atlantic was the coldest since records began in the nineteenth century—while Europe suffered a strong heatwave. Subsequent study has shown that heatwaves are increasing three to four times faster in Europe than in other regions of the Northern Hemisphere, related to changes in the jet stream that may well be influenced by the cold blob (Rousi et al., 2022).
Several studies show that if the AMOC weakens, sea levels on the American northeast coastline will rise more sharply (e.g., Levermann et al., 2005; Yin et al., 2010). The Coriolis force pushes moving water, in this case, in the Gulf Stream, to the right, away from the American coast. When the Gulf Stream weakens, less water is moved northward, causing water levels to rise inshore of the Gulf Stream, with models projecting a 15–20 cm rise by 2100 from this effect alone, in addition to other causes of rising seas. Coastal erosion, the frequency of nuisance flooding, and extent of storm surge damage will substantially increase.
A collapse of convection in the subpolar gyre would significantly magnify these problems. Figure 14 shows the expected temperature change in this case. It is not so much the absolute change, but the changes in temperature contrast between neighboring regions—here, the cold ocean relative to the adjacent warm land masses—that will greatly change the dynamics of the weather, as temperature gradients drive weather activity in ways we can’t foresee in detail. Even this limited oceanic change will shift tropical rainfall belts, though not by as much as a full AMOC shutdown.
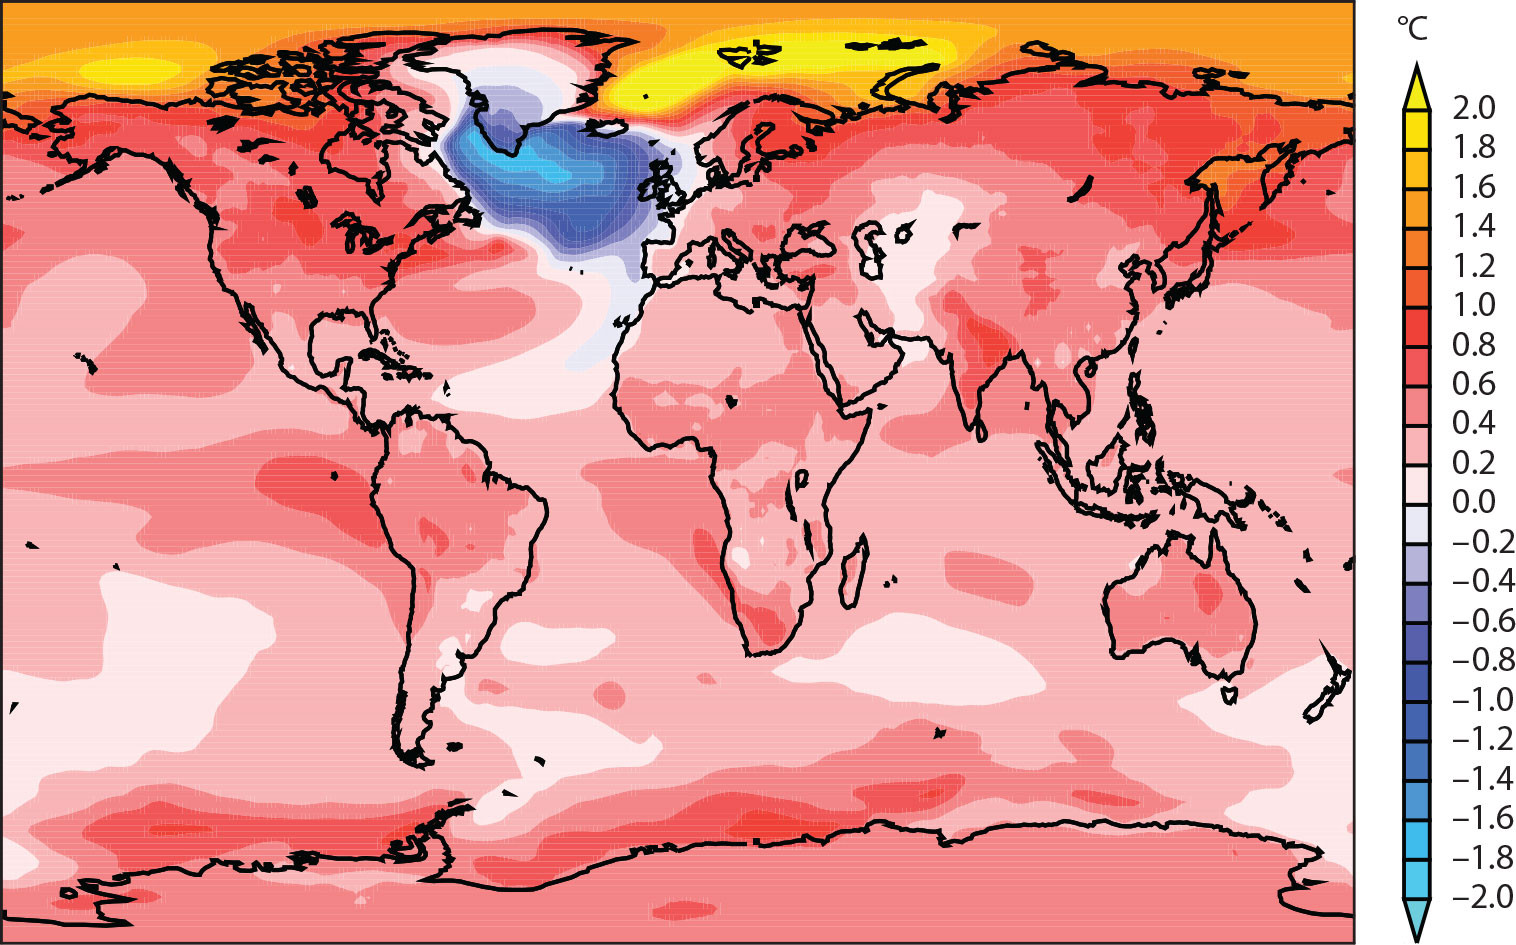
FIGURE 14. Temperature changes in the model-mean before and after a collapse of convection in the subpolar gyre region are plotted here. From Swingedouw et al. (2021). > High res figure
|
A full shutdown of the AMOC would have truly devastating consequences for humanity and many marine and land ecosystems. Figure 15 shows the model of Liu et al. (2017) after a doubling of CO2, with an AMOC collapse caused by this CO2 increase. The cold air temperatures then expand to cover Iceland, Britain, and Scandinavia. The temperature contrast between northern and southern Europe increases by a massive 4°C, likely with major impact on weather, such as unprecedented storms.
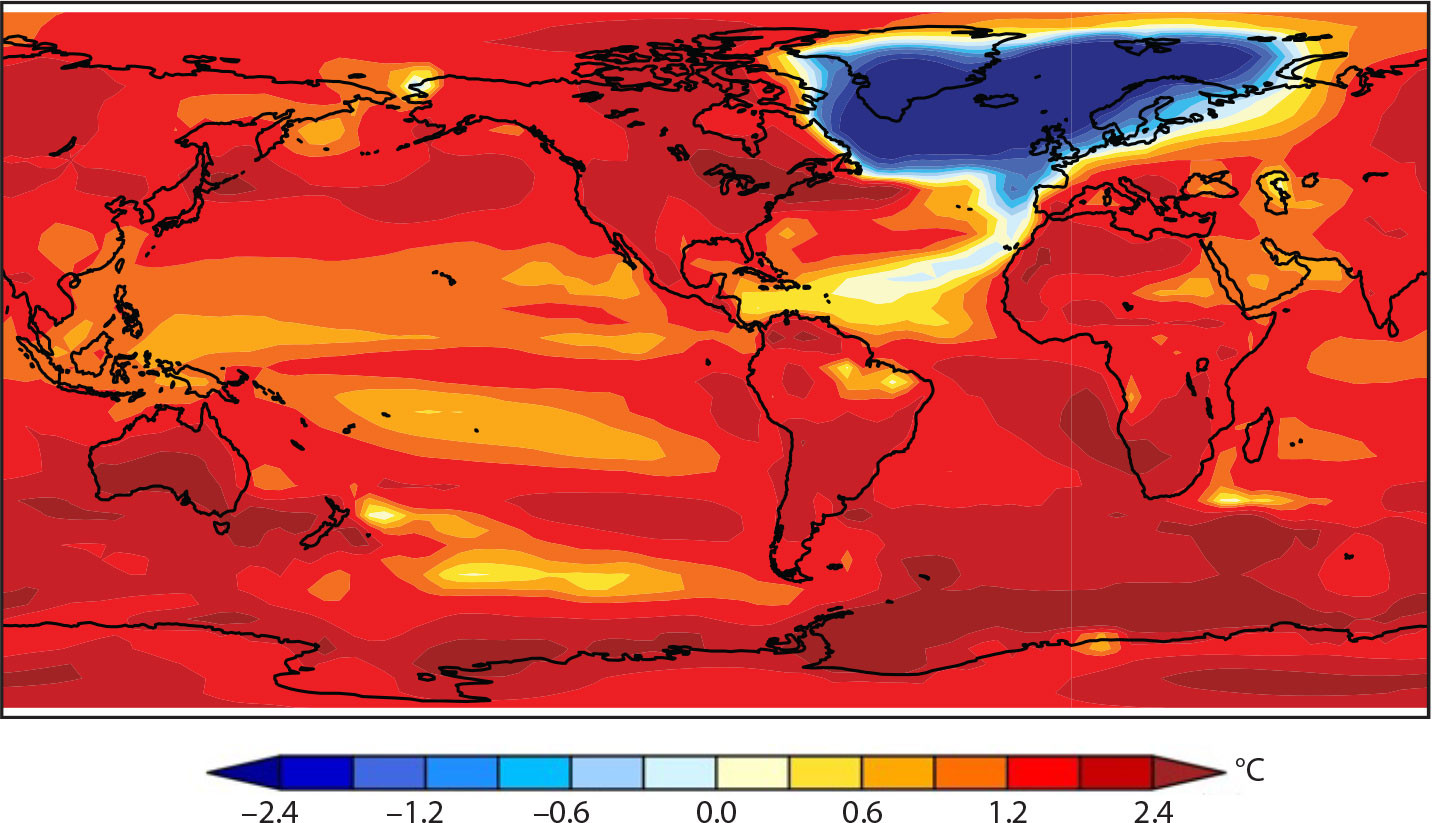
FIGURE 15. Annual-mean near-surface air temperature change resulting from a CO2 doubling and AMOC breakdown. While Earth is much warmer, the northern Atlantic region has become colder. In winter, the cooling there is much larger still. From Liu et al. (2017). > High res figure
|
Figure 16 shows the precipitation changes in this model. As we have seen in the paleoclimate data for Heinrich events, major precipitation shifts in the tropics would likely cause drought problems in the northern tropics of America as well as Asia. Seasonal changes will be even larger than these annual mean changes. Other simulations predict a significant increase in winter storms in Europe and a “strong reduction of crop yield and pasture” there (Jackson et al., 2015).
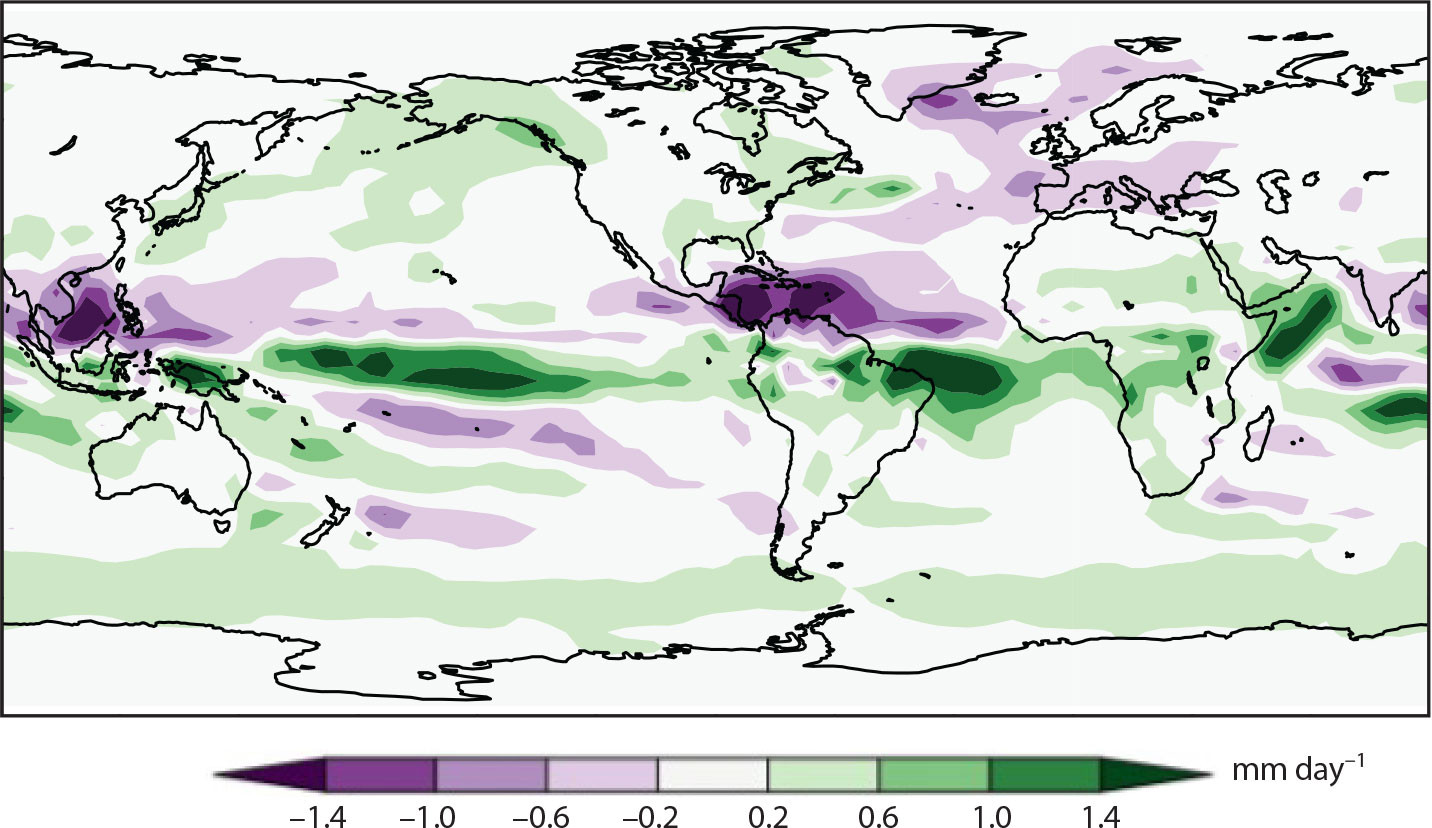
FIGURE 16. Annual-mean precipitation change resulting from a CO2 doubling and AMOC breakdown. Most concerning is the southward shift in tropical rainfall belts and a generally drier Europe. From Liu et al. (2017). > High res figure
|
The IPCC summarized the impacts: “If an AMOC collapse were to occur, it would very likely cause abrupt shifts in the regional weather patterns and water cycle, such as a southward shift in the tropical rain belt, and could result in weakening of the African and Asian monsoons, strengthening of Southern Hemisphere monsoons, and drying in Europe” (IPCC, 2021, TS p. 73). Some further consequences include major additional sea level rise especially along the American Atlantic coast, reduced ocean carbon dioxide uptake, greatly reduced oxygen supply to the deep ocean, and likely ecosystem collapse in the northern Atlantic.
Implications: Uncertainty Is Not Our Friend
The risk of a critical AMOC transition is real and very serious, even if we cannot confidently predict when and whether this will happen. We have already left behind the stable Holocene climate in which humanity has thrived (Osman et al., 2021), and the latest IPCC report warns us that beyond 1.5°C of global warming, we move into the realm of “high risk” with respect to climate tipping points (IPCC, 2023).
Also at risk is the Southern Hemisphere equivalent of the northern Atlantic deep-water formation: the Antarctic bottom-water formation. A recent study by Australian researchers concluded that the increasing meltwater inflow around Antarctica is set to dramatically slow down the Antarctic overturning circulation, with a potential collapse this century (Q. Li et al., 2023). That will slow the rate at which the ocean takes up CO2 (hence, more will accumulate in the atmosphere), and it will reduce the oxygen supply for the deep sea.
A full AMOC collapse would be a massive, planetary-scale disaster. We really want to prevent this from happening.
In other words: we are talking about risk analysis and disaster prevention. This is not about being 100% or even just 50% sure that the AMOC will pass its tipping point this century; the issue is that we’d like to be 100% sure that it won’t. That the IPCC only has “medium confidence” that it will not happen this century is anything but reassuring, and the studies discussed here, which came after the 2021 IPCC report, point to a much larger risk than previously thought.
The Global Tipping Points Report 2023 was published in December 2023, a 500-page effort by 200 researchers from 90 organizations in 26 countries (Lenton et al., 2023). Its summary conclusion reads: “Harmful tipping points in the natural world pose some of the gravest threats faced by humanity. Their triggering will severely damage our planet’s life-support systems and threaten the stability of our societies.”
For the AMOC and other climate tipping points, the only action we can take to minimize the risk is to phase out fossil fuel use and stop deforestation as fast as possible. If we can reach zero emissions, further global warming will stop within years, and the sooner this happens the smaller the risk of passing devastating tipping points. It would also minimize many other losses, damages, and human suffering from “regular” global warming impacts (e.g., heatwaves, floods, droughts, harvest failures, wildfires, sea level rise), which are already happening all around us even without the passing of major climate tipping points.
As another Climate Tipping Points report published in December 2022 by the Organisation for Economic Co-operation and Development (OECD) concludes: “Yet, the current scientific evidence unequivocally supports unprecedented, urgent and ambitious climate action to tackle the risks of climate system tipping points” (OECD, 2022).
It would be irresponsible, even foolhardy, if policymakers, business leaders, and indeed the voting public continue to ignore those risks.