Introduction
Western boundary currents (WBCs) such as the East Australian Current (EAC) are the heat engines of the ocean, transferring heat from low to high latitudes. They flow along the eastern sides of continents, often adjacent to large population centers. For example, 80% of Australia’s population live along the east coast and are thus impacted by the EAC. WBCs impact our weather, climate, and the distribution and abundance of fish and other marine organisms. Therefore, changes and variations in WBCs impact our seafood security. In addition, WBCs are warming at a rapid rate (Li et al., 2022), yet due to their dynamic natures (swift currents that shed numerous eddies), WBCs are difficult to measure and model.
Satellite sensors provide observations of sea surface height and surface ocean temperature, while the Argo float program provides subsurface ocean data—but only for the open ocean. By design, Argo floats do not profile over continental shelves, and they are also advected rapidly out of WBCs. Hence, despite the 4,000 floats profiling globally, their data coverage remains relatively sparse in WBC regions. Using fishing vessels to crowdsource research-quality data is an effective way to collect valuable ocean information cost-effectively where the data matter most (Jakoboski et al., 2024).
Additionally, fishing vessels provide the opportunity for widespread data collection in coastal regions and over the continental shelf, and thus provide opportunities to fill data gaps (Van Vranken et al., 2023; Jakoboski et al., 2024) on a broad scale. Programs using fishing vessels for ocean data collection have thus been gaining in popularity worldwide, and FishSOOP (Fishing Vessels as Ships of Opportunity Program) is Australia’s contribution to the international Fishing Vessel Ocean Observing Network (Van Vranken et al., 2023).
FishSOOP
FishSOOP is a collaborative project between research and industry. The proof-of-concept trial was co-funded by the Fisheries Research and Development Corporation (FRDC) and Australia’s Integrated Marine Observing System (IMOS) to install temperature sensors on commercial fishing vessels off southeastern Australia. This region was chosen because of the variety of fishing methods used and because it is where the EAC is extending southward, warming the ocean surface at a rate four times the global average (Li et al., 2022). It is also where climatic extreme events, such as marine heatwaves (MHWs), are critically impacting fisheries. The project quickly expanded to all coastal states and territories of Australia, with co-investment from several industry partners (Figure 1c,e).
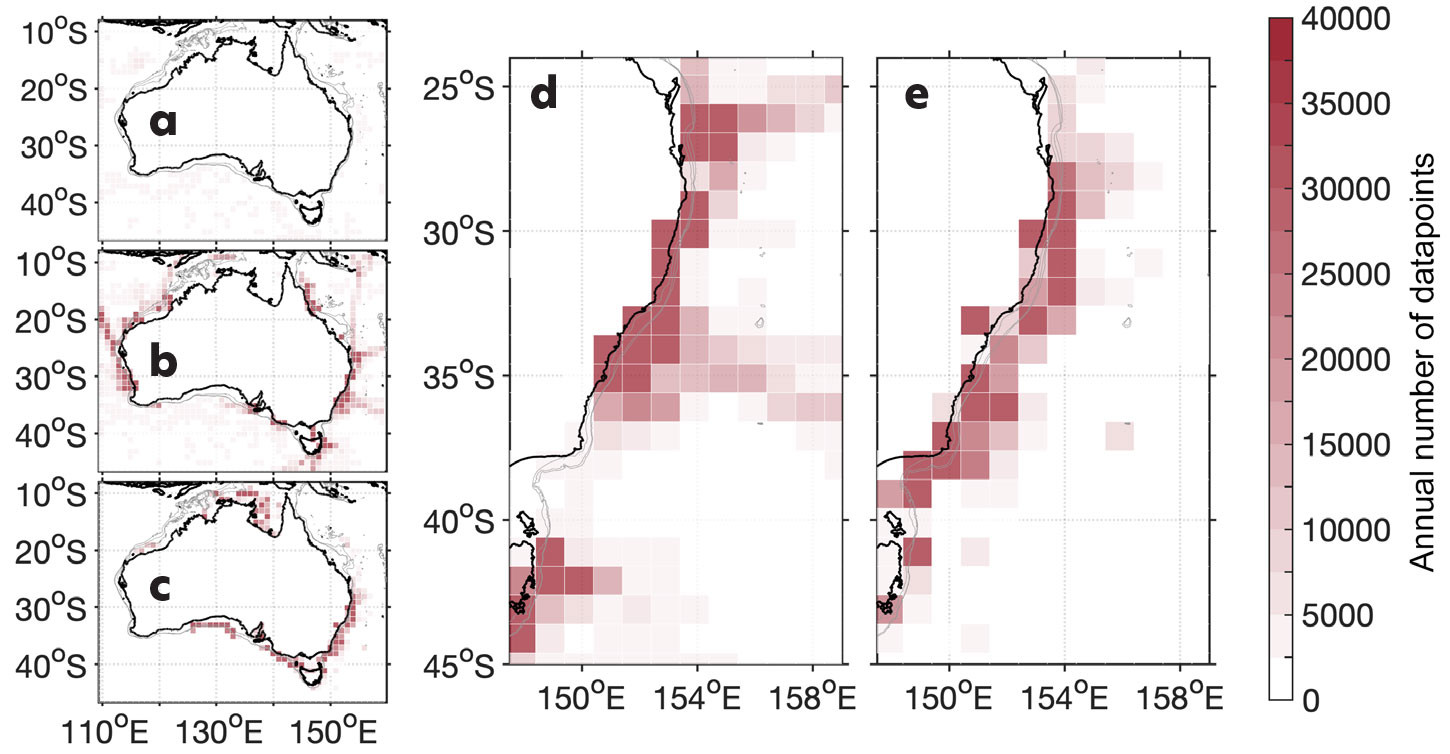
FIGURE 1. Annual average quantity of subsurface data points around Australia gridded to 1° resolution from (a) Argo, and (b) all available profiling data sources. (c) Quantity of data points from FishSOOP over a year (from August 2023 to July 2024) on a 1° resolution grid. (d) Annual average for all the available subsurface profiling sources of data available in the EAC region. (e) One year of FishSOOP data. The annual averages for the observations are from January 2000 to December 2022, drawn from the World Ocean Database (NOAA). > High res figure
|
ZebraTech’s Moana TD200 and TD1000 sensors and data transmission deck units were chosen for this project because the system, co-designed with fishers and purpose-built for deployment on fishing vessels, is extremely robust and easy to install and use; full sensor specifications and the data pathway are described in Jakoboski et al. (2024). The Moana sensors provide ±0.05°C initial accuracy with 0.001°C resolution for temperature, and ±0.5% initial accuracy with 0.1m resolution for the pressure sensor. The sensors send the data to the deck unit via Bluetooth, which in turns sends the data to a cloud server via a mobile network. When out of cell phone range, the data are sent when the vessel is within range again. There is an option to connect the deck unit to the vessel Wi-Fi, which is preferable for vessels with extended operations further offshore. The data are returned in real time to the fishers who collected them, and an anonymized version is sent for open access archival on the Australian Ocean Data Network (AODN), currently accessible through the AODN THREDDS catalog.
During the trial phase of the program, 34 vessels were instrumented around Australia with a total of 53 sensors on a wide range of fishing gear types: prawn trawl, gillnet, demersal and pelagic longline, traps and pots, fish trawl, squid jig, and scallop dredge. Most vessels deployed one sensor, but some vessels deployed multiple sensors, either on different gear types (e.g., traps or pots) or spread over the length of the gear (e.g., longline). The trial yielded more than 3.3 million data points (from ~31,000 profiles) from the sea surface to 1,214 m depth, considerably expanding existing data records around Australia, including in waters previously poorly observed (Figure 1).
Filling Observational Gaps
Among WBCs, the EAC is considered fairly well observed (Ayoub et al., 2024) due to a concerted effort over the past 15 years by IMOS. This effort includes a network of 11 shelf moorings along the east coast of Australia from 28°S to 44°S, two high frequency (HF) radar systems (since 2012), more than 60 glider missions, repeat expendable bathythermograph (XBT) lines, Argo floats, surface drifters, and 10 years of deep transport observations at 28°S. And yet there are still vast data gaps along the length of this extensive coastline.
While the sustained moorings provide high resolution time series of climate-quality data, they are a sparse network comprised of 11 single points on the EAC shelf. Conversely, gliders provide high density data, but there are only four to five missions per year across the entire length of the EAC, and they are comparatively costly (Figure 2). Observations from FishSOOP complement this effort by providing cost-effective broad-scale, high-resolution, high-quality data across the shelf and upper slope in near-real time throughout the entire year (Figures 1d and 2).
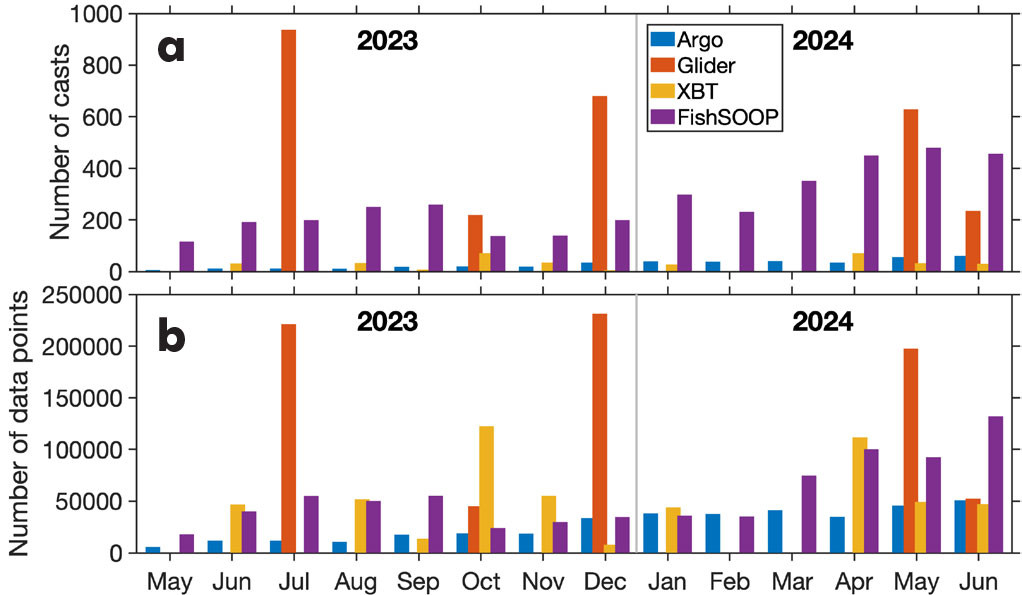
FIGURE 2. Comparison of (a) the quantity of casts, and (b) the quantity of data points collected by the FishSOOP program and other sources of near real time data in the East Australian Current (EAC). The downcasts and upcasts are counted separately in the number of casts. The EAC region is defined as shown in Figure 1d and e (24°S to 45°S and 147°E to 159.6°E. Argo, glider, and expendable bathythermograph (XBT) data were sourced from Australia’s Integrated Marine Observing System (IMOS). > High res figure
|
Over the trial period, we deployed 35 Moana TD sensors from 16 vessels within the EAC region. We have surpassed the quantity of real-time data collected within the EAC region by all other sources combined within the same period (Figure 2). Due to annual variability in fishing effort, some months had more casts by gliders (e.g., July 2023, December 2023, and May 2024), but overall from May 2023 to June 2024 there were 2,699 casts from gliders (downcasts and upcasts) and 3,780 casts from the FishSOOP program (downcasts and upcasts; Figure 2a). After just 14 months of operation, we have filled extensive data gaps in the EAC and along the adjacent shelf.
Case Study: Fishing Industry Engagement
MHWs are discrete and quantifiable events of anomalously warm water above the 90th percentile for at least five consecutive days as defined by Hobday et al. (2016). Previous studies have shown that sea surface temperature (SST) data are not sufficient to predict the occurrence, duration, or intensity of MHWs below the surface (e.g., Schaeffer and Roughan, 2017). This is particularly true in regions of high variability, such as the warming shelf region of the EAC. However, MHWs are having a significant impact on the fishing industry and catchability of fish (Smith et al., 2023). One key aspect of FishSOOP is that the data are returned to the fishers in near-real time to inform fishing effort and potentially allow more efficient use of resources (e.g., fuel and time).
In January–February 2024, a severe MHW occurred in the northern EAC (Figure 3a–c) where a longline tuna vessel engaged in the FishSOOP program was actively fishing. This MHW lasted roughly three months, likely driven by anomalous advection of heat by the EAC, with SST anomalies showing that it was a strong MHW. Due to significant cloud cover, Figure 3a–c shows sea surface temperature only for February 4, making it hard to see the overall conditions for the vessel’s remaining stay in the region (Figure 3d–f). However, FishSOOP data provided the first look below the surface where fishing was actively occurring. The temperature recorded was >28°C down to 80 m depth (Figure 3d). Over the following week, the vessel headed 500 km south while continuing to deploy fishing gear with the sensors attached until they reached colder waters. The sensor data clearly captured the temperature structure throughout the water column and showed the change in thermocline depth with latitude (Figure 3d,e). Finally, on February 14, the vessel encountered a cyclonic eddy inshore of the EAC separation where waters deeper than 60 m were <25°C (Figure 3f). By monitoring the near-real-time subsurface conditions, fishers were able to adjust the location and depth at which their fishing gear was deployed, seeking conditions that might optimize their catch rates. The sensors also alleviate the issue of patchy satellite SST data due to cloud cover. This highlights the value of obtaining direct observational data in real time where fishing occurs. The next step is to understand the relationship between ocean temperature at depth and catch composition and rates, and to provide ocean modeling products that might help improve fishing effort.
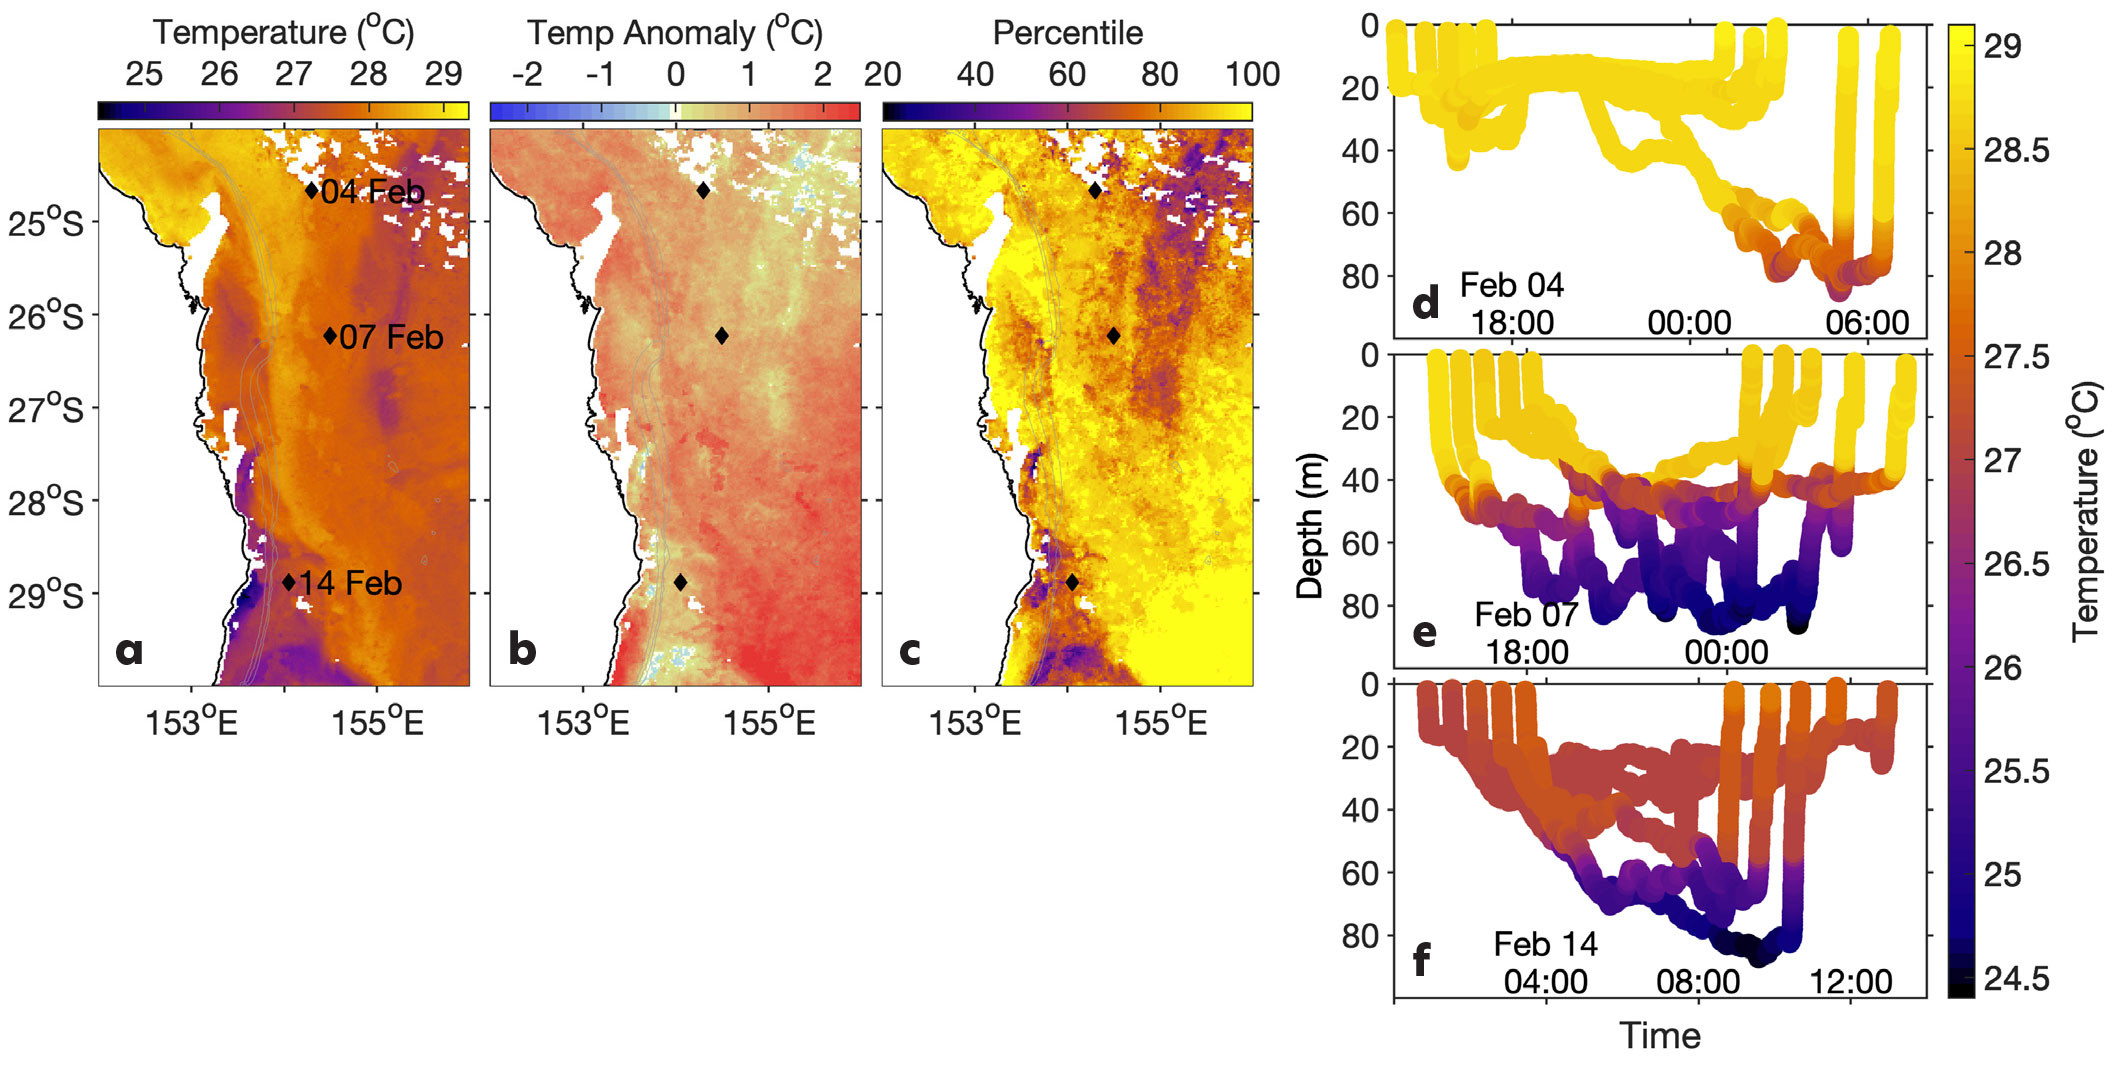
FIGURE 3. Maps of (a–c) sea surface temperature (SST) and (d–f) subsurface temperature. Specifically, these show (a) satellite-derived SST on February 4, 2024, (b) SST anomaly, and (c) SST percentile using the GHRSST-L3S satellite product with a six-day composite centered on February 4, 2024. The climatology for the SST anomaly and SST percentile comparison is calculated from 1992 to 2016. The diamonds in a–c correspond to the location of a longline tuna vessel fitted with five Moana sensors, and corresponding subsurface temperature profiles are shown for (d) the 4th, (e) 7th, and (f) 14th of February 2024. > High res figure
|
Fine-Scale/Subsurface Data to Improve Ocean Models
Ocean prediction requires the combination of numerical models and ocean observations, referred to as data assimilation, to correctly represent the timing and locations of fine-scale ocean features such as fronts and eddies. Here we present an example of surface and subsurface ocean representation from a data-assimilating model (part of the South East Australian Coastal Ocean Forecast System, SEA-COFS) along with observations from FishSOOP sensors (Figure 4). We compare a complex example of the western side of an anticyclonic eddy in the EAC adjacent to the continental shelf. The model is based on the data-assimilating Regional Ocean Modeling configuration of the EAC system (described in Kerry et al., 2016) and assimilates daily gridded satellite-derived sea surface height (SSH) data from Archiving, Validation, and Interpretation of Satellite Oceanographic Data (AVISO), satellite-derived SST observations and temperature and salinity from Argo profiling floats. The Moana sensor observations are not yet assimilated and represent independent observations.
The EAC separates from the coast at 32°S and wraps around a large anticyclonic eddy, while cold water is entrained between the separating EAC and the core of the anticyclonic eddy. The SST observations (Figure 4d) reveal a cold filament (east of the EAC core from 32°S to 33°S), but cloud coverage limits the availability of SST data extending south toward the vessel track. The subsurface observations from the Moana sensor (Figure 4f) indicate that the cold filament does indeed extend to the vessel track, showing shoaling of the isotherms associated with the cold filament between 153.5°E and 154°E. The model captures the cold-water entrainment (Figure 4c), but the model filament does not extend as far south as it does in reality; SST data that could resolve the filament are lacking, as are subsurface (Argo) data. The subsurface observations from the Moana sensor reveal both the complex structures of the front between the EAC and the shelf waters and the entrained cold filament between the EAC and the eddy. These comparisons highlight the potential value of subsurface observations from FishSOOP for improving model estimates below the surface, compared to existing models that typically assimilate satellite-derived surface observations and (usually sparse) profiles from Argo and XBTs. Model estimates of complex subsurface features are likely to benefit most.
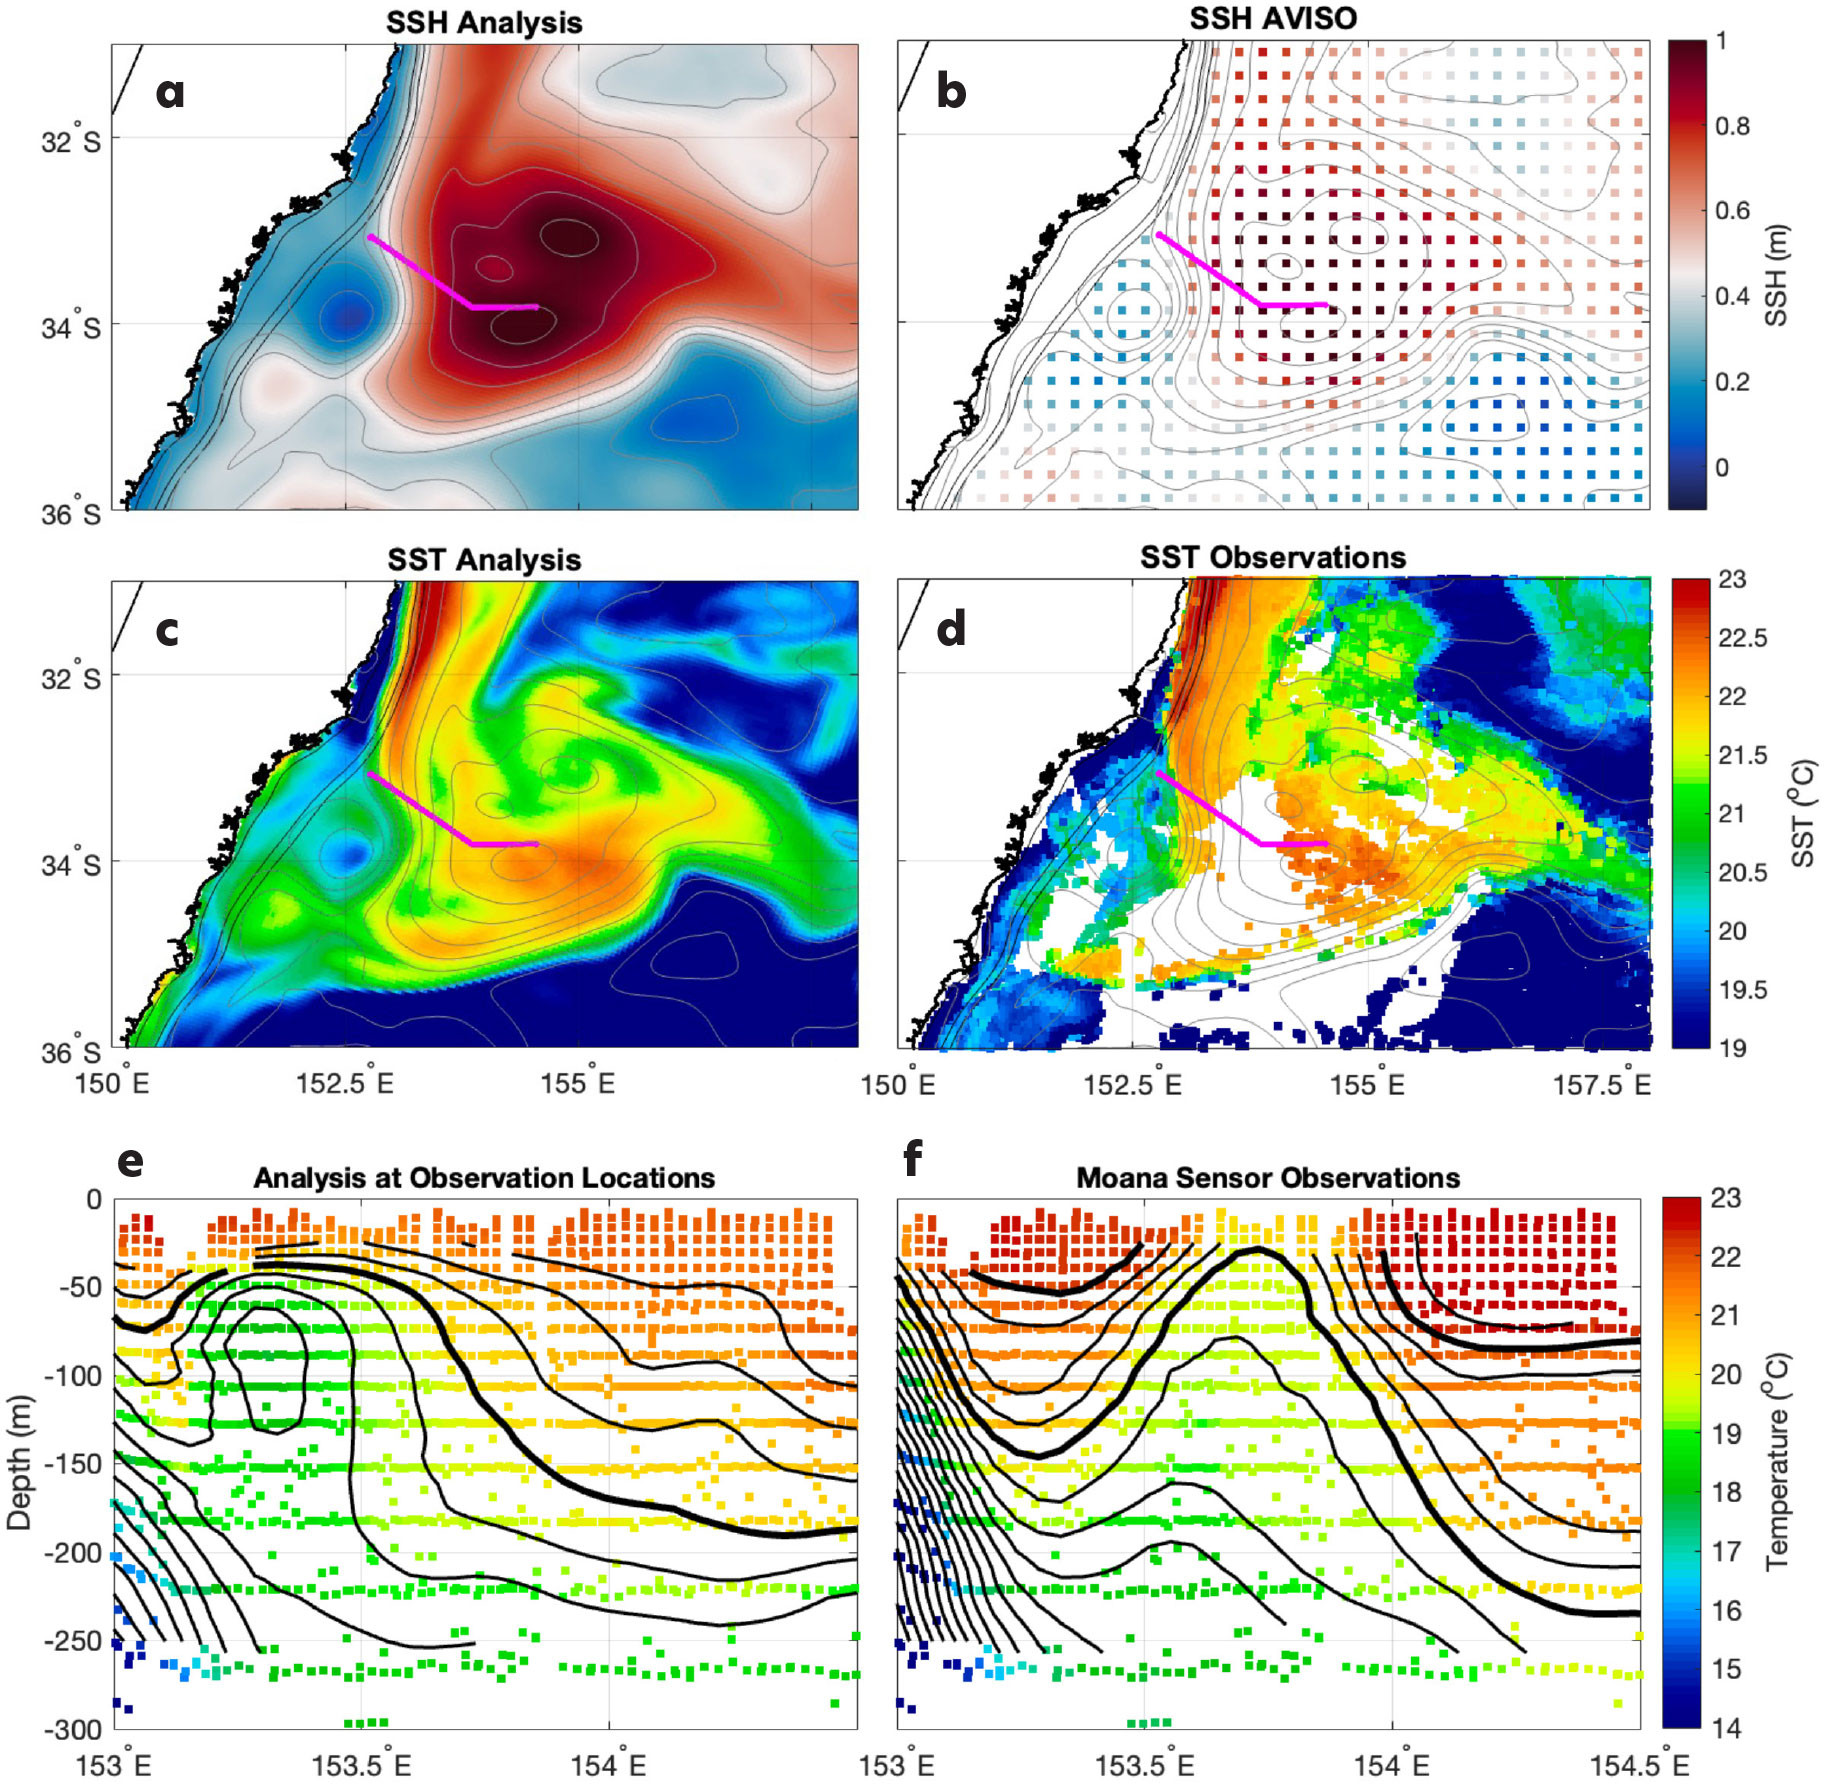
FIGURE 4. A comparison of a data-assimilating model solution with independent subsurface data from Moana sensors is plotted for October 12, 2023. (a) Modeled sea surface height (SSH). (b) AVISO SSH data. (c) Modeled sea surface temperature (SST). (d) SST observations. The magenta lines in panels a–d represent the path of the vessel from which the sensor was deployed. Black lines represent the 100 m, 400 m, and 1,000 m model bathymetry contours. (e) Model values at Moana sensor observation times and locations. (f) Moana sensor observations representing sections across the magenta lines in panels a–d. Bold black lines represent 20°C and 22°C isotherms, and the lighter black lines show isotherms separated by 0.5°C. > High res figure
|
Summary
The FishSOOP project highlights the benefit of research-industry collaboration and has proven to be a reliable and cost-effective way to monitor the EAC and to fill in gaps in observations of Australian shelf and upper slope waters. By returning the data to the fishers in near-real time, we provide them with information that may enable them to target fish more efficiently while both collecting valuable subsurface data to improve ocean forecasting and providing a view of the EAC’s three-dimensional temperature structure. This information is even more important and valuable for regions of high variability such as a WBC. Elsewhere, the value of including subsurface ocean observations in a regional model is clearly shown in depictions of shelf regions around New Zealand (Kerry et al., 2024) where there are considerable improvements in bottom temperature and heat content representation in shelf seas upon assimilation of FVON data.
Working with our international collaborators as part of FVON, we have been able to successfully build an Australia-wide operational program in a year. FVON has been endorsed by the UN Ocean Decade and as an emerging network in the Global Observing System, highlighting the global interest and need for such programs. FishSOOP data will also be assimilated into the SEA-COFS model, also endorsed by the UN Ocean Decade, and the project is a Global Ocean Observing System CoastPredict pilot program.
As FishSOOP grows, we are working with manufacturers to develop new sensors, notably a 2,000 m sensor and a fit-for-purpose, low-cost, hands-free salinity sensor. We are also looking to further develop tools and visualization methods useful to fishers and ocean forecasters for returning the data to them in real time. This will ensure effective, mutually beneficial collaboration for partnered growth to help fill ocean data gaps using informed observing system design and to sustainably manage fisheries into the future.
Acknowledgments
This work was partially supported by the Australian government through the Fisheries Research and Development Corporation (FRDC), the Integrated Marine Observing System (IMOS), the University of New South Wales (UNSW), and the Australian Research Council (ARC). FishSOOP is now part of Australia’s Integrated Marine Observing System (IMOS), enabled by the National Collaborative Research Infrastructure Strategy (NCRIS). It is operated by a consortium of institutions as an unincorporated joint venture, with the University of Tasmania as Lead Agent. We thank all the fishing industry participants who helped facilitate this work, including fleet managers, vessel skippers and crew, and Russell Hudson (Fishwell Pty Ltd), who instrumented the vessels in SE Australia. Phil Ravanello from Tuna Australia and Kylie Scales from the University of the Sunshine Coast are acknowledged for their efforts to help instrument tuna vessels in the EAC.

