INTRODUCTION
Upwelling areas—where cold, nutrient-rich waters are brought to the sea surface—have been well documented within the Indonesian Seas (Susanto et al., 2001; Wirasatriya et al., 2021). They are mainly generated by the persistence of the alongshore monsoon wind, which induces offshore Ekman mass transport and pushes the surface water mass away from the coastline to be replaced by deeper, upwelling water (e.g., Ningsih et al., 2013; Kämpf, 2015; Utama et al., 2017; Setiawan et al., 2019, 2020; Wirasatriya et al., 2020, 2021). This type of upwelling is known as monsoon-induced coastal upwelling. The decrease in sea surface temperatures (SSTs) due to coastal upwelling can reach 2°–4°C (e.g., Setiawan et al., 2019; Wirasatriya et al., 2019, 2020).
Alor Island is located at the eastern side of the Lesser Sunda Islands, with the Savu Sea to the south and the Flores Sea to the north (Figure 1a). The seas of Alor Kecil refer to the small strait between Kepa Island and Alor Kecil Village located at the western side of Alor Island. This strait is known as Mulut Kumbang. It is less than 300 m wide and approximately 800 m long (Figure 1c).
Upwelling occurs regularly in the seas of the Lesser Sunda Islands during both monsoonal seasons (Wirasatriya et al., 2021). During the southeast (northwest) monsoon, which peaks in June, July, and August (December, January, and February), coastal upwelling occurs along the southern (northern) coast of the Lesser Sunda Islands due to the intensified easterly (westerly) winds. Furthermore, there is strong internal tide generation in the seas of the Lesser Sunda Islands. The interaction of tidal dynamics and complex bathymetry (Figure 1b) produces vigorous tidal mixing that can reduce SST as much as 0.8°C during spring and neap tides in this area (Ray and Susanto, 2016, 2019; Nugroho et al., 2017; Susanto and Ray, 2022).
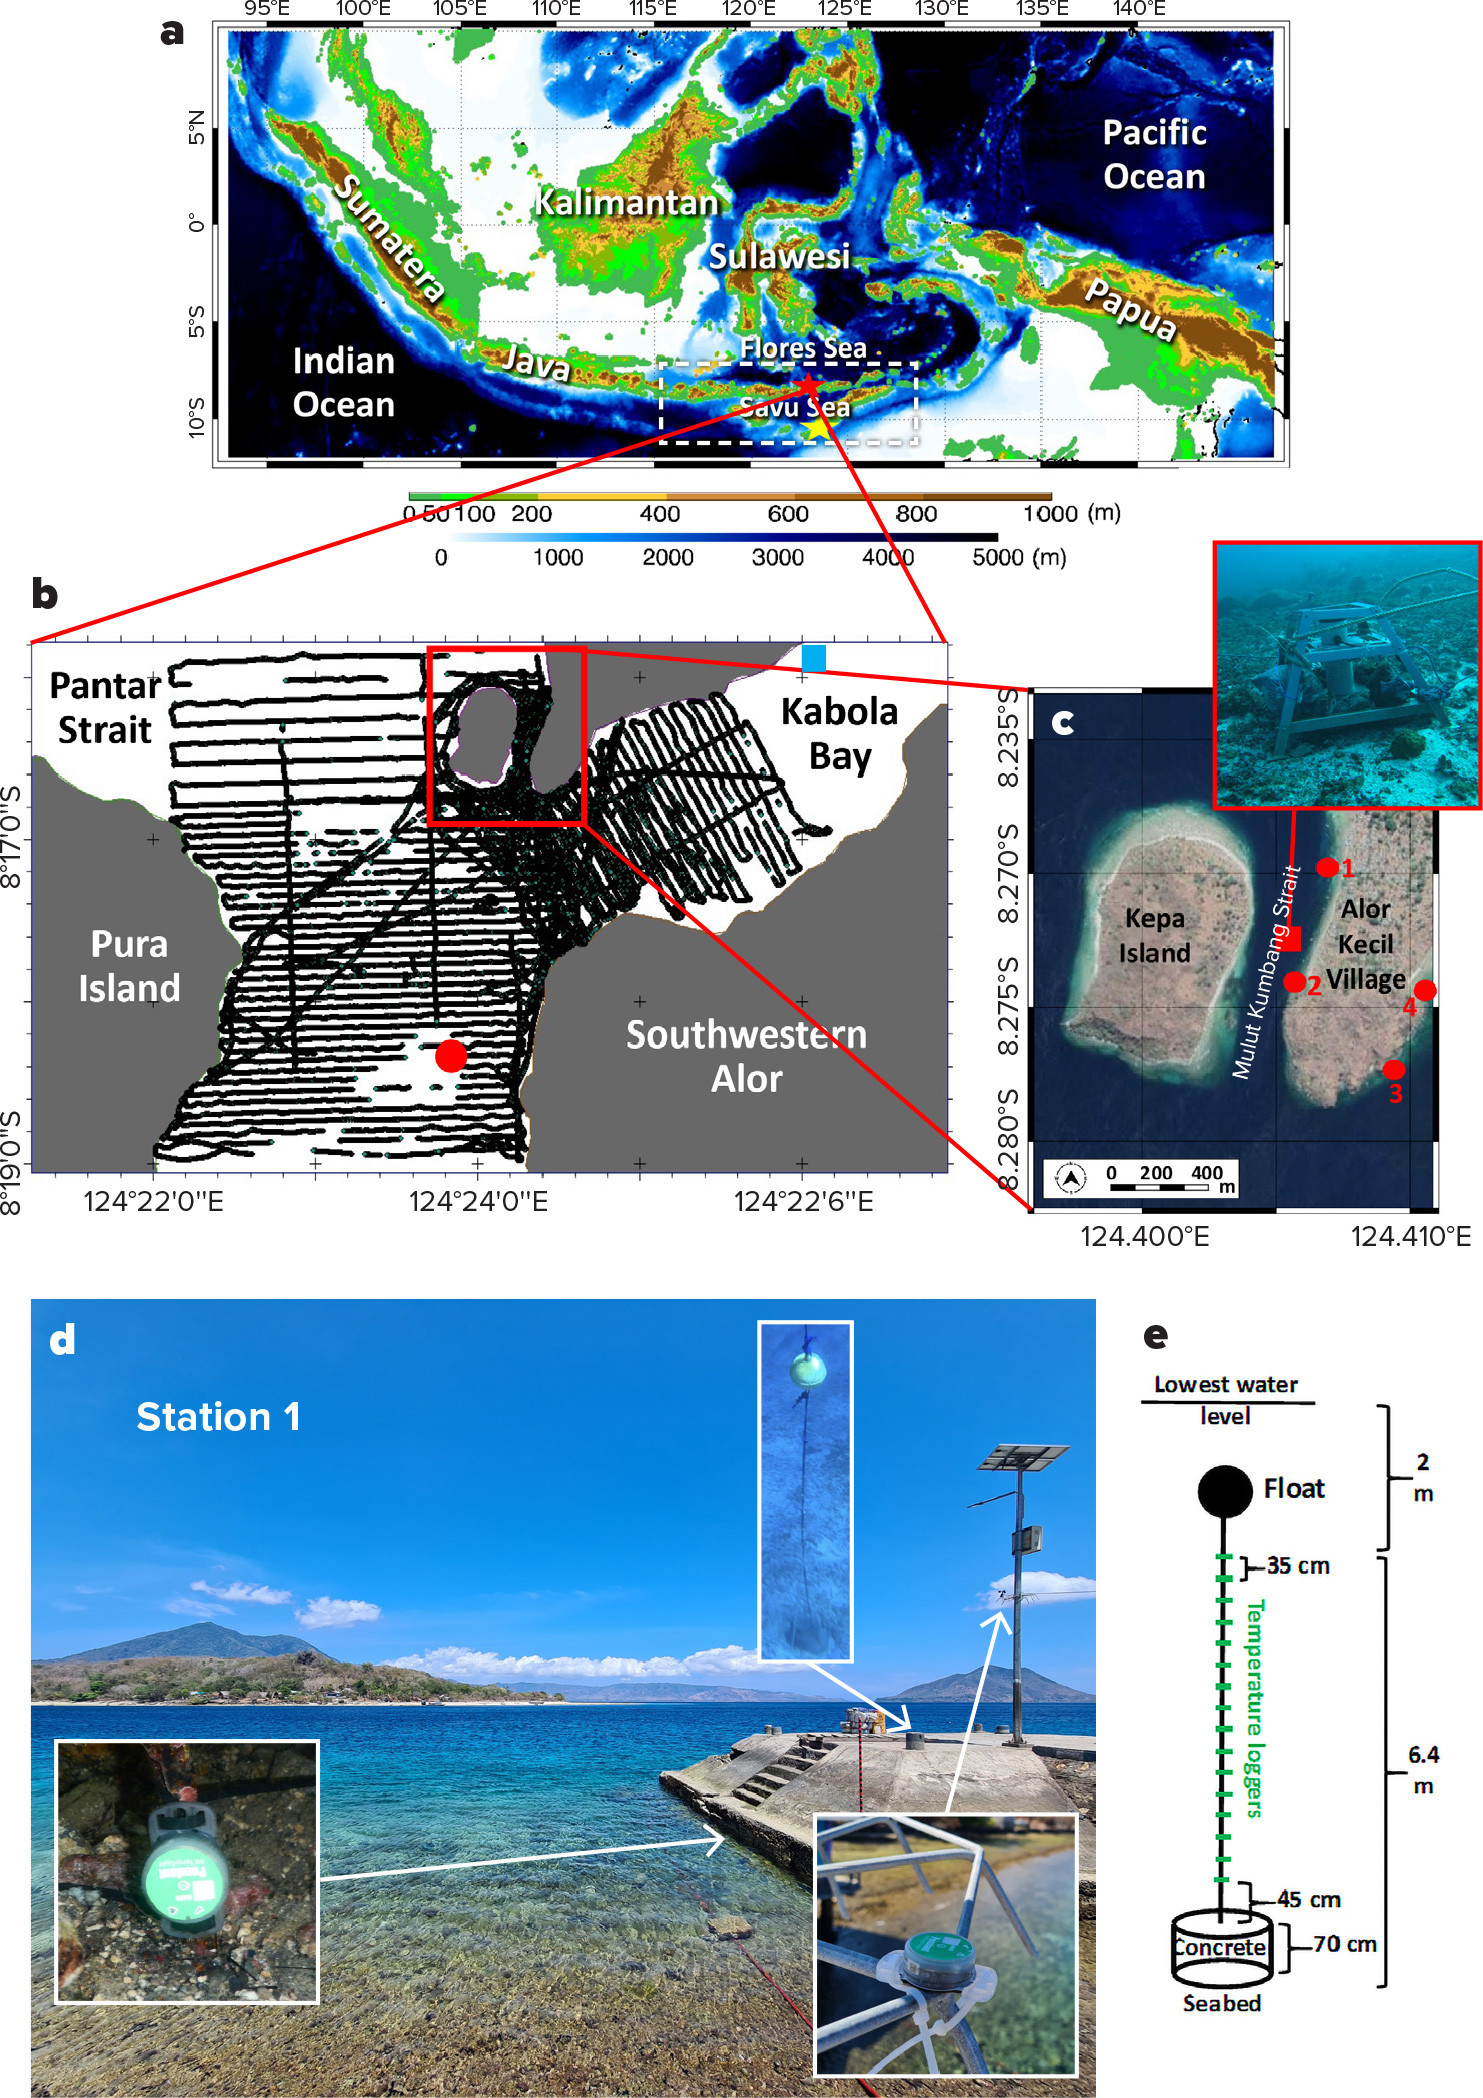
FIGURE 1. (a) Bathymetry of the Indonesian seas. The white dashed box denotes the Lesser Sunda Islands. Red and yellow stars indicate the western side of Alor Island and Kupang City, respectively. (b) The western side of Alor Island. The large red dot locates CTD surveys conducted on June 15–16, 2021, and the black lines are the tracks of a bathymetric survey conducted October 8–11, 2021. The small blue square on the upper right is the tidal station at Kabola Bay operated by the Geospatial Agency of Indonesia. (c) The seas of Alor Kecil. The red dots and square are the positions of the four temperature loggers, and the red square identifies the location of ADCP measurements. At Station 1, we also collected tide measurements, and air temperature, light intensity, and salinity data. (d) View of Mulut Kumbang Strait captured from Station 1, along with the position of the various data loggers at Station 1. (e) Schematic of the vertical temperature logger on the mooring line, consisting of 16 sensors, each 35 cm apart, deployed at ~8 m depth below the lowest water level. > High res figure
|
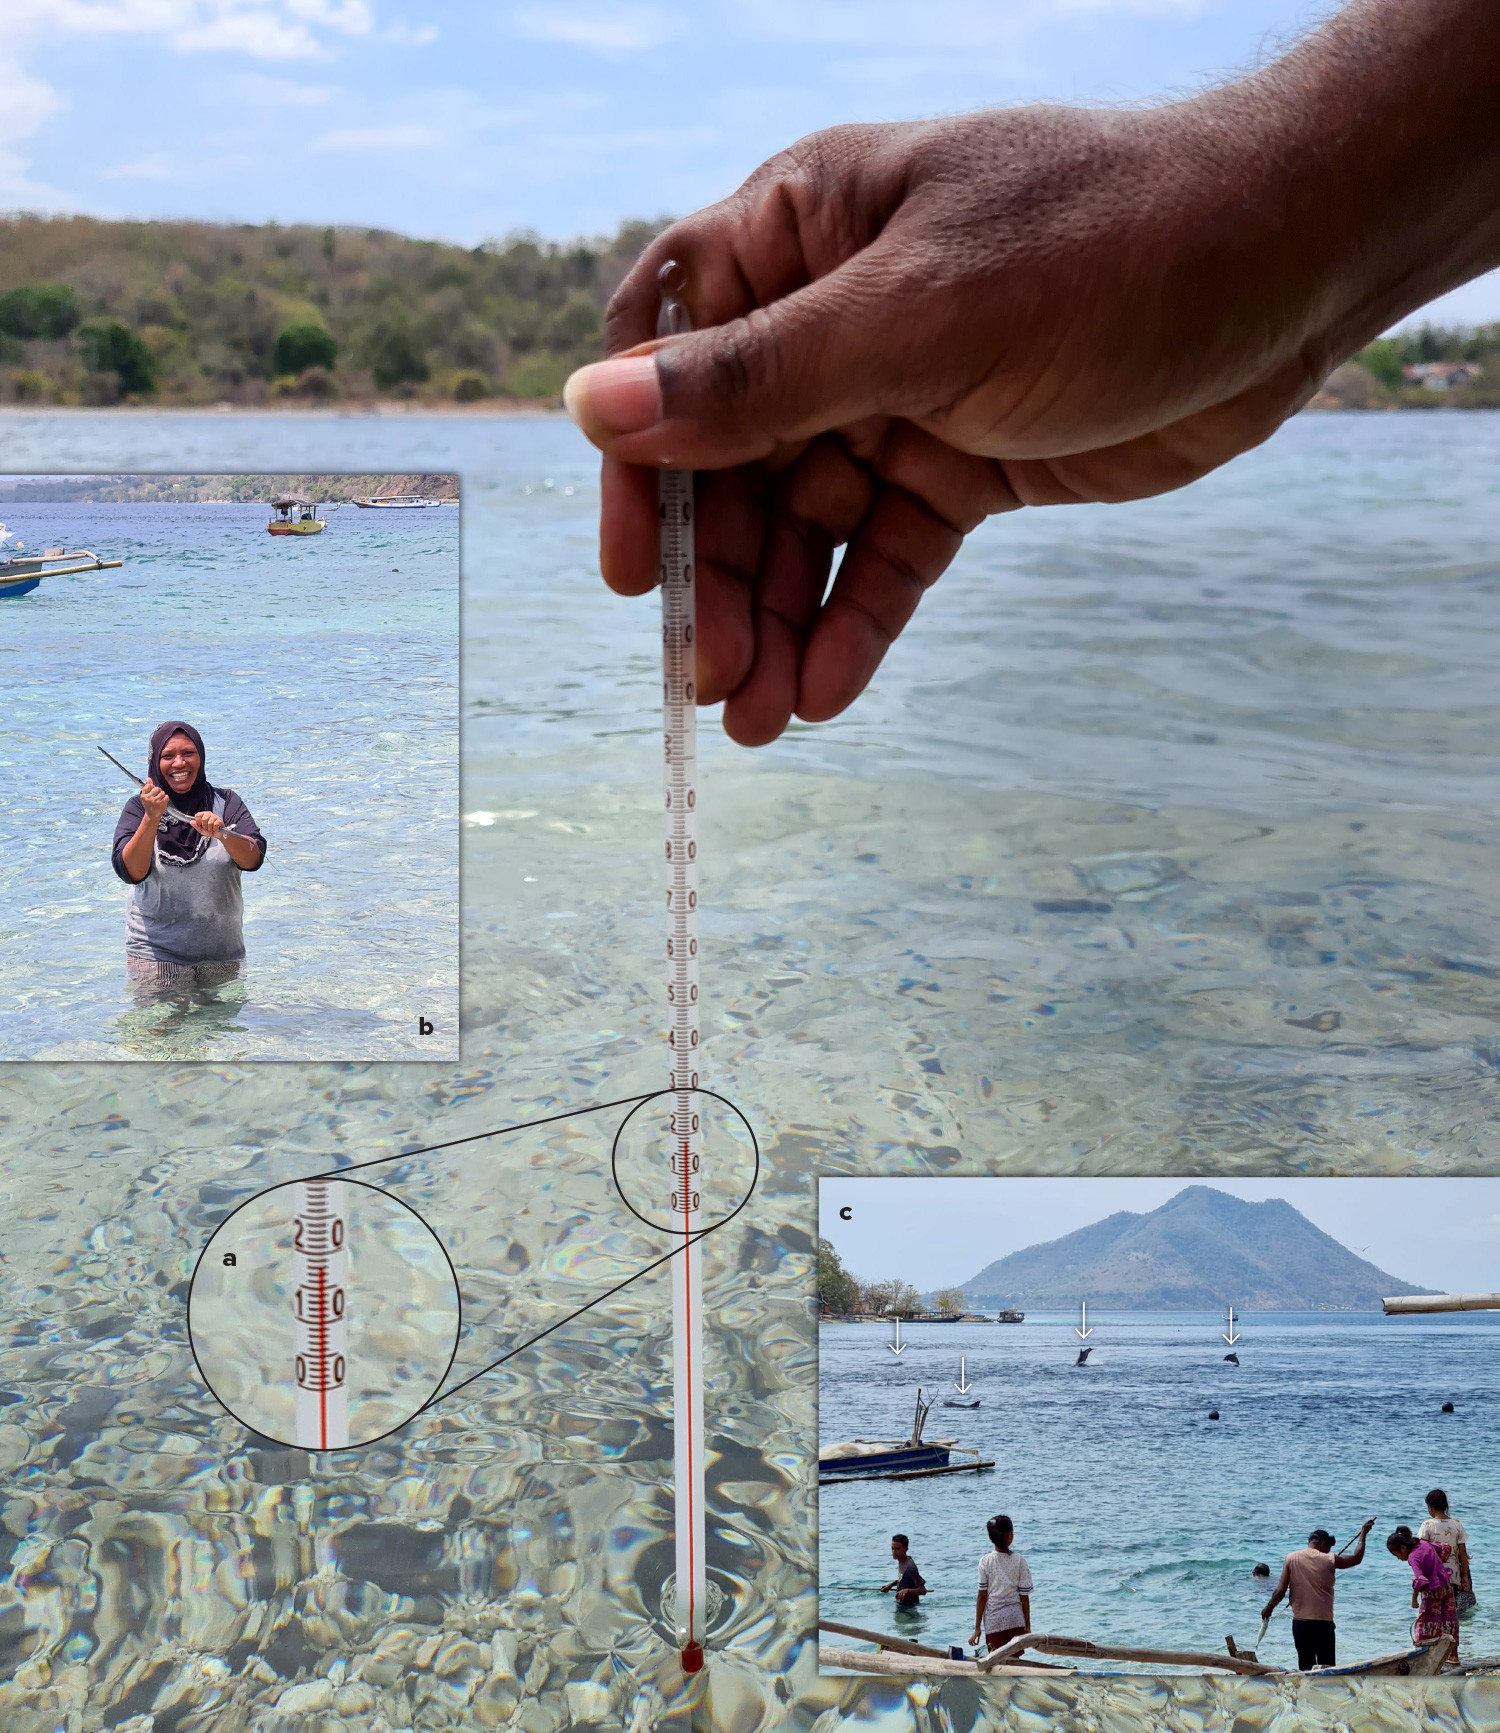
The study described here provides the first evidence of extreme upwelling events (EUEs) in the seas of Alor Kecil. EUE surface cooling can exceed 10°C, in this case a decrease to ~12°C. The figure on the title page shows a water temperature of 18°C during the EUE event on October 11, 2021, at Station 2 (see Figure 1c for Station 2 location). Even during extreme cold weather events such as tropical cyclones, the surface water temperature decreases only by 1°–8°C (e.g., Taira et al., 1993; Cione and Uhlhorn, 2003; Vecchi and Soden, 2007; Lin et al., 2013; E. Lee et al., 2016; Li et al., 2020). For example, during tropical cyclone Seroja, which struck the Savu Sea on April 4, 2021, the SST dropped by just 3°C (Setiawan et al., 2021). Thus, we consider the surface temperature decrease recorded in the seas of Alor Kecil an extreme event—and possibly the only place in the world where such EUEs occur. As far as we know, there has been no report of SSTs less than 15°C in tropical regions.
Previously, EUEs in the seas of Alor Kecil were only reported by the local news outlets (e.g., Radar NTT, 2017; Okezone, 2017; Pos Kupang, 2017), without scientific evidence to back them up. In this article, we describe EUE characteristics in the seas of Alor Kecil, Alor Island. We then investigate possible EUE generation mechanisms.
IN SITU OBSERVATIONS
To detect the occurrence of an EUE, we deployed four temperature loggers (TLs; HOBO Pendant MX 2201) in the seas of Alor Kecil from August 10 to November 15, 2020. The TL deployment locations were based on interviews we conducted with local people, who informed us that EUEs only occur along Mulut Kumbang Strait, a narrow channel between Kepa Island and Alor Kecil Village. For our study, we placed two TLs at Stations 1 and 2 inside the channel, and two TLs at Stations 3 and 4 at the mouth of Kabola Bay outside the channel (Figure 1c). Each TL was placed at about 1–2 m below the lowest low water level. Because the TL depths vary with the tide, the recorded temperatures are defined as near-surface temperature (NST) rather than sea surface temperature. The TL measurement interval was every 10 minutes. We also deployed one TL 6 m above the sea surface at Station 1 to record air temperature and light intensity to enable us to examine possible atmospheric effects on the occurrence of EUEs (Figure 1d).
We also collected tidal measurements at Station 1 August 7–10, 2020, using an RBRduo to validate the continuous tidal measurement at Kabola Bay (Figure 1b), operated by the Indonesian Geospatial Agency. The continuous tidal measurements with one-minute intervals can be retrieved at https://srgi.big.go.id/tides/alor. We performed harmonic analysis on the one-year tidal data from August 2020 to August 2021 to obtain the tidal components and used them for tidal prediction in 2022. A tidal forecast was also conducted to fill in the gap in observation data from August 2020 to November 2020.
In 2021, we collected vertical temperature profiles during an EUE by deploying 16 TLs placed vertically at Station 1 on October 10–11, 2021. The loggers were deployed at ~8 m depth below the lowest water level with 35 cm spacing and measurements recorded every 2 seconds (Figure 1e). All observational data were analyzed in time series plots to obtain EUE temporal variability and the possible factors that influence these events. We also deployed a TL continuously at Station 1 for one year (October 2021 to September 2022) and conducted a bathymetric survey in the seas of Alor Kecil using a Garmin 858 single-beam echosounder from October 8 to 11, 2021. Figure 1b shows the bathymetric survey lines.
On May 12, 2022, we deployed a salinity logger (i.e., HOBO U24-002) at Station 1. An Argonaut XR acoustic Doppler current profiler (ADCP) was also deployed from June 14 to June 17, 2022, during spring tide in Mulut Kumbang Strait. The ADCP was installed at approximately 22 m depth in the middle of the strait (Figure 1c). We also conducted CTD casts at Pantar Strait (red circle in Figure 1b) using a Sea-Bird Electronic SBE 37SMP on June 15, 2022, at 15:00, and June 16, 2022, at 09:30, to capture ebb tide and flood tide conditions, respectively.
RESULTS AND DISCUSSION
Detection of Extreme Upwelling Events at the Seas of Alor Kecil
Figure 2 plots the TL data at Stations 1–4. In the area inside the strait (Figure 2e,f), NST can be seen to drop dramatically to <15°C in three clusters that appear on August 23, 2020; September 19–22, 2020; and October 17–21, 2020. The minimum NST registered was ~12°C in September and October 2020, much lower than the minimum SST for common coastal upwelling events (e.g., Susanto et al., 2001; Setiawan et al., 2019; Wirasatriya et al., 2019, 2020). The dramatic temperature decreases occur twice a day and last less than one hour. Using data from Stations 1 and 2 as a guide, we define EUEs as NST reductions to <15°C that last at least one day and occur twice a day. A dramatic NST drop detected on November 3, 2020, was not considered to be an EUE because the NST did not reach 15°C.
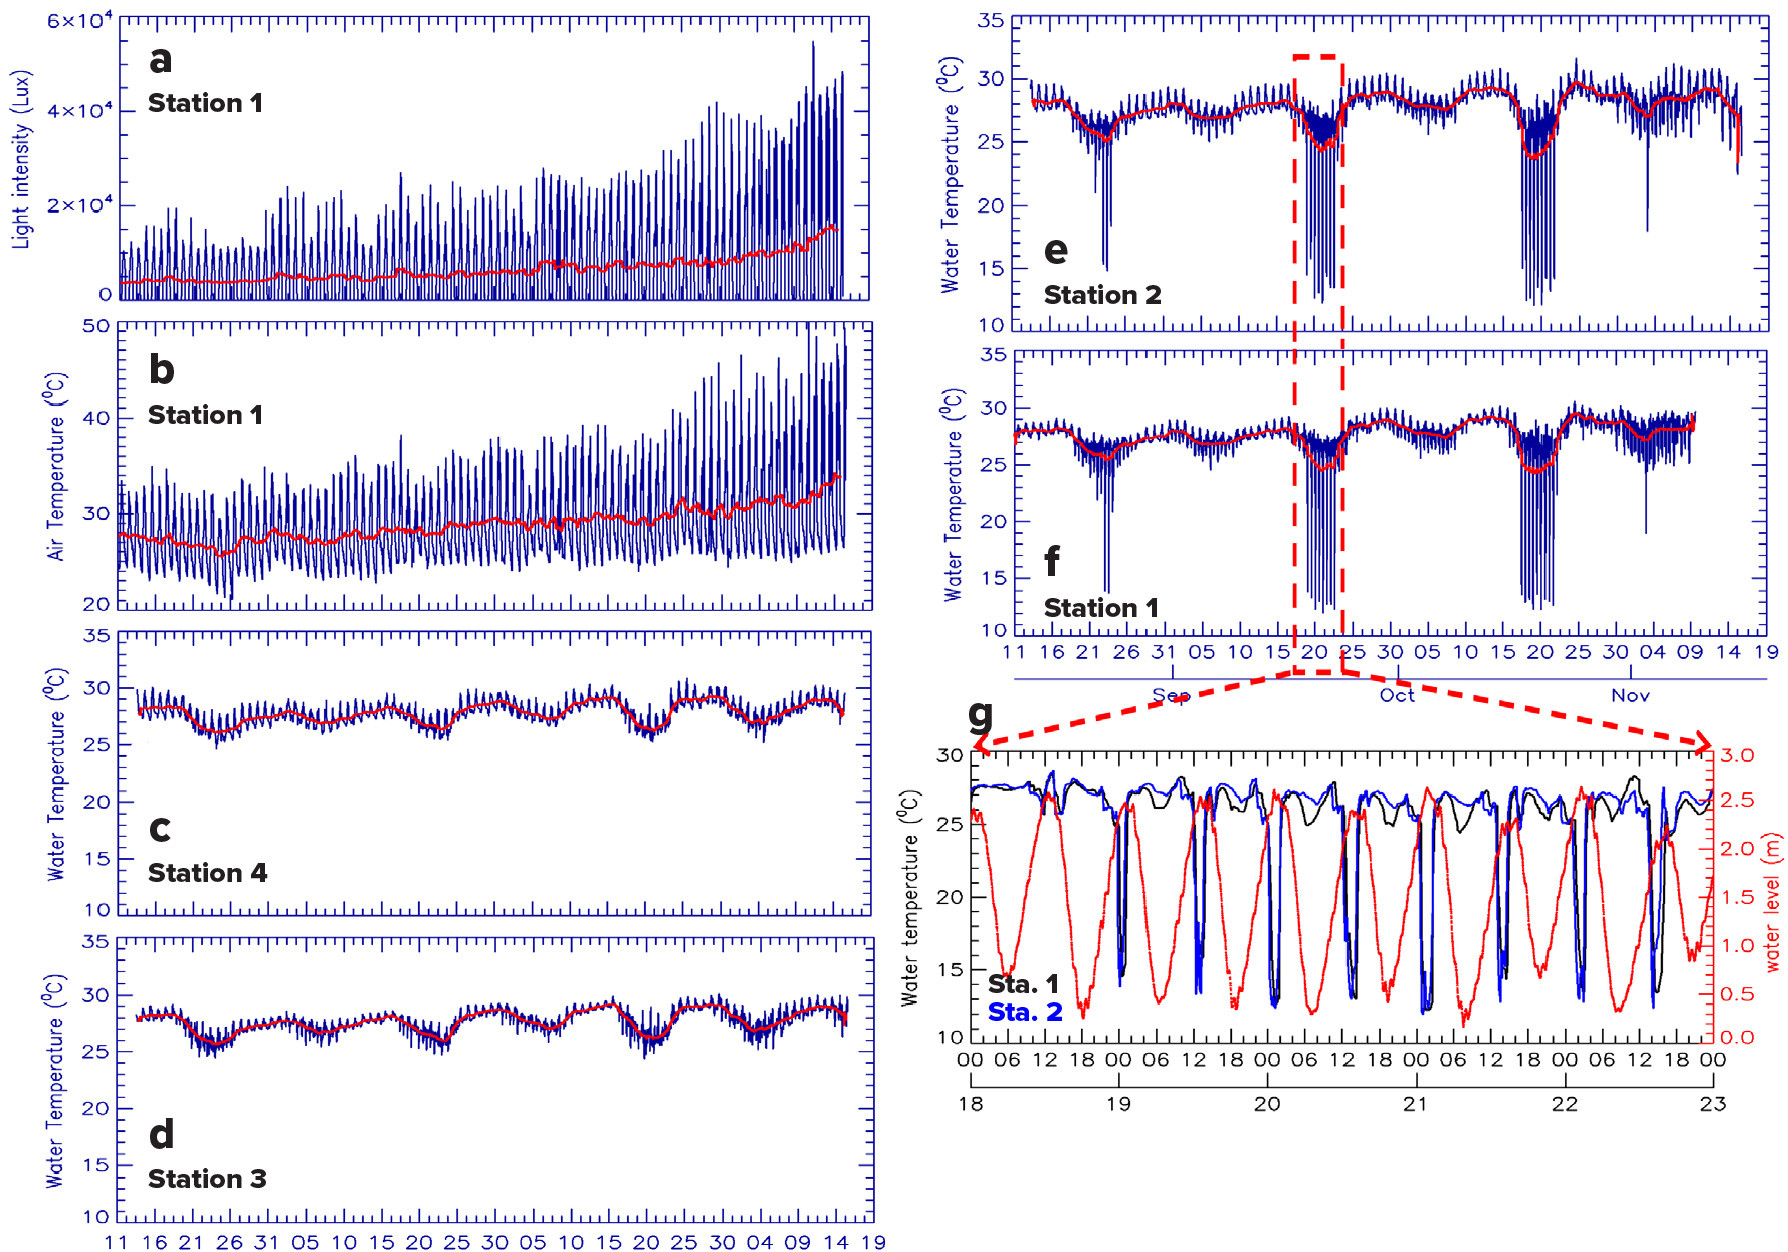
FIGURE 2. Time-series data collected at the Alor Kecil seas stations from August 18 through November 19, 2020. (a) Light intensity at Station 1. (b) Air temperature at Station 1. (c) Water temperature at Station 4. (d) Water temperature at Station 3. (e) Water temperature at Station 2. (f) Water temperature at Station 1. (g) Water temperature at Station 1 (black) and Station 2 (blue), and water level recorded at Kabola Bay (red line; for Kabola Bay location, see blue square in Figure 1b). The blue lines in panels (a–f) are the original data collected at 10-minute time intervals. The red lines are one-day moving averages. > High res figure
|
Figure 2g shows the detailed temperature fluctuations at Stations 1 and 2 during the September 2020 EUE. The NST decrease occurs at Station 2 slightly earlier than at Station 1, indicating that the cold water mass was moving northward. Figure 2g displays another EUE feature in the seas of Alor Kecil, of short duration and sudden onset. On September 19, 2020, at 11:00 the NST is ~27°C, and it suddenly decreases to ~13°C at 12:00. In contrast, in the areas outside the strait, where Stations 3 and 4 are located, there is no significant reduction in NST. This is consistent with the knowledge expressed in our interviews among the local population.
Although there is a difference in the magnitude of NST declines inside and outside of the strait, focusing on the one-day running average (red lines in the Figure 2 plots) reveals some similarity in NSTs among all four stations. All stations show a half-monthly pattern of NST fluctuation with the same phase, which may be related to tidal variation. To test this hypothesis, Figure 3b plots data from the tidal station at Kabola Bay (blue lines) along with tide prediction (green lines), which agree well with the tidal measurements at Station 1 (Figure 3a). The half-monthly (fortnightly) NST maximum and minimum occur during spring tide and neap tides, respectively.
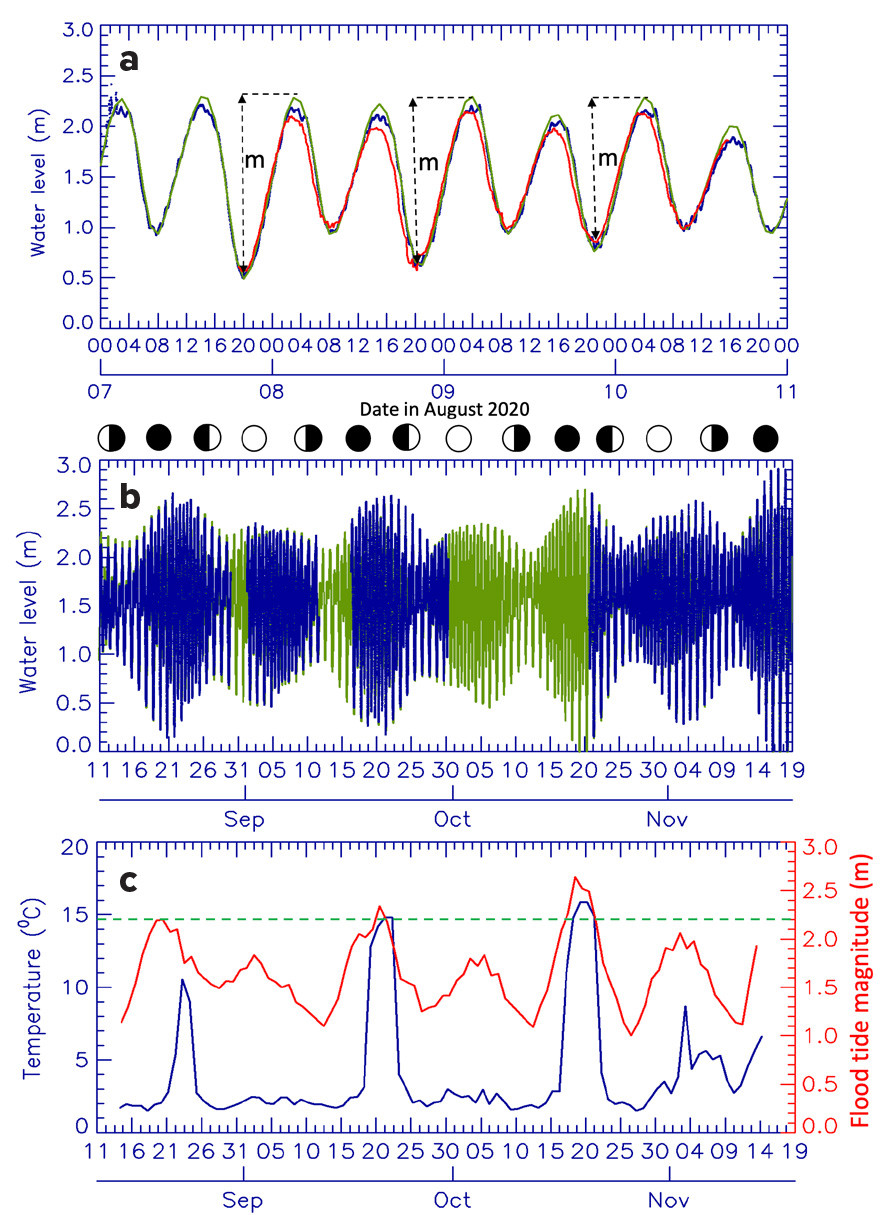
FIGURE 3. (a) Comparison between the tidal data from measurements at Station 1 (red line), the tidal station at Kabola Bay (blue line; for the station location, see the blue square in Figure 1b), and tidal prediction (green line). The symbol “m” marks the maximum magnitude of flood tide. (b) Time series of tide data from the tidal station at Kabola Bay (blue line) and tidal prediction (green line). The period with the clear green line means no tidal observation data. (c) Time series of semi-diurnal temperature difference (max-min; blue line) and maximum magnitude of flood tide within a day (red line). The dashed green line indicates the threshold for the maximum magnitude of flood tide within a day for EUE generation (i.e., 2.2 m). > High res figure
|
An EUE tends to be triggered during a new moon spring tide rather than during a full moon spring tide, which has a smaller amplitude (Figure 3b). Thus, the occurrence of the new moon can be can be an indicator of an impending EUE. Note that an EUE occurs approximately one to four days after the new moon, associated with the age of the tide (i.e., the time lag between the full moon or new moon and the maximum tidal amplitude; Ray and Susanto, 2016, 2019). For example, based on the 2020 moon phase calendar, new moons occurred in Kupang on August 19 at 10:41, September 17 at 19:00, and October 17 at 03:31 (https://www.timeanddate.com/moon/phases/-indonesia/kupang?year=2020), while the start dates of EUEs were on August 23 at 01:00, September 19 at 00:00, and October 17 at 12:00. Unfortunately, during the November new moon, we can only see the initial NST reduction as an indication of an impending EUE because the observation period was limited.
Focusing again on the September 2020 EUE (Figure 2g), NST reduction occurs twice a day following the semi-diurnal tide. It begins with the increasing water level and peaks at the maximum water level during spring tide. After that, the NST increases following the ebb tide. Thus, the flood tide causes the NST decrease during the spring tide. The relationship between EUEs and tidal forces becomes more evident in the analysis of semi-diurnal temperature amplitude and the maximum magnitude of flood tide within one day. The calculation of the maximum magnitude of flood tide within a day is depicted by “m” in Figure 3a. The semi-diurnal temperature amplitude is the difference between maximum and minimum temperatures within half a day (i.e., from 00:00 to 11:59 and from 12:00 to 23:59). Figure 3c shows that the semi-diurnal amplitude of temperature directly corresponds to the maximum flood tide magnitude. The highest temperature in October (i.e., ~16°C) coincides with the highest flood tide (i.e., ~2.7 m). The correlation coefficient (r) is 0.66, a strong correlation. Thus, the flood tide (ebb tide) may bring in (bring out) the cold-water mass by tidal sloshing. In general, tidal sloshing controls salinity as well as the nutrient influx that governs phytoplankton blooms in estuaries (e.g., Dronkers and Kreeke 1986; Lucas et al. 1999).
Furthermore, Figure 3c shows that an EUE is generated when maximum flood tide magnitude is more than 2.2 m. For example, on September 5, 2020, when the maximum flood tide was only 1.8 m, an EUE did not develop. From three months of observations, it appears that a maximum flood tide of more than 2.2 m is the threshold for the generation of an EUE in the seas of Alor Kecil.
To test this threshold, we continued the analysis using a longer period of data collection, from October 2021 to September 2022 (Figure 4). These data clearly show the occurrence of EUEs in the one-year span. EUEs are absent from December 2021 to July 2022 and only occur during four months—October 8–10, 2021, November 6–7, 2021, August 16, 2022, and September 13–14, 2022. There is also an NST decrease on October 22, 2021, but it did not reach the 15°C threshold of EUE definition. During EUEs, the maximum flood tide amplitudes are more than 2.2 m, in agreement with the threshold defined from 2020 data.

FIGURE 4. (a) Time series of semi-diurnal temperature difference (max-min; blue line) and the daily maximum flood tide magnitude (red line) at Station 1 for October 2021 to October 2022. (b) Time series of temperature (blue) and salinity (red) at Station 1 for the period September 11 to September 15, 2022. > High res figure
|
Focusing on September 2022, Figure 4b shows that temperature drops from September 11 to September 15 co-occur with a rise in salinity from ~30‰ to 34‰–36‰. The higher salinity indicates the water mass has characteristics of the deep layer in the south. As we show later, this increase in salinity is critical evidence of extreme upwelling in Mulut Kumbang Strait.
To investigate why EUEs do not occur from December to July, we plotted the meridional current as recorded by an ADCP for June 14–17, 2022, during the spring tide when the maximum flood reaches 2.8 m (Figure 5). The flood and ebb tides are northward-flowing and southward-flowing currents, respectively. However, the ebb currents in Mulut Kumbang Strait are much stronger than the flood currents. The ebb currents can reach >1.5 m s–1 while the flood currents flow only <1 m s–1. The weak flood currents during the spring tide in June 2021 may fail to transport cold water into the strait.

FIGURE 5. Time series of (a) tide data and (b) the meridional component of current for June 14–17, 2022, recorded during spring tide by an ADCP located in Mulut Kumbang Strait. The red dashed lines in panel (a) denote when CTD measurements were also collected (see Figure 8). > High res figure
|
To investigate whether the atmosphere affects the onset of EUEs, we looked at air temperature recorded at Station 1 (Figure 2b). During the observation period, air temperature was >20°C with no extreme fluctuation during the EUE. Additionally, the daily mean air temperature rises from August to November 2020, likely corresponding to increasing sunlight intensity (Figure 2a). These data show that EUEs in the seas of Alor Kecil are not generated by air-sea interaction, as is usual for coastal upwelling systems elsewhere in the Indonesian seas (e.g., Gordon and Susanto, 2001; Susanto et al., 2001, 2006; Moore et al., 2003; Susanto and Marra, 2005; Iskandar et al., 2009; Wirasatriya et al., 2017, 2018, 2019, 2020, 2021; Setiawan and Kawamura, 2011; Setiawan and Habibi, 2011; Ningsih et al., 2013; Kämpf, 2015; Utama et al., 2017; Setiawan et al., 2019, 2020). Because EUE generation is hypothesized to be due to tidal dynamics, we investigate tidal characteristics in the seas of Alor Kecil in the next section.
Tidal Characteristics in the Seas of Alor Kecil
We obtained 67 tidal components by applying the UTide harmonic analysis technique (Codiga, 2011) to one year of tidal data collected at one-minute intervals in Kabola Bay. The nine most dominant tidal constituents are M2, K1, S2, O1, N2, P1, K2, Sa, and MS4 with amplitudes of 0.66 m, 0.28 m, 0.26 m, 0.19 m, 0.13 m, 0.09 m, 0.06 m, 0.06 m, and 0.05 m, respectively. The semi-diurnal signal is stronger than the diurnal signal in the seas of Alor Kecil.
To determine the tidal type in the seas of Alor Island, we calculated the Formzahl value, which is the ratio between diurnal components (O1 + K1) and semi-diurnal components (M2 + S2). With a Formzahl value of 0.51, the tidal type in the seas of Alor Kecil is mixed prevailing semi-diurnal (Pugh, 1987). The existence of Sa (annual cycle associated with the monsoon) indicates that the monsoon may modulate the EUE variability in the seas of Alor Kecil. The MS4 constituent is associated with the shallow water tidal component (the depth of Mulut Kumbang Strait is <40 m).
Ray and Susanto (2016) show that the interaction of K1 and O1 components results in an Mf component with a period of 13.66 days. Note that the interaction of M2 and S2 components results in an Msf component with a 14.77-day period. Because M2 and S2 components are greater than K1 and O1, the Msf component with a fortnightly signal is strong in the seas of Alor Kecil. Based on least square analysis, the amplitudes of Msf and Mf are 0.0377 m and 0.0141 m, respectively. This explains the strong half-monthly pattern of NST fluctuations observed at all stations. In other words, the NST fluctuations in the seas of Alor Kecil have a fortnightly signal with a period of 14.77 days. Furthermore, the interaction of M2 and N2 results in the lunar Mm tidal constituent, which has a 27.55-day period. The Mm amplitude is 0.0114 m. The monthly occurrence of EUE corresponds to the Mm constituent observed in the seas of Alor Kecil.
To further analyze the dominant frequency oscillation of the NST, we performed a Fast Fourier Transform (FFT) on the temperature logger data. Figure 6a–e displays the FFT analysis of temperature data from August to November 2020. Diurnal and semi-diurnal cycle signals are recorded by all TLs. At Stations 1 and 2, where EUEs occur, the semi-diurnal signal is stronger than the diurnal signal. In contrast, the diurnal signal is stronger than the semi-diurnal signal at Stations 3 and 4. The strong diurnal signal is also found in the air temperature at Station 1. The strong semi-diurnal NST signal at Stations 1 and 2 may correspond to the semi-diurnal tidal signal, which is the combination of M2, S2, and N2 components. Ray et al. (2005) show that the semi-diurnal signal within the Indonesian seas is propagated from the Indian Ocean. This observation is consistent with our finding, which indicates that the northward movement of the cold water mass entering the Mulut Kumbang Strait generates EUEs. Further, the strong signals of four and six cycles per day at Stations 1 and 2 are associated with the over tide of the nonlinear shallow water components such as MS4, M4, 2MS6, and M6 that have amplitudes of 0.05 m, 0.046 m, 0.009 m, and 0.007 m, respectively. In contrast, the strong daily signals recorded at Stations 3 and 4 may be influenced by a combination of the diurnal tidal signals. The absence of EUEs outside Mulut Kumbang Strait may be due to a weak semi-diurnal tide, as recorded at Stations 3 and 4. In addition, air temperature also exhibits “atmospheric tides” of semi-diurnal, diurnal, and higher frequencies due to the influence of ocean tides, as Ray and Susanto (2019) show for Lombok Strait.
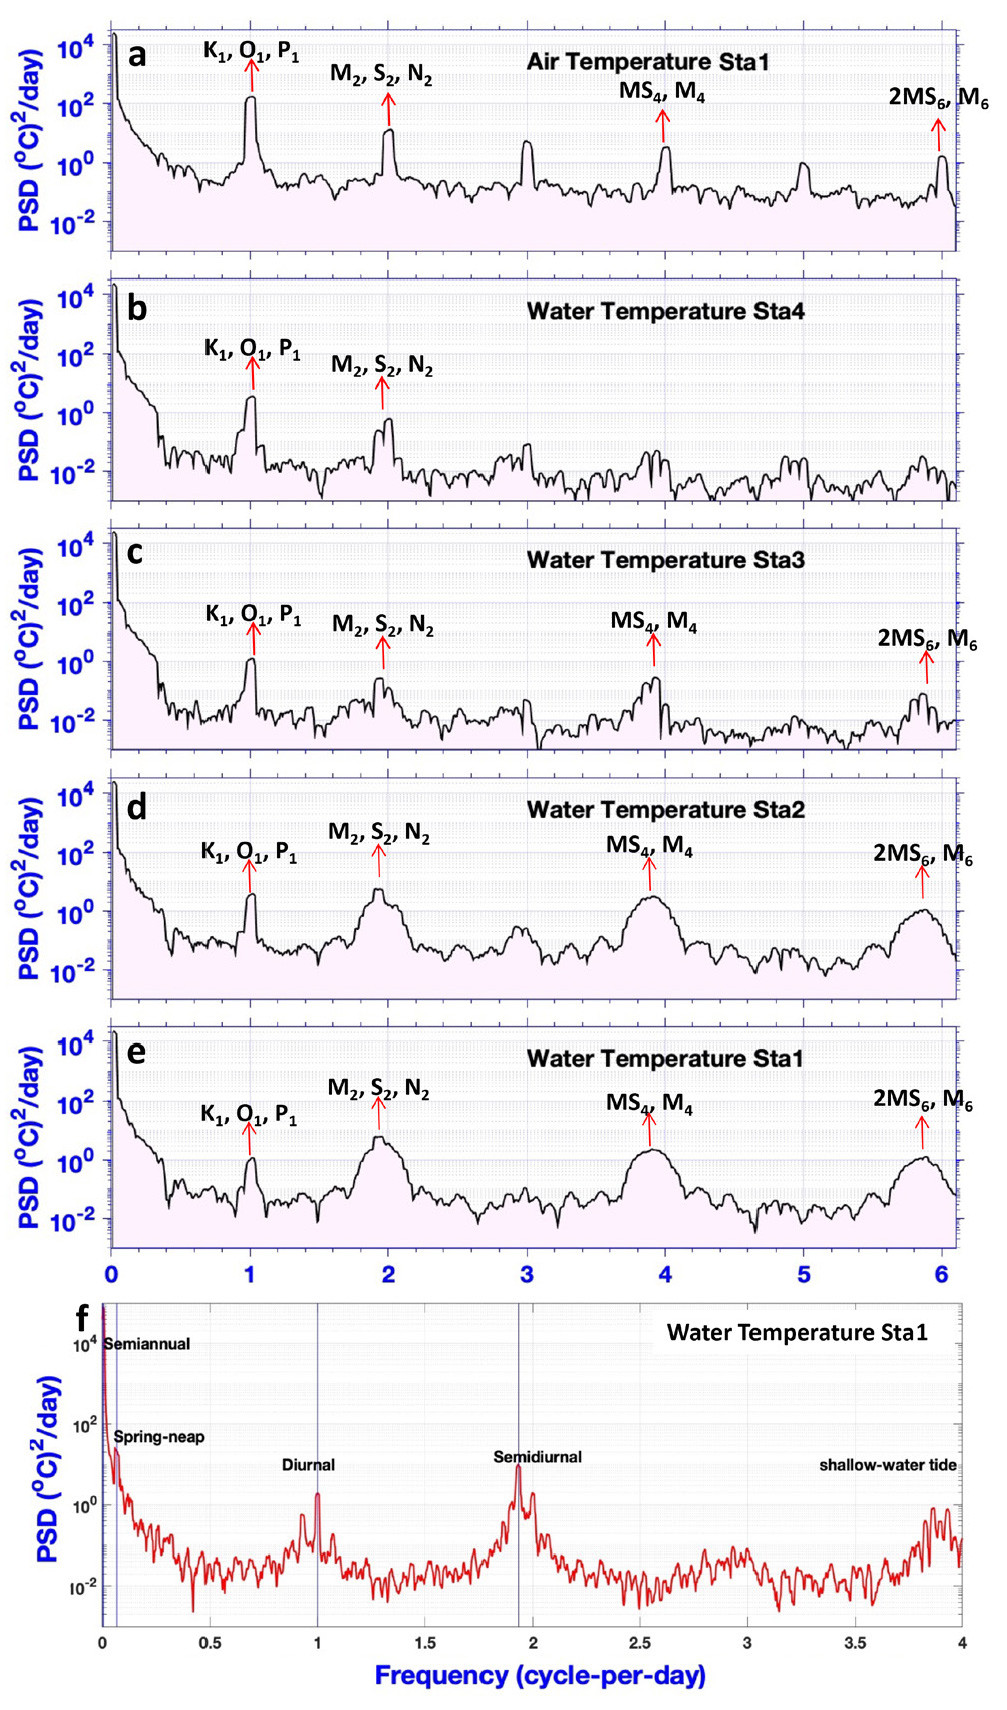
FIGURE 6. Fast Fourier Transform analysis of (a) air temperature at Station 1, (b) water temperature at Station 4, (c) water temperature at Station 3, (d) water temperature at Station 2, (e) water temperature at Station 1, and (f) water temperature at Station 1. The red arrows denote the possible associated tidal components. The period of analysis for panels (a–e) is from August to November 2020, while for panel (f) it is October 2021 to October 2022. PSD = Power spectral density. > High res figure
|
Robust semi-diurnal NST signals recorded at Stations 1 and 2 may lead to a strong monthly signal (Mm, the lunar tidal constituent), a characteristic of EUEs. However, the three-month limitation of the TL observation period does not allow the FFT analysis to catch the monthly signal. Figure 6f presents the longer, one-year observation period from October 2021 to October 2022 at Station 1. In addition to the diurnal, semi-diurnal, and shallow-water signals captured by three months of data, the NST spring-neap signal is evident at Station 1, indicating a strong relationship between tides and NST in Mulut Kumbang Strait. A semi-annual signal also appears in this analysis, which explains why the NST decrease occurs seasonally. Although our current observations only show that EUEs occur from August to November, the NST decrease in March to May is lower than that in December to February and June to July. Based on our interviews with local people, EUEs occurred in March and April. A longer period of temperature observations is needed at additional stations to determine whether EUEs do occur in March and April and to investigate the possibility of the interannual EUE variability.
Source of the Cold-Water Mass
Figure 5 shows that flood currents cause EUEs to flow northward, suggesting the source of the cold-water mass is in the southern part of Mulut Kumbang Strait. CTD data collected by Purwandana et al. (2014) in Alor Strait between Pantar Island and Flores Island included a temperature lower than 15°C recorded at the western side of Pantar Island deeper than 200 m—indicating that the source of the cold-water mass may be Pantar Strait below 200 m depth.
Figure 7 shows the bathymetry of Pantar Strait. At the southern part of Mulut Kumbang Strait, the deepest area, more than 300 m, is located between Pura Island and Southwestern Alor at around 124°23.5'E, 8°18.5'S. The CTD data we collected in this area confirm that the of cold-water source may be located in this basin (Figure 8) because high salinity (>34‰) occurs at ≥100 m depth. During ebb tide on June 15, 2021, the temperature at 230 m depth was ~14°C (Figure 8a), while during flood tide on June 16, 2021, the temperature at 270 m depth registered ~8°C (Figure 8b).
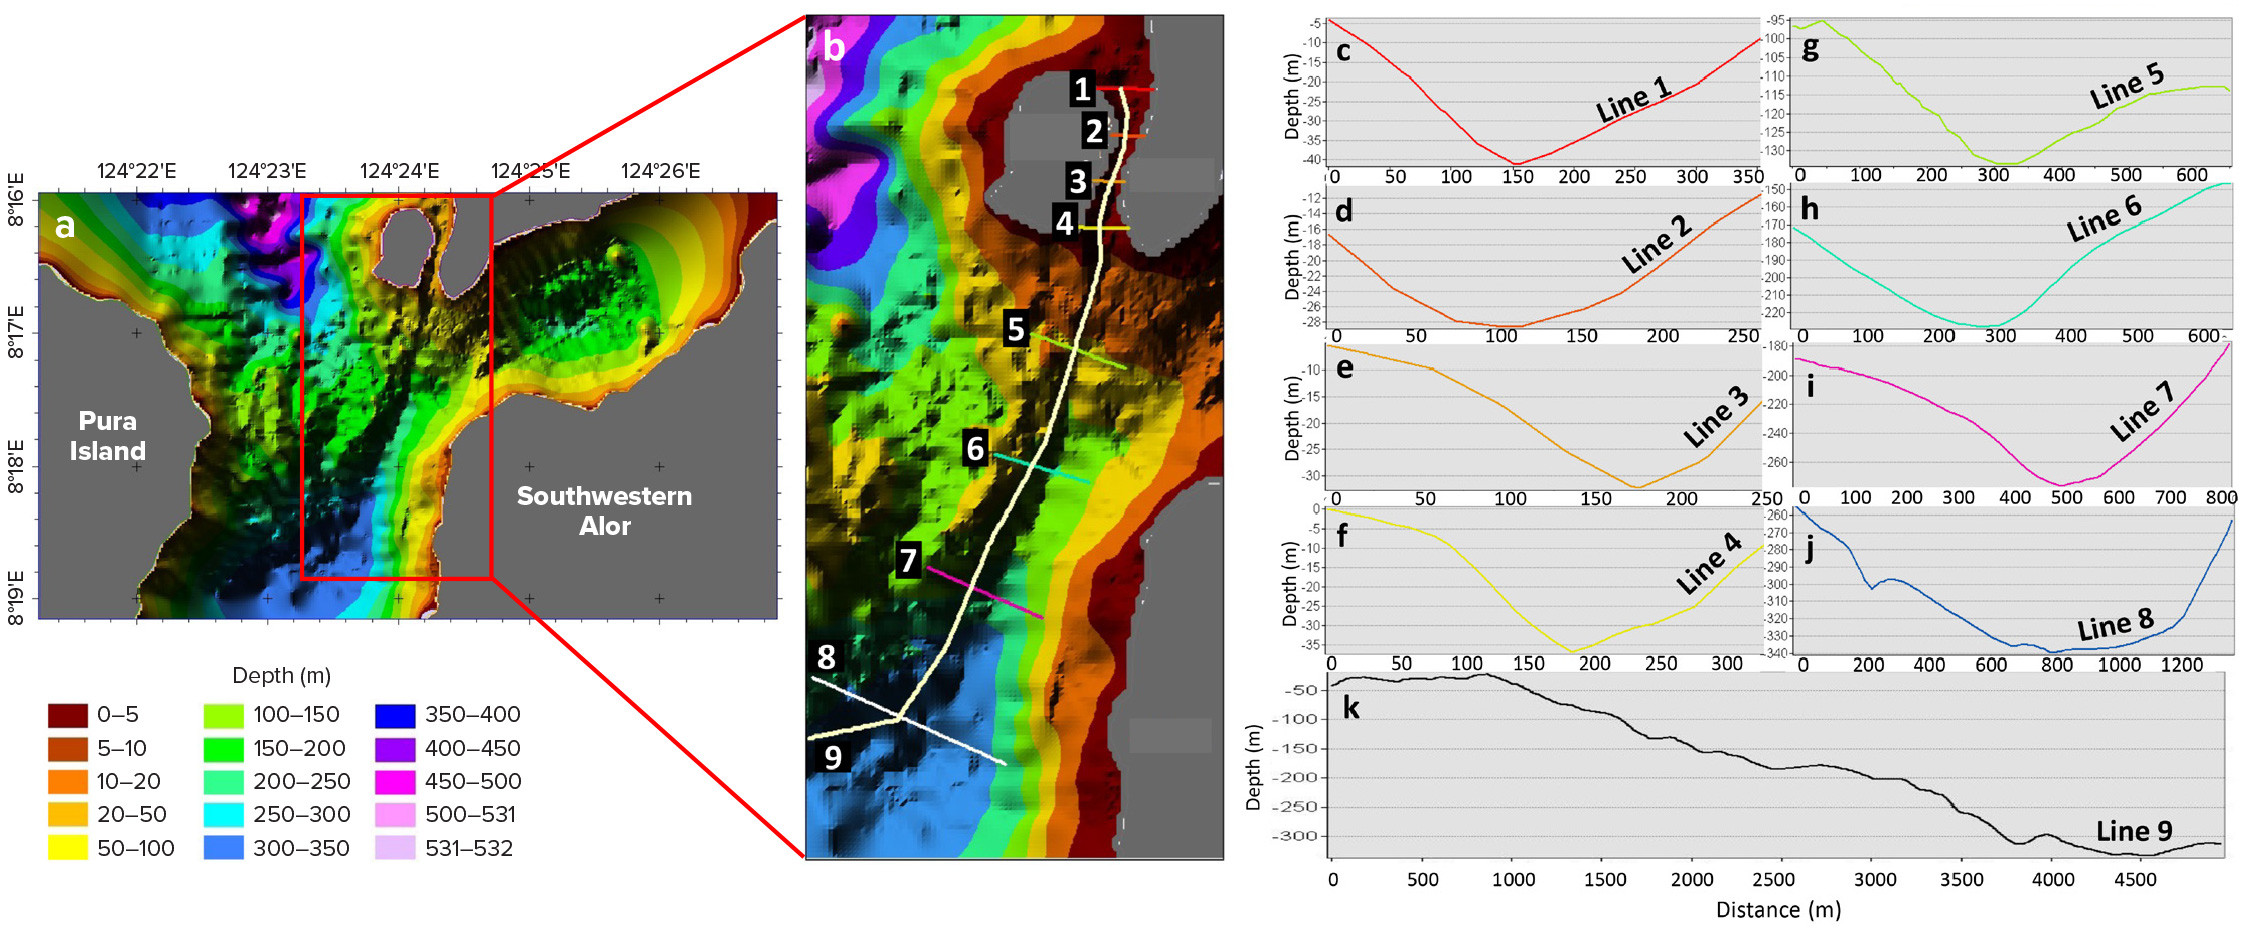
FIGURE 7. (a) Bathymetric map of Pantar Strait derived from single-beam echosounder data. (b) Zoom in of a section of the bathymetric map showing the locations of the cross sections of the depth soundings in (c–k). Figure 1b plots the ship tracks and individual sounding points for this survey. > High res figure
|
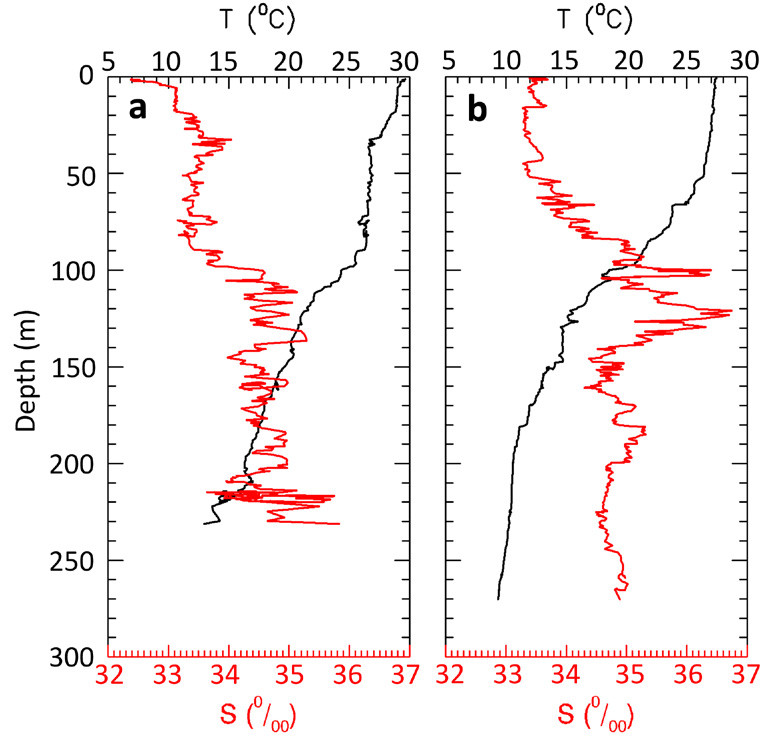
FIGURE 8. Plots of CTD data collected at the red circle in Figure 1b (a) during an ebb tide on June 15, 2022, and (b) during a flood tide on June 16, 2022. Red lines plot salinity (bottom x-axis), and black lines plot temperature (top x-axis). > High res figure
|
The bathymetry data reveal a channel connecting the deepest part of Pantar Strait to Mulut Kumbang Strait. Analysis of cross sections of this channel shows that depths in the channel along Mulut Kumbang Strait represented by Lines 1–4 in Figure 7 vary from ~10 m to ~35 m, and channel width ranges from 250 m to 300 m (Figure 7c–k). At Lines 5, 6, and 7, channel depths increase significantly to ~40 m, ~50 m, and ~80 m, respectively, and width increases. At Line 8, the depth of the channel reaches ~90 m, and it is more than 1 km wide. With a slope of about 10% (Line 9), this channel may be the mechanism for transporting cold-water masses from the deepest part of Pantar Strait directly to Mulut Kumbang Strait through tidal sloshing, without waters spreading to other areas.
Figure 9 provides the vertical profile analysis of TLs during the EUE of October 10–11, 2021. Two events show a temperature drop from October 10 to October 11, 2021. The first event occurs on October 10, 2021, at 13:00 and the second on October 11, 2021, at 01:00 (Figure 9a). During the first event, the temperature drops below 15°C five times for durations of one hour (Figure 9b). At the first and last occurrences, the T < 15°C reaches the uppermost layer, indicating that the magnitude of the temperature drops at the first and the last occurrences are more robust than the others. The T < 15°C diverges at around 5 m to 6 m above the sea bottom at the second and fourth occurrences. This divergence indicates that there is turbulent mixing, which may involve low-temperature dynamics during the EUE, a possibility that will be examined in the future using current and salinity profiles.

FIGURE 9. Vertical temperature profile at Station 1 during an EUE on October 10–11, 2021. The black contours in (b) and (c) mark the 15°C isotherm. The red arrow in (c) shows the upward displacement of the 15°C isotherm. > High res figure
|
Next, we focus on the first occurrence of a T < 15°C (Figure 9c) lasting ~16 minutes. T < 15°C began at 01:02 and ended at 01:18. Propagating from the seafloor at 01:02, T < 15°C reached 6.4 m above the seafloor at 1:09. Using simple linear regression, we estimate the speed of this upward displacement at about 0.012 m s–1. This upward displacement of T < 15°C indicates upwelling and bolsters our hypothesis that dramatic temperature decreases in the seas of Alor Kecil constitute EUEs.
Potential for Remote Sensing of EUEs
This study was designed to investigate the vertical profiles and temporal distributions of EUEs. In the future, satellite remote sensing may become a practical tool for providing the spatial distribution of EUEs in the seas of Alor Kecil. Currently, however, the application of satellite technology to EUEs is limited by the small area (<1 km2) and short duration of these phenomena (<1 hr) that renders them undetectable by satellite sensors.
Although the rapid occurrence and significant temperature decreases that characterize EUEs would present a significant challenge, cameras with infrared sensors mounted on unmanned aerial vehicles (UAVs) may offer a solution. J.-h. Lee et al. (2016) used a UAV-based thermal infrared (TIR) sensor to investigate groundwater discharge into coastal seas and found that the TIR sensor clearly captured the cold SST signal of the discharge. In addition, a three-dimensional hydrodynamic model could be used to simulate the displacement of cold water from the deep layer to Mulut Kumbang Strait due to the tidal current.
POTENTIAL LOCAL CULTURAL IMPACT OF EUEs
As illustrated in the title page figure, the sudden temperature drop during EUE shocks fish along Mulut Kumbang Strait and renders them unconscious. Thus, local people easily catch those fish using their bare hands. The unconscious fish also attract dolphins and other cetaceans that come and feed, because Pantar Strait is one of the cetacean migrating paths in the Savu Sea (Maro et al., 2021a,b). EUE locations could potentially be developed as world-class tourism spots where tourists can feel icy water in the tropics, catch unconscious fish, and observe dolphins schooling. Thus, understanding EUE characteristics in the seas of Alor Island is not only scientifically interesting but also potentially of economic benefit for the people of Alor Island.
CONCLUSIONS
Using more than one year of data collected by temperature loggers in the seas of Alor Kecil, we were able to detect several EUEs, phenomena characterized by a sudden and dramatic decrease of more than 10°C in near-surface water temperature that lasts for an hour and is accompanied by a 4‰–6‰ increase in salinity. The minimum NST we observed reached ~12°C, and the upward displacement speed of cold water during the EUE on October 10, 2021, was 0.012 m s–1. Air temperature does not correlate with EUEs, whose generation is controlled by tidal forces. Generally, the NST variation displays a fortnightly (Msf, spring-neap) signal. However, the dramatic decrease in SST that characterizes an EUE occurs once a month in the seas of Alor Kecil following the period of the Mm lunar monthly tidal constituent, and it is modulated by the monsoon. The occurrence of EUEs only from August to November also suggests a strong monsoonal influence. During an EUE, the cold water appears twice a day following the semi-diurnal tidal component. A maximum flood tide magnitude of >2.2 m will generate an EUE. The source of the cold water mass is the deep basin (>300 m) in the southern part of Pantar Strait where the temperature at 270 m depth may be as low as 8°C. Through tidal sloshing, the strong flood tide moves the cold water mass through the channel that connects this deep basin to Mulut Kumbang Strait.
Acknowledgments
This research is supported by Universitas Diponegoro under the scheme of High Reputation of International Publication Research with grant numbers 185-98/UN7.6.1/PP/2021 and 185-98/UN7.6.1/PP/2022. We thank the Adjunct Professor Program WCU UNDIP 2022. We also thank the World Class Professor program of the Directorate General of Higher Education, Research and Technology; Ministry of Education, Culture, Research and Technology; Republic of Indonesia. This project is also supported by the research scheme of Program Riset Unggulan COREMAP CTI 2021-2022 (17/A/DK/2021). Special thanks to Bapak Rahmat Marweki and his family for their hospitality in providing us with accommodations during the field survey. R.D. Susanto is also supported by National Aeronautics and Space Administration (NASA) grant# 80NSSC18K0777 through the University of Maryland, College Park, USA. We would also like to thank three peer reviewers for their comments and insights that helped improve this manuscript.