INTRODUCTION
The Block Island Wind Farm (BIWF) offers the first opportunity to assess the effects of offshore wind (OSW) development on coastal resources in the northeastern United States. “America’s First Offshore Wind Farm” was constructed in 2015 and 2016 after an extensive scientific data-gathering and stakeholder vetting process (RICRMC, 2010). The pilot-scale project consists of five 6 MW turbines located within the state waters of Rhode Island 5.3 km from Block Island. The turbines are within sight of communities that depend on tourism and recreational fishing (H. Smith et al., 2018) and that rely upon the project for electricity and grid connection (Russell et al., 2020). The BIWF is located close to rock reefs and intertidal habitats in an area with relatively low commercial fishing pressure (RICRMC, 2010). This unique juxtaposition of scale, location, resources, and user interests influenced the design of the studies described here (Figure 1).
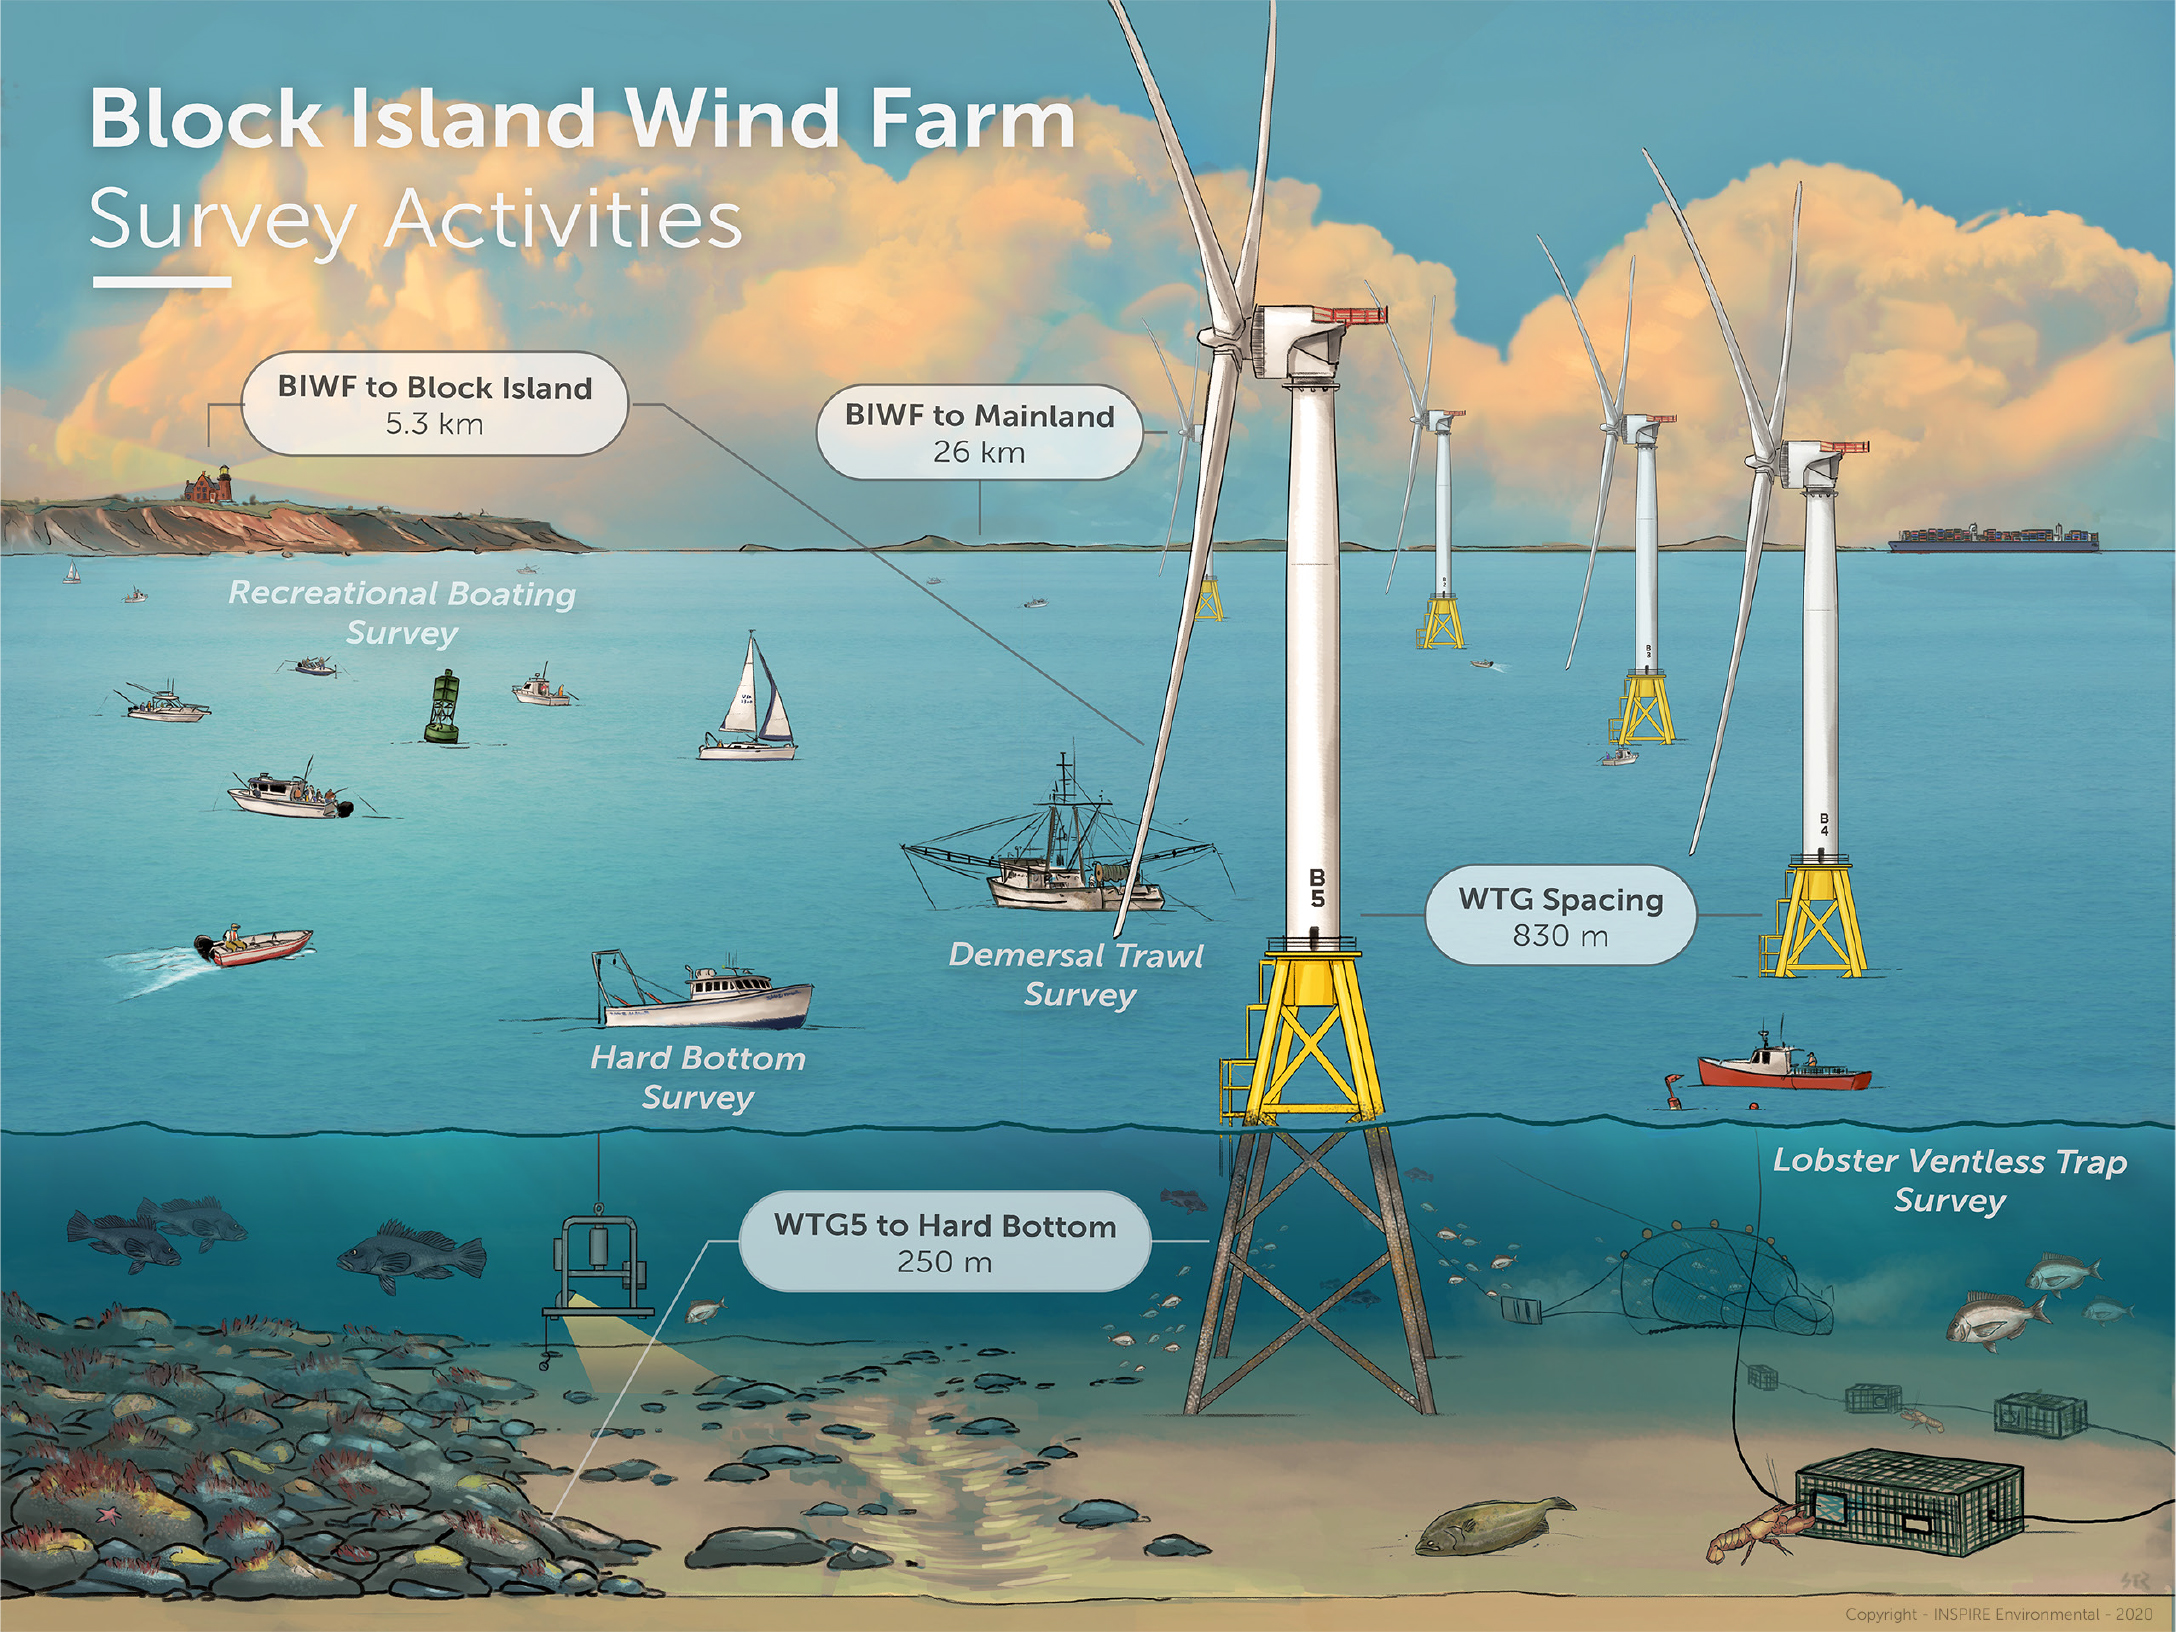
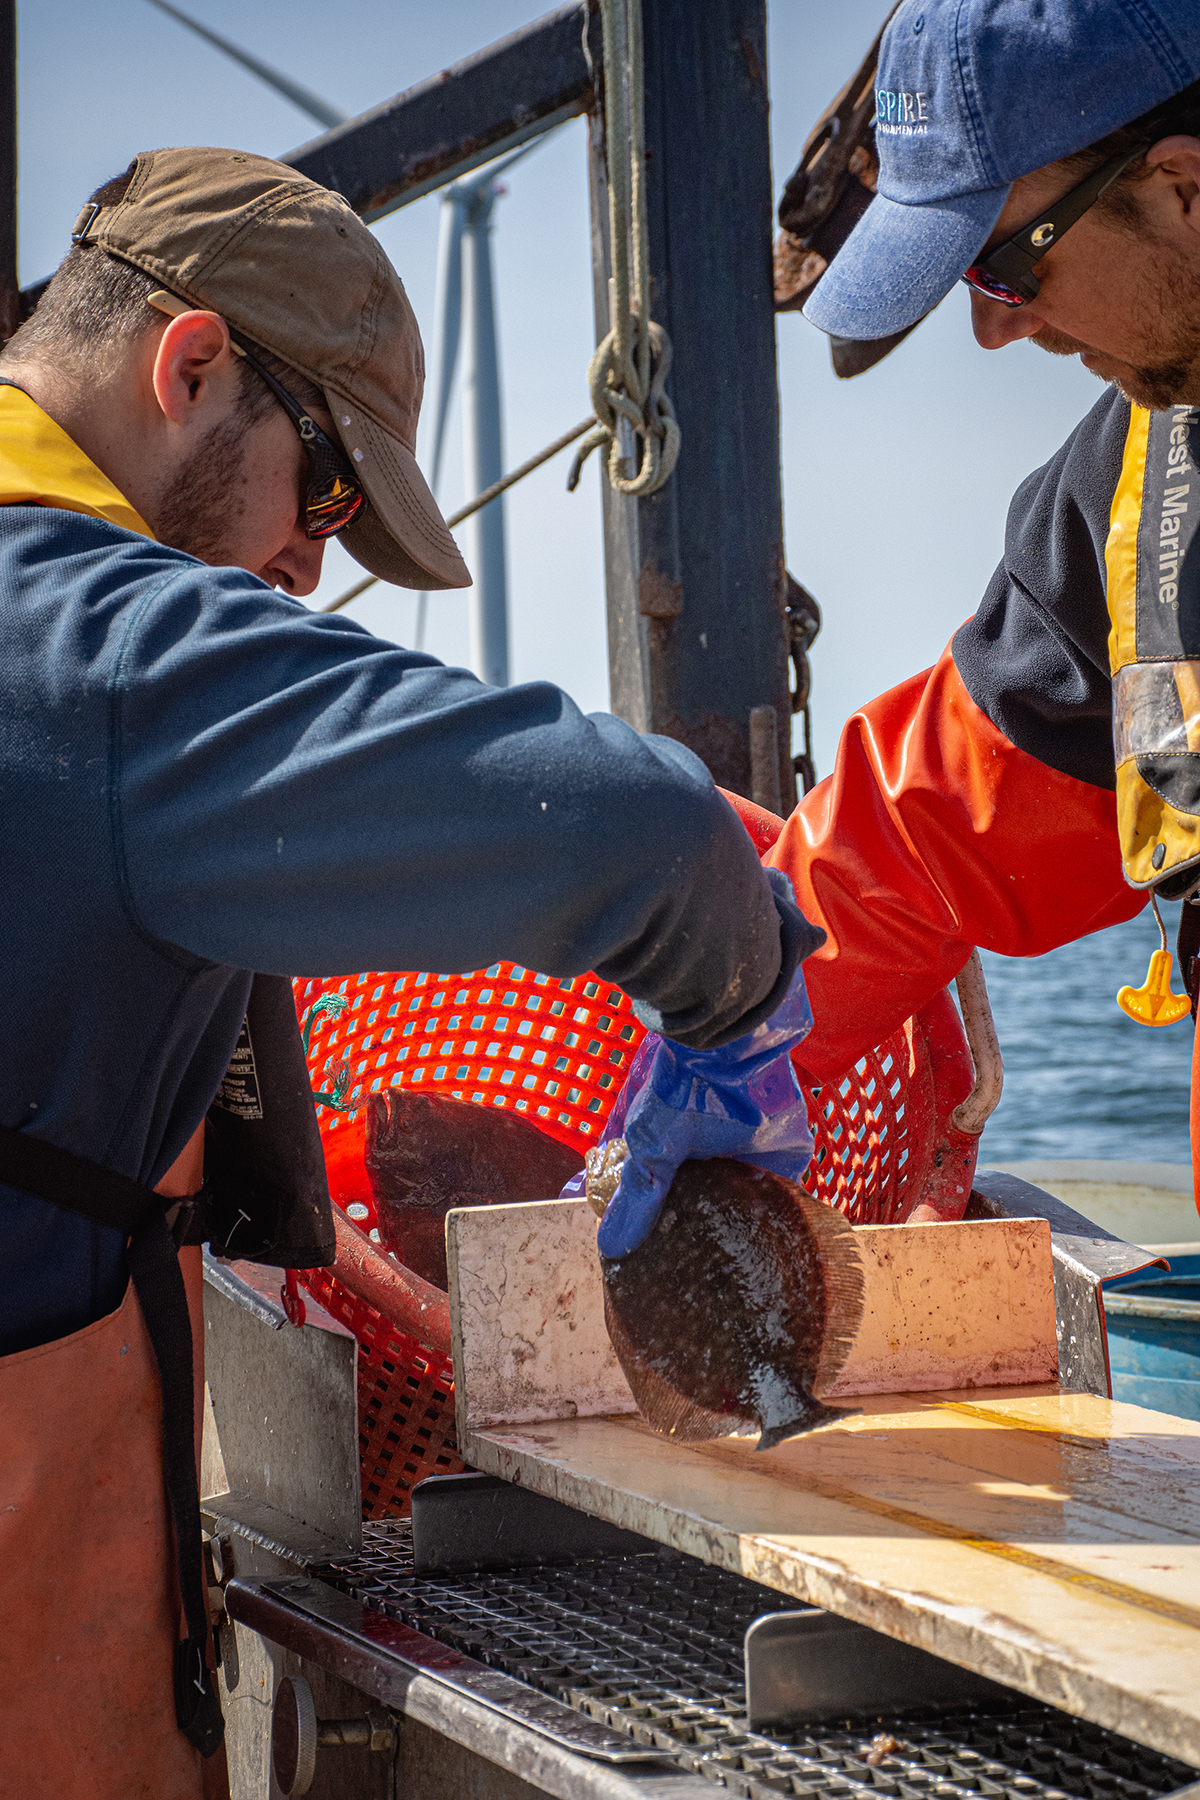
Figure 1. The first offshore wind farm in the United States, Block Island Wind Farm (BIWF) is unique in scale with five turbines 830 m apart. It is located near an island adjacent to natural reefs, an area where there is heavy recreational fishing use. Four studies related to fish and fisheries resources yielded important lessons on scale and duration for future monitoring efforts. WTG = wind turbine generator. > High res figure
|
The site selection and permitting process for the BIWF raised important questions about the potential effects of OSW construction and operation on a wide variety of marine resources (RICRMC, 2010). The four study designs summarized here were required by the lease agreement, vetted by stakeholders and scientists, and represented the first opportunity to evaluate fish and fisheries resources at an operating OSW project in the United States. Each study collected data on multiple parameters and compared effects of the project to reference areas prior to construction, during construction, and post-construction. A timeline illustrates the overlap between construction events and each of the four studies (Figure 2). Detailed results of these studies are presented in a series of technical reports and publications (Guarinello et al., 2017; Guarinello and Carey, 2020; Sabo et al., 2020; Wilber et al., 2020a,b), with more forthcoming. Here, we critically examine study designs to identify lessons learned from assessment of potential effects of the pilot-scale BIWF on multiple resources and stakeholders. These lessons can be applied to planning and monitoring larger-scale OSW farms proposed for the northeastern United States.
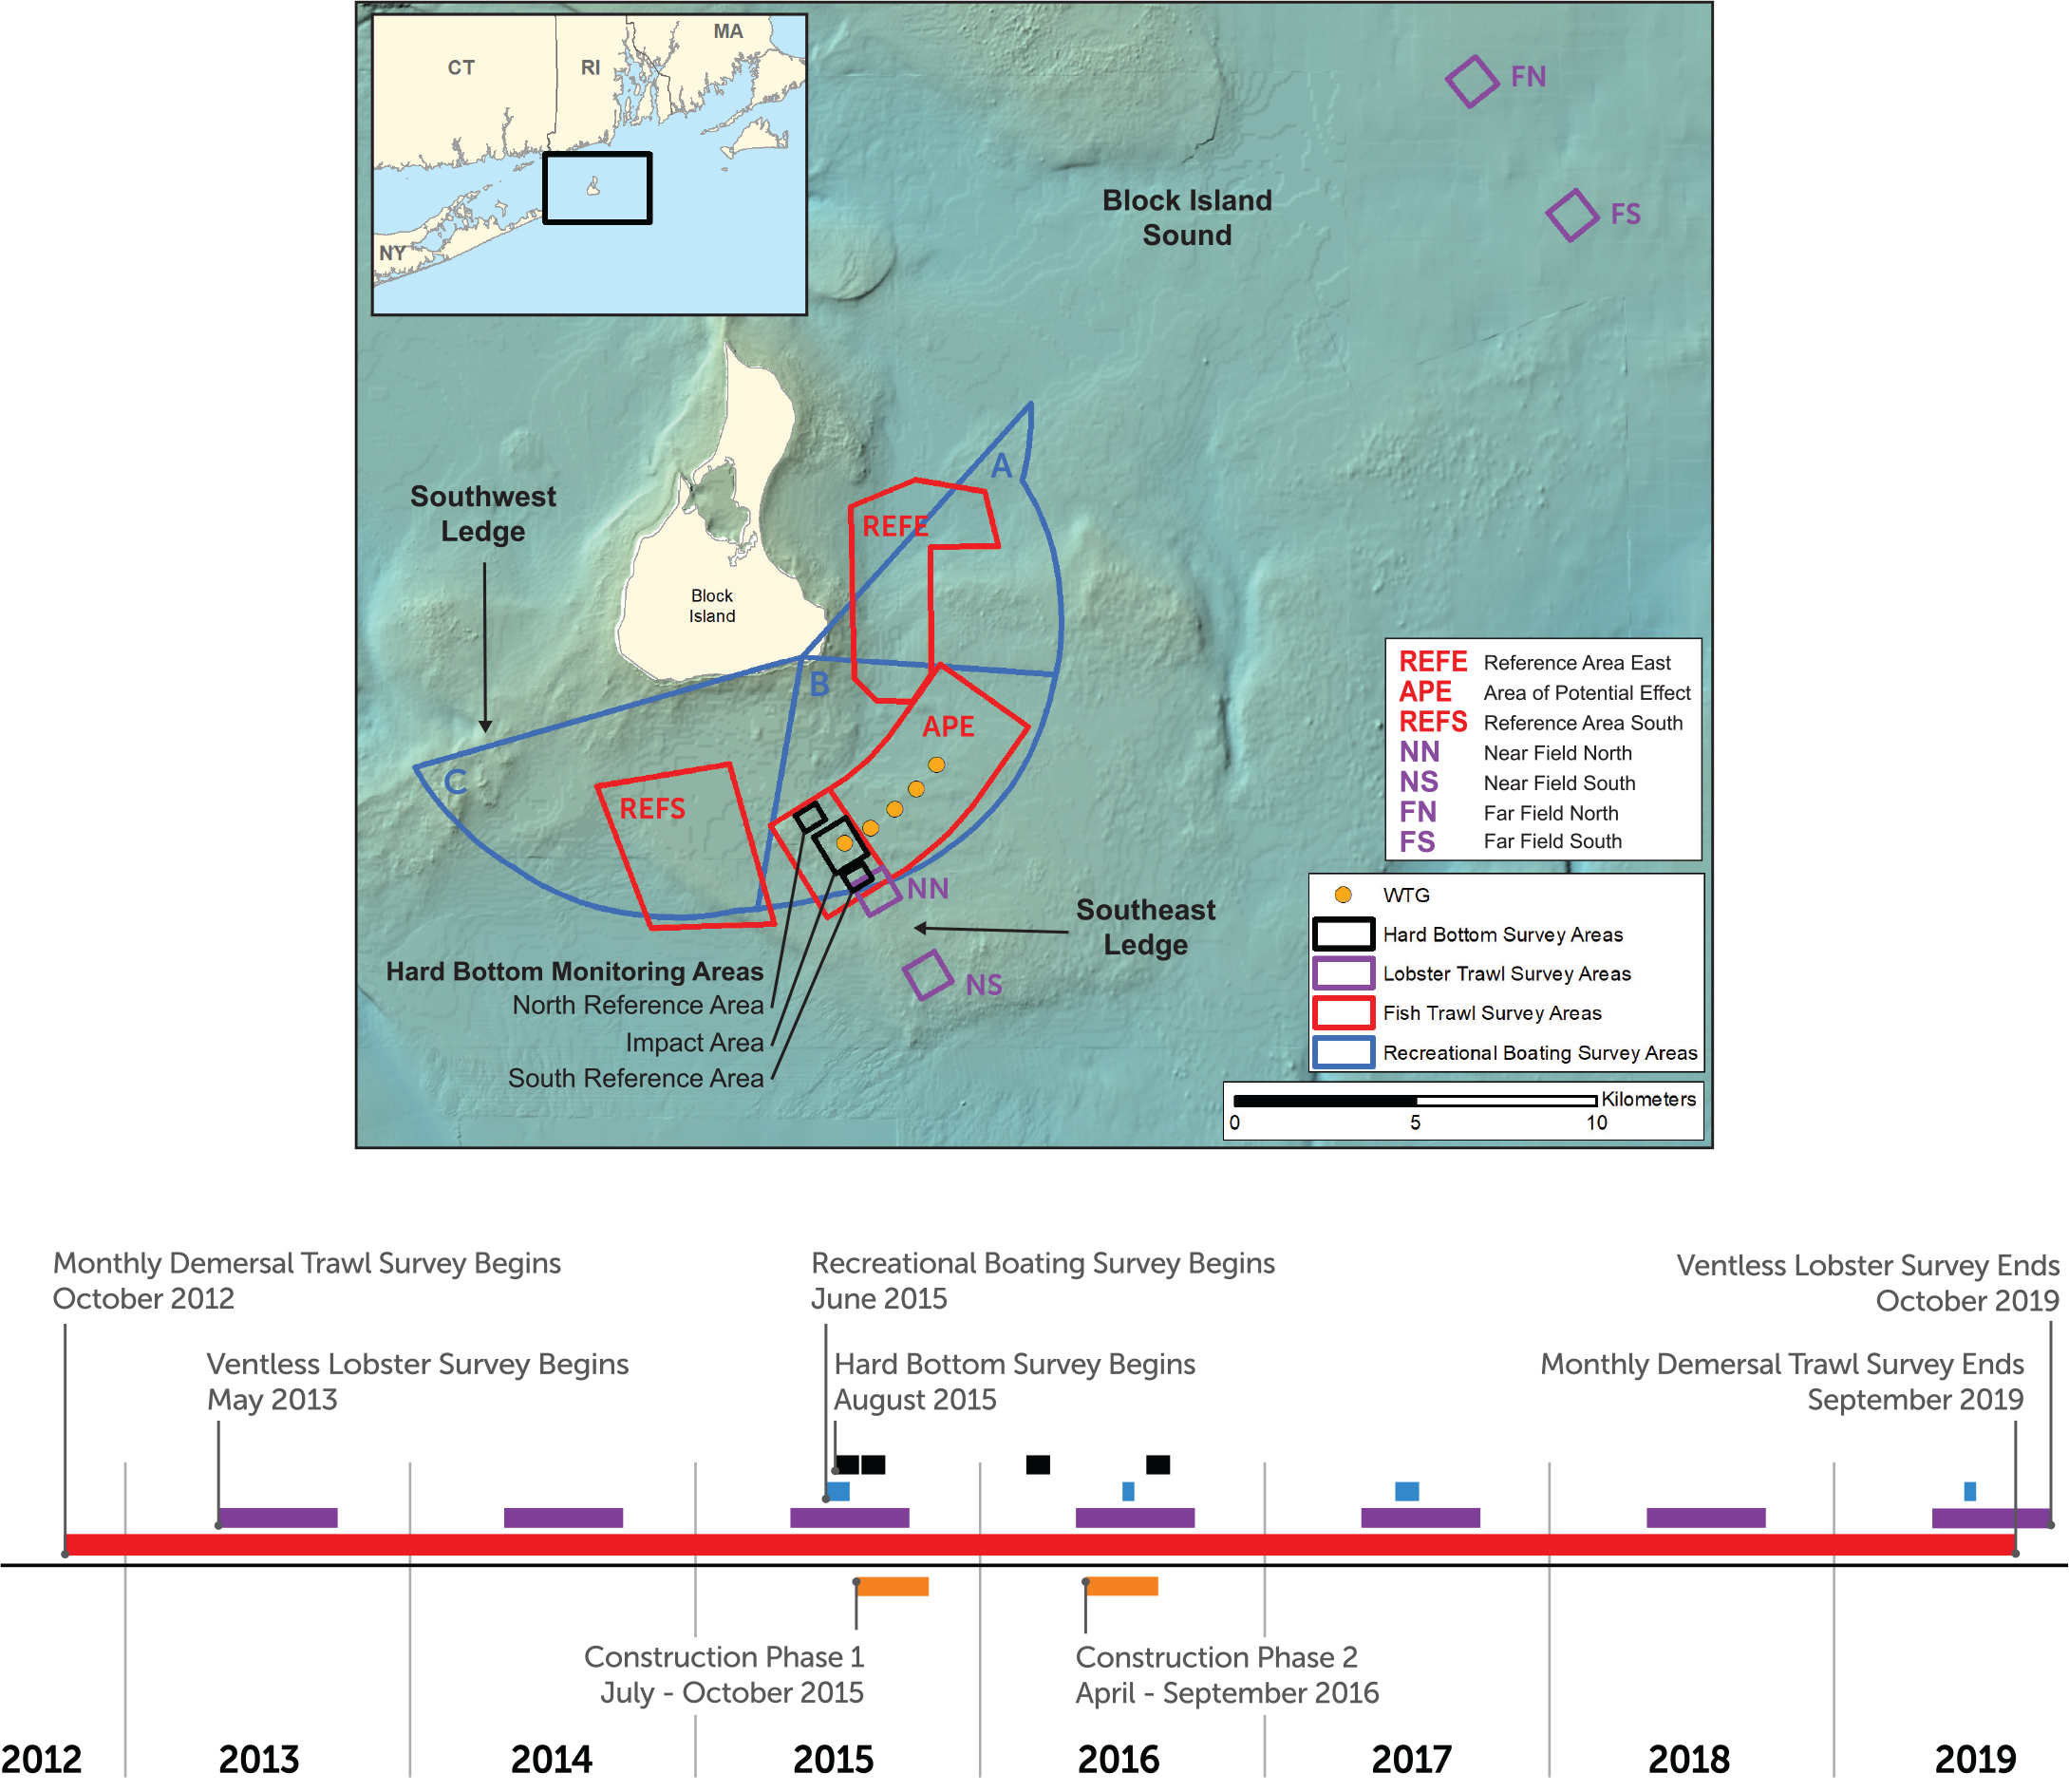
Figure 2. Survey footprints and timeline of four complementary multiyear studies conducted at the Block Island Wind Farm. > High res figure
|
Principles of study design included consultation with commercial and recreational users, adaptive monitoring based on data and stakeholder feedback, and cooperative research with commercial fishermen. Sampling was based on methods consistent with regional surveys (e.g., ASMFC, 2015; Bonzek et al., 2017) and included data on multiple metrics to evaluate fish and fisheries resources. Statistical considerations included stratified random sampling within a before-after-control-impact (BACI) design, using customized linear contrasts (e.g., Chevalier et al., 2019; Schad et al., 2020) and power analysis (when possible) to determine sample size.
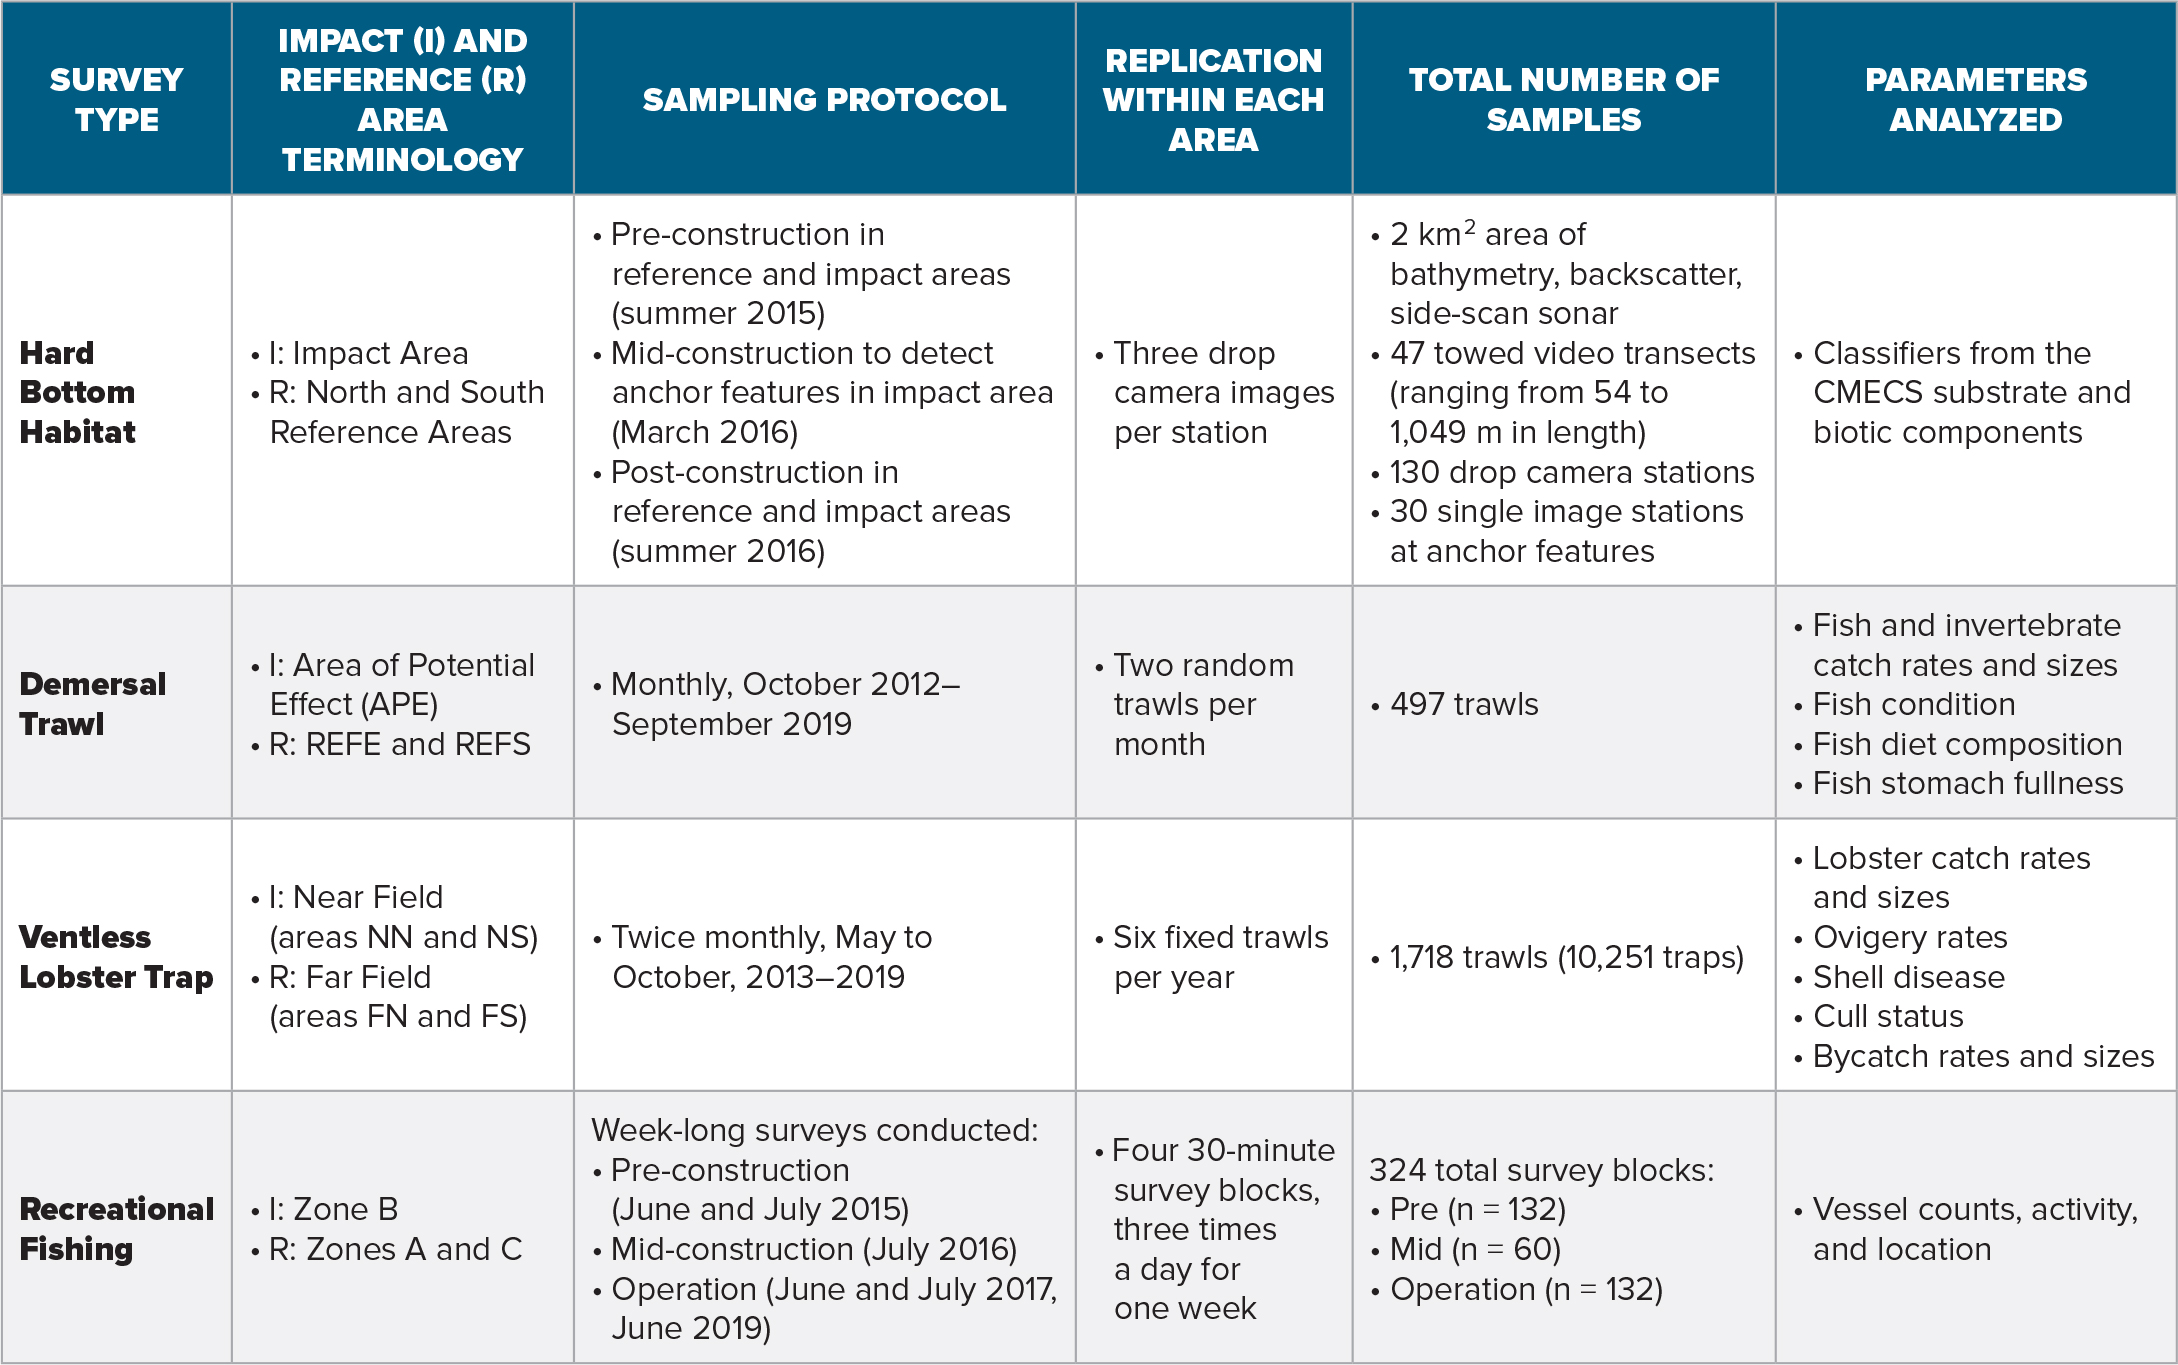
Sampling designs were developed through an iterative collaborative process with state and federal regulators and stakeholders (commercial and recreational fishing and user groups) and direct meetings with local fishermen. Over 20 meetings of these groups and 15 meetings with fishermen resulted in a cooperative research design where fishermen identified suitable sampling locations, conducted the sampling with onboard scientists, and engaged in the interpretation of data. For each study, sampling began before construction in reference and potential-effect areas defined by their proximity to the planned installation area. The locations and sizes of these areas were scaled to the sampling method and expected effects; hence, they are distinctly named for each study (Table 1; Figure 2). Hard bottom habitat (HBH) surveys of limited duration were conducted during three sampling periods over 15 months, with planned sampling at three and five years post-construction canceled with approval of state and federal regulatory agencies based on initial post-construction results. These surveys focused on HBH adjacent to the southern end of the wind farm using stratified random sampling, with post-construction locations adaptively added based on results of multibeam echosounder (MBES) mapping. Demersal trawl surveys began two years and eight months before construction, with monthly data collected from randomized trawl lines for seven years in three areas identified as suitable by commercial trawlers. Ventless lobster trap surveys began two years and two months before construction, with bimonthly data collected for seven years, in two locations with two areas each, which were identified by commercial lobstermen. Each year, trawl locations were randomly selected and revisited every two weeks May through October. Week-long recreational boating surveys that focused on identifying the locations of fishing activity began one month before construction and continued across four years. They were timed around one or two of the busiest recreational boating weekends each year, with data collected from three contiguous marine areas visible to a single observer on Block Island.
Table 1. Sampling protocols for the hard bottom habitat, demersal trawl, ventless lobster trap, and recreational fishing studies conducted for the Block Island Wind Farm. REFE = Reference Area East. REFS = Reference Area South. NN = Near Field North. NS = Near Field South. FN = Far Field North. FS = Far Field South. > High res table
|
BACI study designs offer a powerful tool for detecting environmental impacts because they account for both temporal and spatial changes (Underwood, 1992; E. Smith et al., 1993; Stewart-Oaten and Bence, 2001). Natural spatial heterogeneity was acknowledged early in the design process and ameliorated by the inclusion of two reference areas for each survey. Sampling frequency was designed for each survey, tailored to provide the sampling intensity needed for examining potential impacts not only of wind farm operation but also of construction periods that included turbine installation and cable placement (Lindeboom et al., 2015; Dannheim et al., 2020).
HARD BOTTOM HABITAT
Physically complex and limited in distribution in Rhode Island Sound (RICRMC, 2010), HBH is critical for ecologically and economically important taxa such as American lobster (Wahle and Steneck, 1991), juvenile Atlantic cod (Gotceitas and Brown, 1993), and longfin squid (Griswold and Prezioso, 1981). Because these habitats provide stability and physical complexity, they are a focal point for regulatory conservation and mitigation, but prior to BIWF, few OSW farms have been located within 1 km of HBH (e.g., Wihelmsson and Malm, 2008; Roach et al., 2018). The BIWF was sited to avoid construction directly in HBH, although one turbine was located close to HBH (Figure 2; HDR, 2018). Because HBH is present in several proposed US OSW areas, monitoring effects of construction within these habitats is important for potential mitigation of OSW development. Baseline, mid-, and post-construction surveys were designed to develop methodologies for assessing the abiotic and biotic features and distribution of HBH and OSW construction effects on these habitats (Guarinello and Carey, 2020) and to detect and evaluate disturbance and recovery from anchoring activity conducted proximal to these habitats (Guarinello et al., 2017).
HBH Sampling Design
Three surveys were conducted: (1) a baseline survey prior to construction in summer 2015, (2) a mid-construction survey in March 2016 to detect anchor effects in an area identified as at potential risk of impact, and (3) a post-construction survey in August 2016 prior to operation (Figure 2). For the baseline survey, a spatially balanced stratified random sampling design was used to select target stations for drop camera imaging within equal-area sampling grids (strata) in each monitoring area (North Reference, South Reference, Impact). Video transect locations were selected to provide broad coverage and to capture gradients in seafloor topography. For the March 2016 survey, coordinates of anchor locations and MBES data were used to position video transects and drop camera stations. The August 2016 post-construction survey determined if disturbance features identified in the March 2016 survey recovered and compared reference areas to the Impact Area. Video and drop camera survey locations were modified in real time to collect data at disturbance features detected in MBES data.
HBH Analytical Methods
Habitat data were evaluated using the Coastal and Marine Ecological Classification Standard (CMECS) recommended by federal regulators (FGDC, 2012), with modifications to reflect inferred physical stability (Guarinello and Carey, 2020). In addition to our study, a separate project recorded visual observations of construction activities during each phase of the project, and MBES monitoring was conducted on disturbance features from anchors and jackup barges in soft sediments at six-month intervals from May 2016 to May 2017 to document physical recovery (HDR, 2018).
Lessons Learned from HBH Sampling Design
The study design used several approaches to capture physical and biological recovery from habitat disturbance, including MBES time-series mapping and randomized analysis of biotic cover of disturbed soft bottom habitats as well as non-random MBES mapping of post-construction conditions with directed high-resolution imagery of disturbed and undisturbed features. By adaptively monitoring (i.e., directing video and camera locations to disturbed habitat identified by MBES), the probability of characterizing recovery was increased compared to the use of as-built anchor locations or random sampling. The rate of physical seafloor recovery in mobile sand sediments (surface returning to baseline conditions) can be related to seabed mobility, with areas of higher seafloor energy with finer sand recovering more quickly (K. Smith and McNeilan, 2011; HDR, 2018). However, biological recovery of HBH may be inversely related to seabed mobility (Wilhelmsson and Malm, 2008). Two studies evaluated recovery of the seafloor from physical disturbance that resulted in distinct furrows due to anchor drag (HDR, 2018; Guarinello and Carey, 2020). Some furrows (drag marks) were unchanged in MBES signature over time due to the presence of boulders lining the furrows (Figure 3). Biological growth on the boulders returned in less than a year, with mean percent cover increasing from 10% to 62% in August 2016 compared to March 2016 (Guarinello et al., 2017). MBES surveys in October 2016 and May 2017 noted that 32% of the drag marks created in soft sediment without boulders in 2015 had fully recovered physically by May 2017 (HDR, 2018). Use of multiple survey approaches revealed the clear contrast in the response of mobile habitats to construction disturbance (return to baseline profile) compared to relocated boulders (return to baseline biological cover, but similar physical profile).
Modification of CMECS to include physical habitat stability proved a useful tool for interpreting video data, and combining this approach with adaptive sampling could be an effective methodology for studies of hard bottom effects at other OSW projects that involve relocated boulders (Guarinello and Carey, 2020).
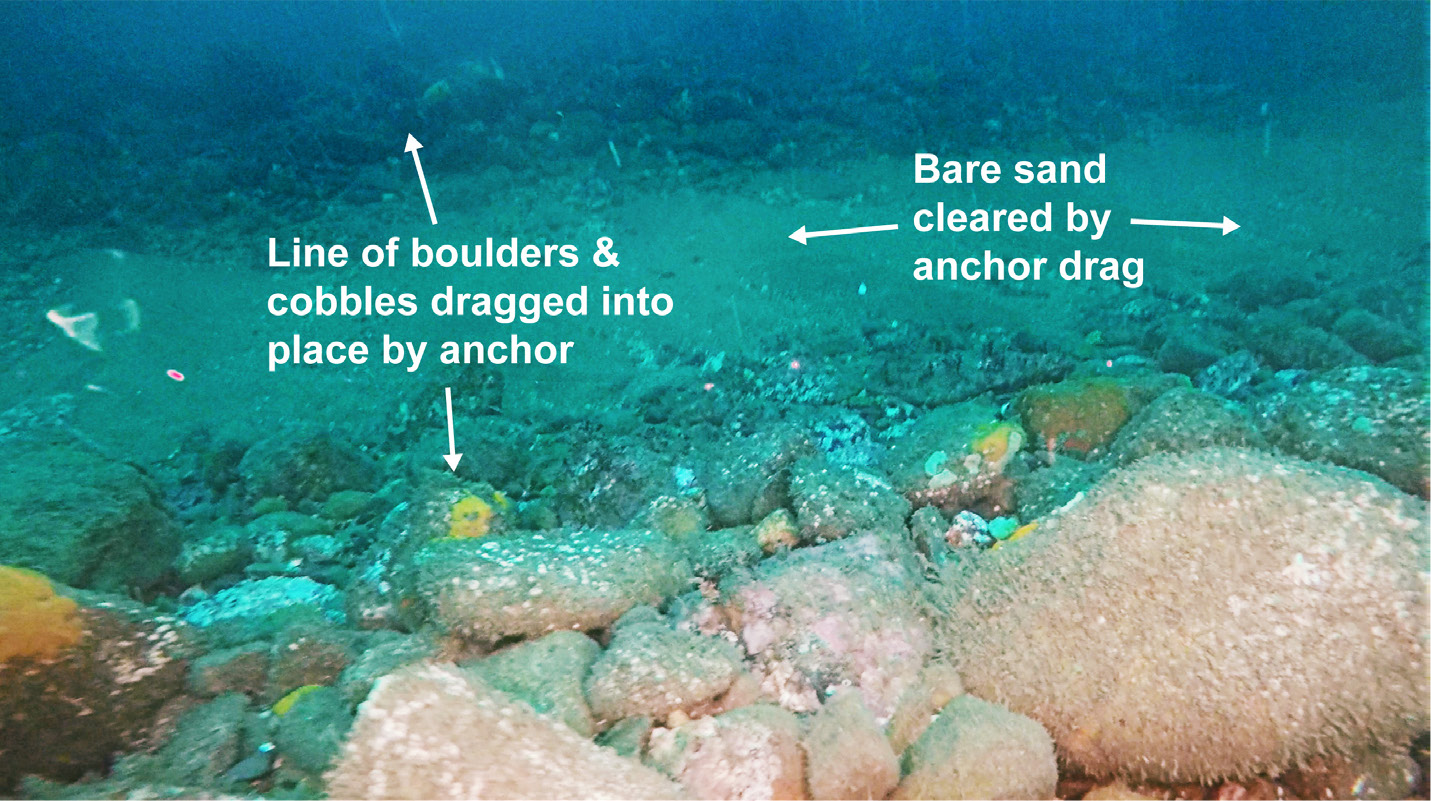
Figure 3. Anchor furrow imaged by towed video during the March 2016 post-construction survey. > High res figure
|
DEMERSAL FISH
Stakeholder feedback from the permitting process identified potential effects on demersal fish, lobster, and sport fish as primary concerns (RICRMC, 2010). The demersal trawl surveys were designed in conjunction with ventless trap surveys (see below) to measure how the fish and invertebrate community near the BIWF was affected by construction and operation. The study area had limited scientific fish sampling data from regional surveys so the usage of the site by fish was poorly known (RICRMC, 2010).
Trawl Sampling Design
Baseline, construction, and operational sampling with a demersal otter trawl occurred monthly over seven years near the wind farm in an area of potential effect (APE) and in two nearby reference areas (REFE and REFS; Figure 2). Habitat characteristics (depth and substrate composition) were similar in all areas. Gear and sampling protocols consistent with those used by the long-term, biannual demersal trawl survey in Rhode Island Sound (Bonzek et al., 2017) allowed comparison with historical data and broadened the spatial context of the study. Cooperative research using a commercial fishing vessel, captain, and crew, with scientists onboard to process the catch, promoted communication with the local fishing community that facilitated adaptive monitoring in response to fishermen’s concerns.
Fish populations naturally exhibit large variability in abundance, which can weaken even a robust BACI approach to assessing wind farm impacts based on catch statistics alone (Lindeboom et al., 2015; Methratta, 2020). Recreational fishermen were concerned about lack of information regarding effects on prey species. Therefore, additional metrics (fish condition, stomach fullness, and prey composition) were included for flounders, hakes, and cod. An example of adaptive monitoring was the inclusion of black sea bass in the diet study component during the seventh year of sampling in response to an industry concern that juvenile lobsters were being consumed by these fish. Select preliminary demersal trawl results for the first six years are provided here to illustrate lessons learned from this study (data processing for the seventh year is ongoing).
Trawl Analytical Methods
Statistical methods focused on estimating the 95% confidence intervals (95CI) around measures of change described by pre-specified contrasts. BACI interaction contrasts described the spatial differences (APE versus each reference area) in mean abundance between the baseline and operation time periods. A similar interaction contrast was used to describe the spatial differences in mean abundance between baseline and the two construction periods. Catch data (average monthly catch per trawl) were modeled in R (R Core Team, 2019) as a function of area and year with negative binomial generalized linear models (GLMs) with a log-link. Monte Carlo confidence intervals were constructed for the contrasts using 5,000 draws from the multivariate distribution of model coefficients. Diet composition data, stomach fullness indices, and fish condition indices calculated from length-weight regressions were graphed to depict spatial and temporal changes, and analyses of variance (ANOVAs) were conducted when sufficient data were available. Multivariate analysis included spatial and temporal comparisons of fish and invertebrate community composition and prey assemblage composition using non-metric multidimensional scaling (nMDS) and analysis of similarities (ANOSIM) based on the Bray-Curtis distance metric (Clarke et al., 2014).
Lessons Learned from Trawl Sampling Design
Multiple metrics (catch rates, assemblage composition, condition, diet composition, and stomach fullness) were useful to assess potential wind farm effects and provided a more complete understanding of how turbine foundations function as shelter and colonization resources. For instance, although spatial and temporal differences in abundances were evident, results for the interaction contrasts of the catch rate models often did not reflect an impact statistically different from zero (i.e., where 95CIs excluded zero). As an example, the longfin squid BACI contrast between APE and REFE had an expected 82 fewer squid per tow (0.003 fewer squid per m2) during the operation period compared to the baseline time period with 95CI [–341, 109]. The width of this statistically nonsignificant confidence interval illustrates how the inherently large variance in catch data results in low statistical power for anything but large effect sizes. Notably, this survey collected 53,860 squid using 426 trawls over six years. Longfin squid distributions also provide a good example of a species with consistent spatial trends in catch throughout the study, with consistently higher abundances at the REFE than in the APE or REFS (Figure 4). In contrast, black sea bass abundances dramatically increased (over 1,200%) between baseline and operation periods at the APE, while changes at the reference areas were more modest (Figure 4). However, the interaction contrasts were not statistically significant for either REFE (95CI of –328, 21) or REFS (95CI of –338, 5), demonstrating the importance of not relying solely on statistical outcomes when evaluating potential wind farm effects. Black sea bass is a structure-seeking species that prefers complex bottom habitat, as provided by the turbine foundations (Guida et al., 2017).
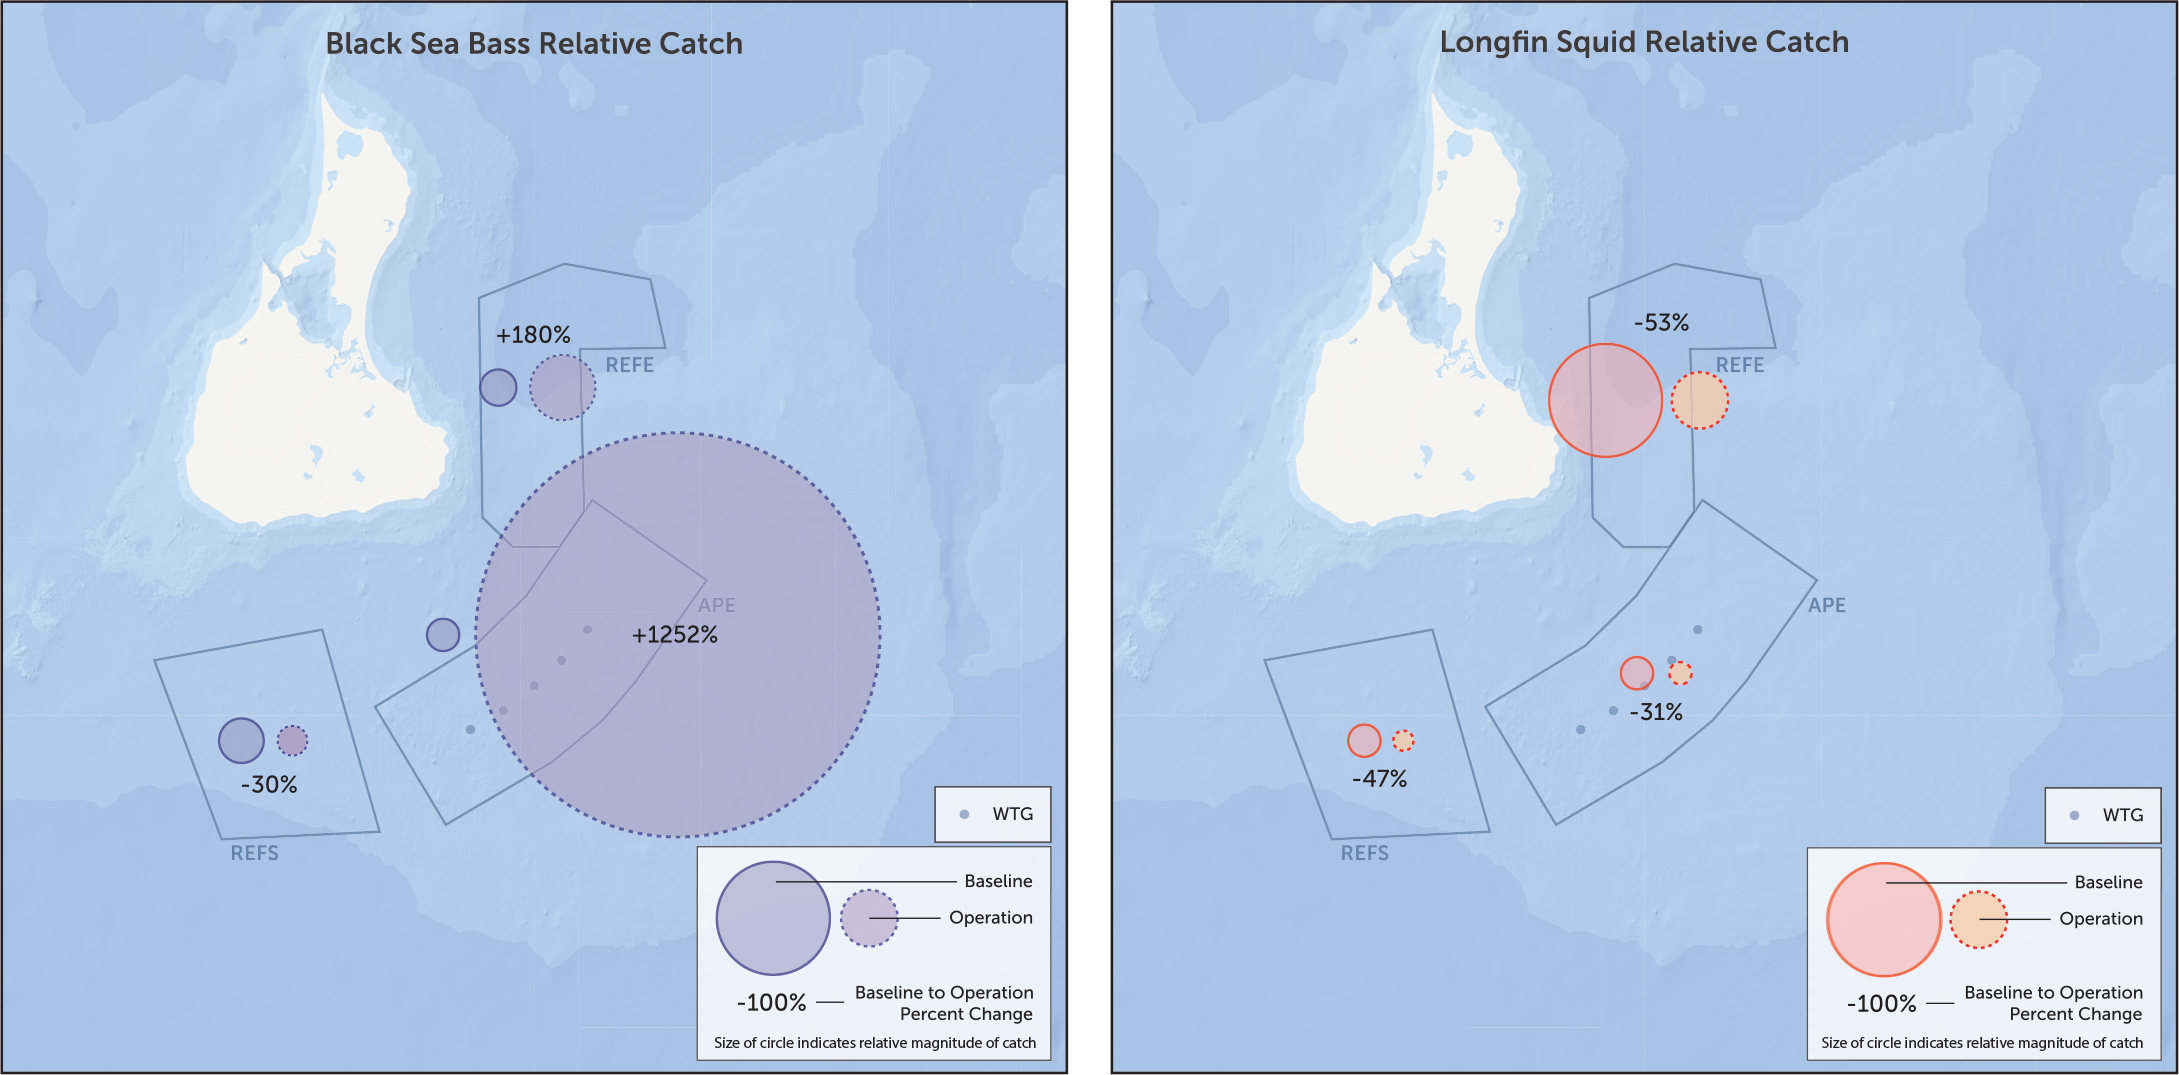
Figure 4. Relative catches of longfin squid and black sea bass in the demersal trawl survey for the baseline and turbine operation periods in the area of potential effect (APE) and reference areas (REFE and REFS). Circle size indicates relative magnitude of average catch; percentages indicate the changes between baseline and turbine operation periods for each area. > High res figure
|
The preliminary BACI analyses comparing two years of the baseline period to two years of wind farm operation revealed the value of two reference areas and comparable regional studies that provided context. For instance, conclusions varied in some cases depending on the reference area used for comparison. Most commonly, similar changes in abundance occurred at both the APE and at least one reference area between the baseline and operation periods. In other cases, consistent results suggested a regional trend, such as declining abundances of Atlantic herring, alewife, and butterfish in all areas over six years and in regional surveys (Wilber et al., 2020a). Use of a single reference area in future studies may not adequately account for the role of spatial variability for a highly stochastic metric such as fish and invertebrate catches.
Diet composition was an important aspect of survey design, providing a window into wind farm effects on trophic relationships of importance to user groups. Lobsters were not found in the stomachs of black sea bass, although crabs were a common prey item for them. Ten times more winter flounder had blue mussels in their diets during the operation period, coinciding with the concentration of blue mussels, an early colonizer of the turbine foundations (HDR, 2020), in relatively large numbers in the APE and the REFS (Wilber et al., 2020a).
Because the timing and scale of construction and operation were unknown during study design, the BACI design with continuous monthly sampling for the study duration was crucial. Monthly abundance data during the discontinuous construction phases were compared to baseline data and regional data from the same months. The short time periods for the construction activities limited statistical power for the interaction contrasts on some of the additional metrics; therefore, analyses included graphical comparisons of stomach fullness indices and prey composition in the diets of focal predators among areas. Depictions of spatial and temporal trends in these metrics can inform assessment of potential construction effects; thus, the inclusion of these metrics in future monitoring of other OSW projects should be considered.
LOBSTERS AND CRABS
Ventless Trap Sampling Design
Ventless trap surveys were conducted twice per month during lobster season (May to October) over seven years, ending in October 2019 (Table 1). Preliminary survey results are provided here to illustrate lessons learned and are based on the first six years of the study; data processing for the seventh year is ongoing. Sampling was conducted in two potential impact areas near the wind farm, Near Field North (NN) and Near Field South (NS), and two reference areas approximately 22 km distant from the wind farm, Far Field North (FN) and Far Field South (FS) (Figure 2). The sampling design was influenced by the results of a power analysis that used regional catch data for 2006–2012 from a ventless trap survey (ASMFC, 2015) to identify background variability and illustrate the relationship between sampling effort and precision of catch estimates. The final design integrated these sample-size estimates with additional input from lobstermen, including steps to mitigate gear loss (trawl orientation, number of traps per trawl), soak time to allow for adequate trap fill, and fine-tuning site selection to reduce user conflicts (existing gill nets and tow tracks). The design also incorporated the Rhode Island lobster industry request that the survey include at least one vented trap per six-trap trawl for comparison with commercial fishing efforts and to reduce a potential bias of trap saturation by juveniles and crabs.
Lobster size, female reproductive status, shell disease, and claw loss (cull status) also were monitored. Female reproductive status was noted to identify locations with favorable conditions for egg development and hatching and to examine potential effects of BIWF construction and/or operation. The increase in shell disease prevalence in Rhode Island Sound since the late 1990s (Castro and Somers, 2012) and claw loss can be indicators of environmental stress. Claw loss also creates individuals that are less valuable to the fishery than intact lobsters. Catch rates and individual sizes were also evaluated for several bycatch species that were developing or established as commercial and recreational fisheries in the area, such as Jonah crab (Cancer borealis), rock crab (Cancer irroratus), and black sea bass (Centropristis striata).
Ventless Trap Analytical Methods
Similar to the demersal trawl survey, statistical methods focused on estimating the 95CI around measures of change described by pre-specified contrasts. Lobster catch data (average annual catch per trap [CPUE] for the six-trap trawls) were modeled in R as a function of area and year with normal GLMs and a log-link. Models for other metrics, for example, proportion ovigerous, shell disease, and claw status, were constructed similar to catch data, but with binomial GLMs and a logit-link.
Lessons Learned from Ventless Trap Sampling Design
Assessing multiple metrics provided a means to evaluate several potential mechanisms of effect. The number of years surveyed allowed comparison with regional trends. Average lobster catches were lower during the operation period both Near Field (difference of –0.6, 95CI [–1.0, –0.3]) and Far Field (difference of –0.5, 95CI [–0.9, –0.2]), reflecting a trend of declining catches throughout the region (Wilber et al., 2020b). Spring (late-stage eggs) ovigery rates increased between the baseline and operation time periods to a greater extent in the Far Field (difference of 25%, 95CI [11%, 38%]) than near the wind farm where ovigery rates were highly variable (difference of 7%, 95CI [–27%, 38%]). Use of two sampling blocks in both the Near Field and the Far Field (Figure 2) provided a better understanding of spatial variation in late-stage, ovigerous female distributions; for example, ovigery rates at NS increased 14% between the baseline and the operation time periods compared to a decrease of less than 1% at NN.
Potential construction effects were examined by comparing estimates between months in which construction occurred to the same months during the baseline period (Figure 2). Bimonthly sampling provided sufficient data to determine that lobster catches were significantly higher near the wind farm during Phase I construction (difference of 0.5, 95CI [0.1, 1.0], Figure 5; Wilber et al., 2020b), and significantly higher everywhere during Phase II (difference of 1.1 in the Near Field, 95CI [0.7, 1.5] and 4.5 in the Far Field, 95CI [4.1, 4.9]), a period during which high catches were observed throughout the region as corroborated by Rhode Island and Massachusetts state surveys (Wilber et al., 2020b).
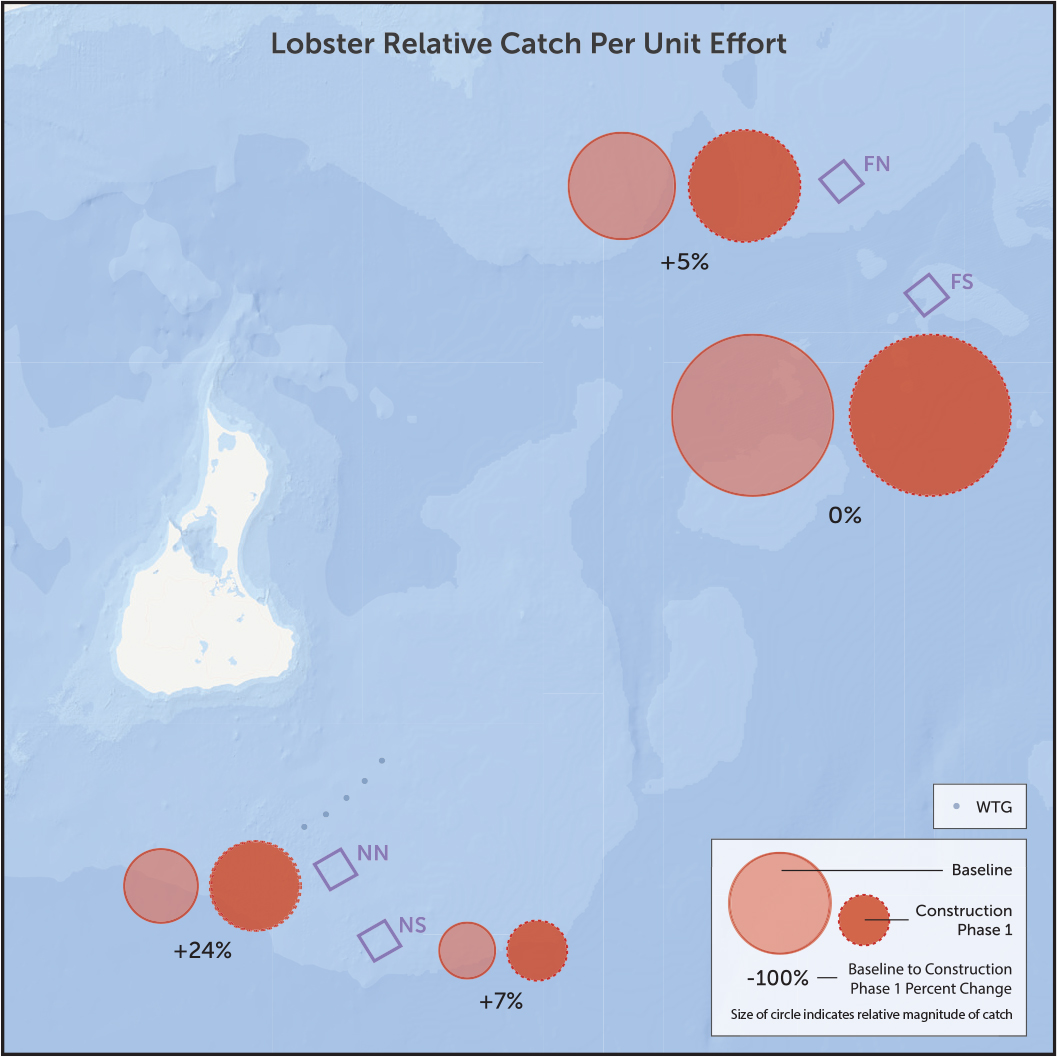
Figure 5. Relative catches of lobster in the ventless trap survey for the baseline and turbine installation periods at two sampling areas near the wind farm (NN and NS) and two far-field areas (FN and FS). Circle size indicates relative magnitude of average catch; percentages indicate the changes between baseline and turbine installation for each area. > High res figure
|
During the last survey of each year (late October), lobster catch rates at the Near Field areas were often still near their annual high, while catch rates in Far Field areas were near zero (FN) or between 20% and 50% of the annual high (FS). This seasonal trend in catches declining earlier with increasing proximity to the mainland is consistent with seasonal offshore movement as nearshore water temperatures decline (Goldstein and Watson, 2015). Annual lobster catches were consistently higher at the Far Field areas throughout all years of sampling. In hindsight, extending the survey an additional month would have more fully captured the seasonal migration patterns of lobsters in the areas sampled, and would have provided another month for evaluation of the Phase II construction period.
RECREATIONAL BOATING
Block Island has extensive recreational boating activities that include sailing regattas, diving, and recreational fishing (RICRMC, 2010; Smythe et al., 2016). The importance of these activities and the potential for disruption led RICRMC to require recreational boating surveys before, during, and after construction, scheduled for peak boating weekends, as part of the approval for the project (RICRMC, 2010). Because the BIWF is located close to natural reefs and OSW structures can function as artificial reefs, determining the response of recreational fishing activity to new structure was an important goal of the survey (Wilhelmsson and Malm, 2008). The location of turbine structures within 5.3 km of Block Island allowed visual surveys from a fixed location onshore to assess recreational boating activities.
Recreational Boating Sampling Design
Six point-count surveys of recreational boating were conducted in June and July during pre-construction, construction, and operation time periods (Sabo et al., 2020; Table 1). For each survey, a single observer recorded vessels from a single vantage point during four 30-minute survey blocks in the morning, afternoon, and evening over the course of approximately one week. In addition to vessel activity (fishing, transiting, diving, other), vessel locations were recorded to explore spatial patterns of recreational boating intensity. The field of view was divided into three spatial zones separating the APE from adjacent areas (Figure 2). Zone A included part of the East Grounds fishing area, Zone B included the APE and Southeast Ledge, and Zone C covered most of Southwest Ledge, a popular recreational fishing and diving area.
Recreational Boating Analytical Methods
Vessel count data were grouped by project phase using the 30-minute survey block as the observational unit with variable level of effort among time periods (Table 1). Vessel counts were modeled as a function of project phase and spatial zone using Poisson GLMs and a log-link. Post-hoc comparisons were conducted to determine which groups were significantly different from one another (Tukey’s test, familywise α = 0.05). The Point Density Spatial tool (ESRI ArcMap) was used to calculate and plot the density of vessels across the survey area (vessels per square mile). Vessel densities were normalized by the level of effort. Direct pairwise comparisons of the spatial distribution of vessel density between pre-construction and during construction as well as pre-construction and operation were visualized (Figure 6).
Recreational fishing motorboats were overwhelmingly the most frequently observed vessel activity and type during the study. Over 91% of the observations of approximately 4,700 vessels were identified as a fishing vessel in transit or actively fishing. The number of vessels observed in Zones A and B were consistent among time periods, with the exception of a significant 40% increase in Zone B during operation (Figure 6). However, there was a significant increase (75%) in recreational boating intensity in Zone C (natural reef, located west of the turbines) during construction and operation compared to pre-construction (Figure 6).
Vessel traffic in Zone B was intensely clustered around Southeast Ledge during pre-construction and more evenly distributed among the turbine array during operation. Boating activity increased in intensity and spatial extent in all areas during operation (Figure 6b). Observations of increased boating activity around the turbines are consistent with reports of recreational fishermen targeting black sea bass, scup, and summer flounder in this area and consistent with higher black sea bass catches in the demersal trawl survey during operation (Figure 4). The greater increase in recreational fishing activity in Zone C during operation may reflect targeting different species that use natural reefs.
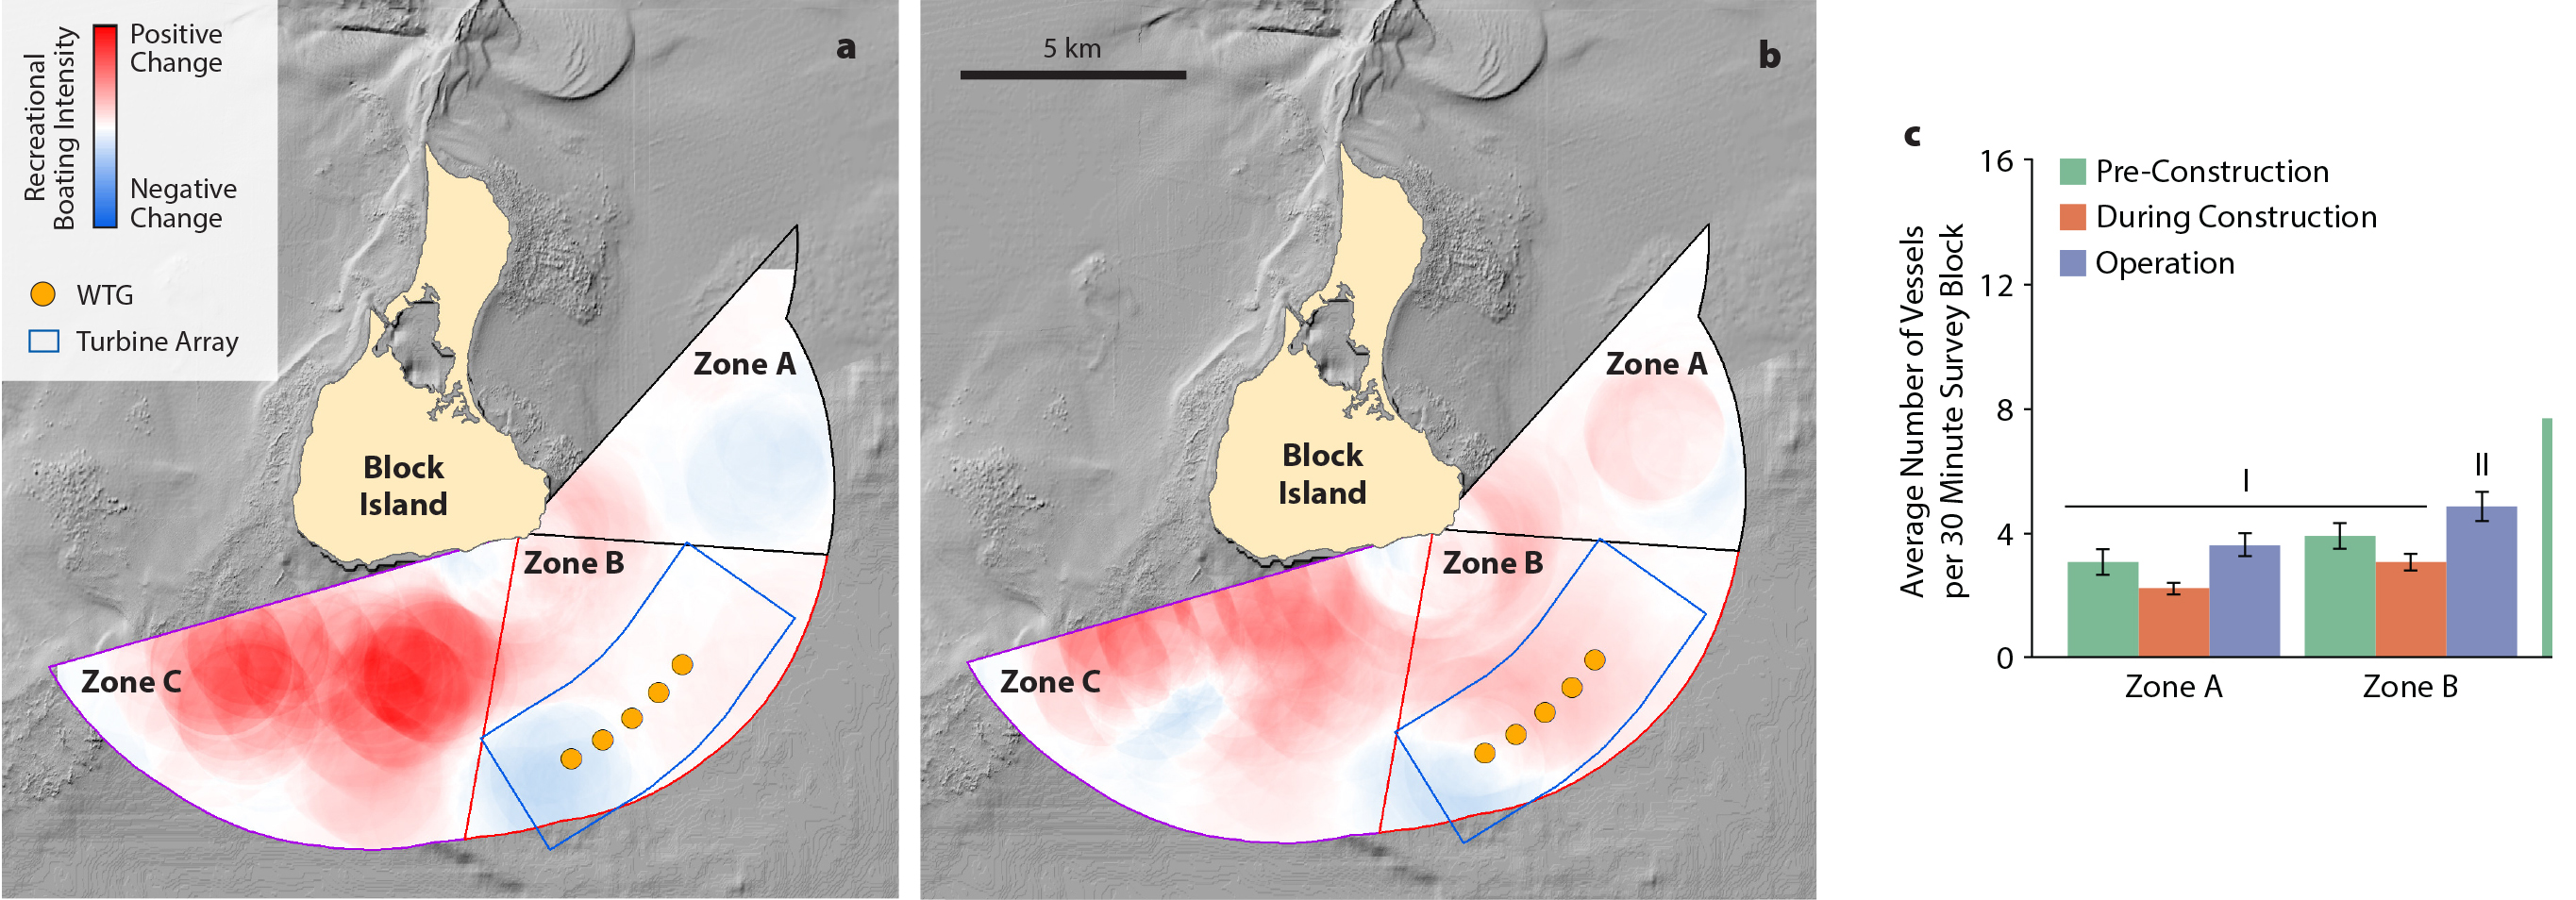
Figure 6. Comparison of recreational boating intensity observed: (a) pre-construction (2015) to construction (2016), and (b) pre-construction (2015) to operation (2017, 2019). WTG dots denote the locations of wind turbines. Boxes outlined in blue encompass the turbine array. (c) Notations of I, II, III, and IV indicate significant differences between groups. > High res figure
|
Lessons Learned from Recreational Boating Sampling Design
Rather than interviews or anecdotal reports, the study design used a unique attribute of the BIWF—visibility from shore—to conduct direct observations of boating activity. The sampling periods were defined by boating organizations, but not by the heaviest users—recreational fishermen. As a result, periods of potentially heavy use by fishermen may not have been sampled. Despite this limitation, results from one-week surveys during high summer use revealed that recreational fishermen are the primary users of the area surrounding the BIWF. Most of this activity was concentrated in several regions with valuable fish habitat. The area has experienced a spatial shift in fishing activity consistent with use of the turbine foundations as available hard structure, but recreational fishermen still fished in higher numbers at the adjacent natural rock reefs. These results inform planning for effects of OSW in areas with active recreational fishing targeting natural reefs. It is widely reported that recreational fishermen benefit from OSW structures at the BIWF (ten Brink and Dalton, 2018), but effects on use of natural reefs have not been reported; these anecdotal reports can be verified with on-site surveys and compared with appropriate biological sampling.
“Lessons learned included practical guidance, for example, for collaborating with stakeholders and regional scientists to address concerns through adaptive monitoring, quantifying uncertainty associated with BACI contrasts, and evaluating the duration of a seasonal lobster survey.”
|
DISCUSSION
The suite of monitoring studies conducted at the BIWF related to fishing resources provides a comprehensive and informative assessment of wind farm effects that can be built upon for future efforts. The creation of monitoring plans and research studies on the effects of US OSW development on fish and fisheries has been largely ad hoc and project-specific (NASEM, 2018). The primary practice has been to examine results of OSW studies in Europe and poll user groups on data gaps. However, extrapolating European study results to US OSW projects is likely to prove unreliable (Lindeboom et al., 2015) because of differences between the US Atlantic and European waters. In Europe, fishing limitations within wind farms create de facto marine protected areas that, for example, increase lobster productivity (Roach et al., 2018). Introduction of hard substrata is estimated to increase decapod abundances in areas where HBH is limited (Krone et al., 2017). These findings may not translate well to lobster and crab fisheries in portions of the US Atlantic because several planned wind farms occur in areas with HBH, and fishery closures are not anticipated. The challenge of developing fisheries monitoring plans and research for US OSW may best be informed by collaborative arrangements with local fishermen (sensu Stephenson et al., 2016) and a critical examination of relevant local conditions (e.g., habitats, populations, scale) in the broader context of longer-term results from Europe.
CONCLUSIONS AND LESSONS LEARNED
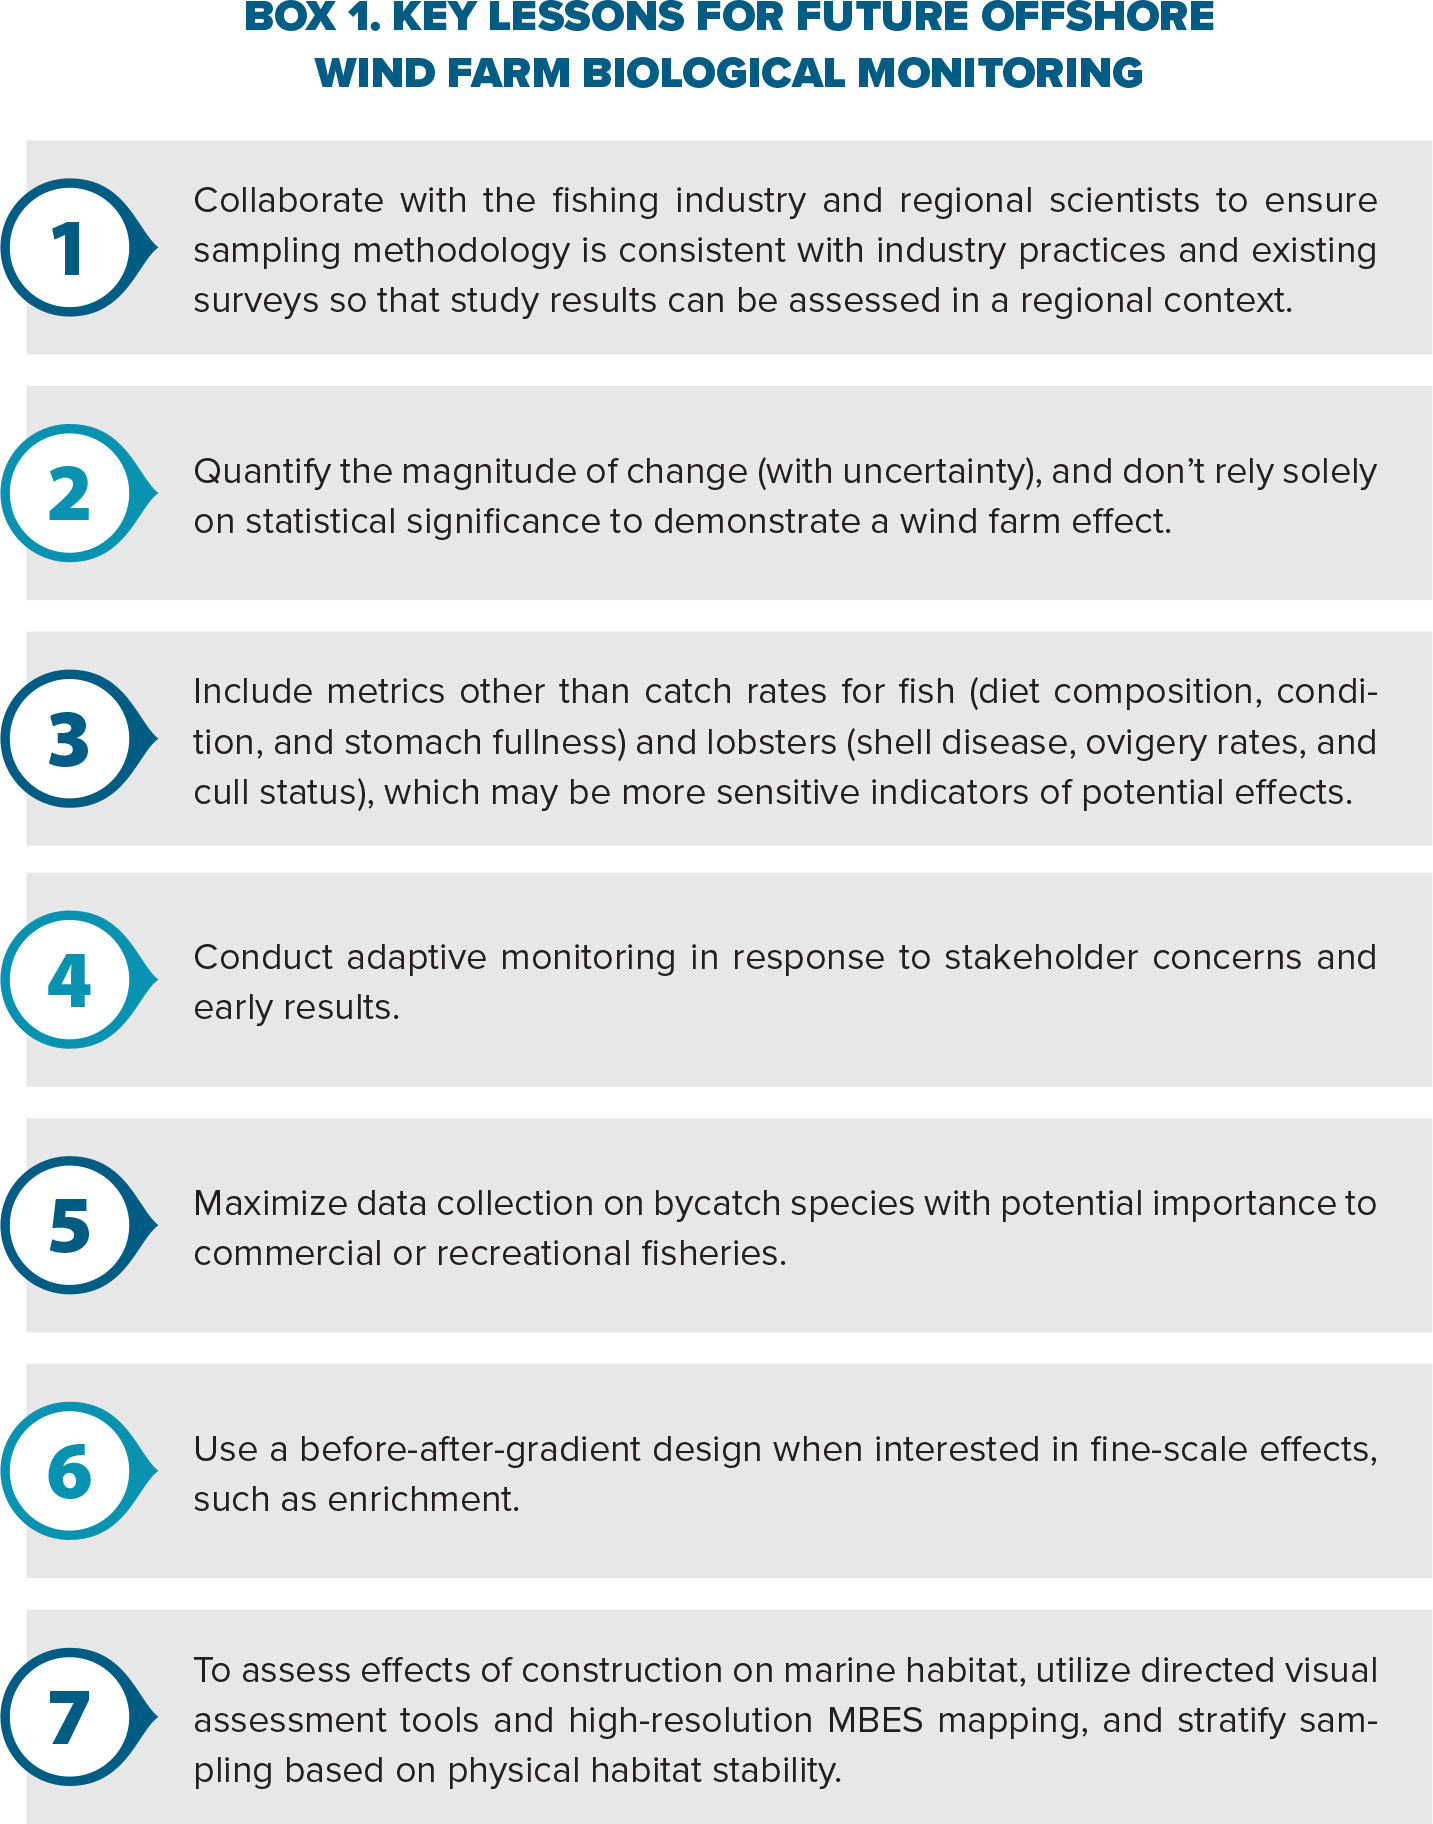
The design and execution of the BIWF monitoring studies produced substantive results while revealing important lessons about site assessment and monitoring (Box 1). Both soft and hard bottom habitats were present close to the BIWF, and construction effects were identified in both hard (Guarinello and Carey, 2020) and soft bottoms using directed visual and MBES surveys (HDR, 2018). Future surveys should include longer-term assessments of recovery of relocated boulders and of connectivity between introduced hard substrata (turbine foundations) and natural reefs.
|
The engagement of fishermen in cooperative research studies of demersal and epibenthic species (both commercially important species and bycatch) established approaches that produced results and lessons for future OSW monitoring. Notably, collecting data that are compatible with historical and ongoing regional surveys provides much-needed context for evaluating study results. Comparisons of BIWF survey results to other regional studies were required to evaluate whether observations made during wind farm operation reflected an effect that may have included reference locations or were part of a broader regional trend, including effects on behavioral and physiological traits not apparent from analysis of catch rates alone. For assessment of fine-scale effects with clear spatial gradients, such as responses to near-turbine benthic enrichment, before-after-gradient designs may have greater power (Methratta, 2020). Recognizing cases in which confidence intervals were broad also provides valuable information about whether the level of effort for, and the design of, these surveys were sufficient to detect changes of interest. However, guidance from regulatory agencies and stakeholders as to what level of change in catch is meaningful is lacking but greatly needed to improve future OSW survey designs. From residual variance for the dominant species in this study, the relationship between detectable effect sizes and level of effort may be estimated and used to inform future monitoring for Atlantic Coast OSW projects. Additionally, the value of alternative designs may be investigated, for example, the monthly, seven-year time series may be subsampled for variance estimates from less frequent sampling. Beyond statistical significance lies the more important and difficult question, which is: what constitutes a biologically meaningful difference?
European monitoring of OSW development has provided valuable guidance for design of US assessments (Lindeboom et al., 2015; Degraer et al., 2018; Dannheim et al., 2020). As the US OSW industry matures and moves from pilot- to utility-scale wind projects, assessment and monitoring of potential effects on marine resources will need to address the full “sphere of influence” (sensu Degraer et al., 2018) on both highly local (turbine) and regional ecosystem scales (Dannheim et al., 2020). These results provide a good starting point for US OSW studies and build upon decades of European experience.
ACKNOWLEDGMENTS
The authors thank E. Bellagamba Fucile for editing, Andy Lipsky for support on engagement, and Aileen Kenney for support of these studies. Funding was provided by Deepwater Wind Block Island. Special thanks to our commercial fishing partners Rodman Sykes, Bill McElroy, and Lanny Dellinger for meeting the challenge of conducting seven years of research on the effects of BIWF on commercial finfish and shellfish.