INTRODUCTION
An accelerating global shift toward displacing fossil fuel-based electricity with renewable energy sources has triggered the rapid development and deployment of offshore wind energy. At the beginning of 2023, over 290 operating offshore wind projects worldwide provided a combined power capacity of approximately 64 gigawatts (DOE, 2023; GWEC, 2023). By 2032, the cumulative global capacity is predicted to grow at least sixfold, exceeding 380 gigawatts (GWEC, 2021; DOE, 2023).
This surge necessitates the investigation and characterization of the meteorological and oceanographic (metocean) conditions in a rapidly expanding number of nearshore and offshore regions (generally up to 100 km from the coastline) where physical data are traditionally sparse. Modeling and data analysis methods rely on new measurement techniques (e.g., buoy-based lidar and flux systems), querying historical observations, and modeling advancements in order to characterize the full water column, the sea surface, and the marine atmospheric boundary layer (typically up to 1,000 m above the ocean surface) as well as the interactions between these regimes. These efforts benefit offshore wind interests and the broader oceanography community in several ways, including increased resolution of waves, currents, surface temperature, winds, and air-sea fluxes.
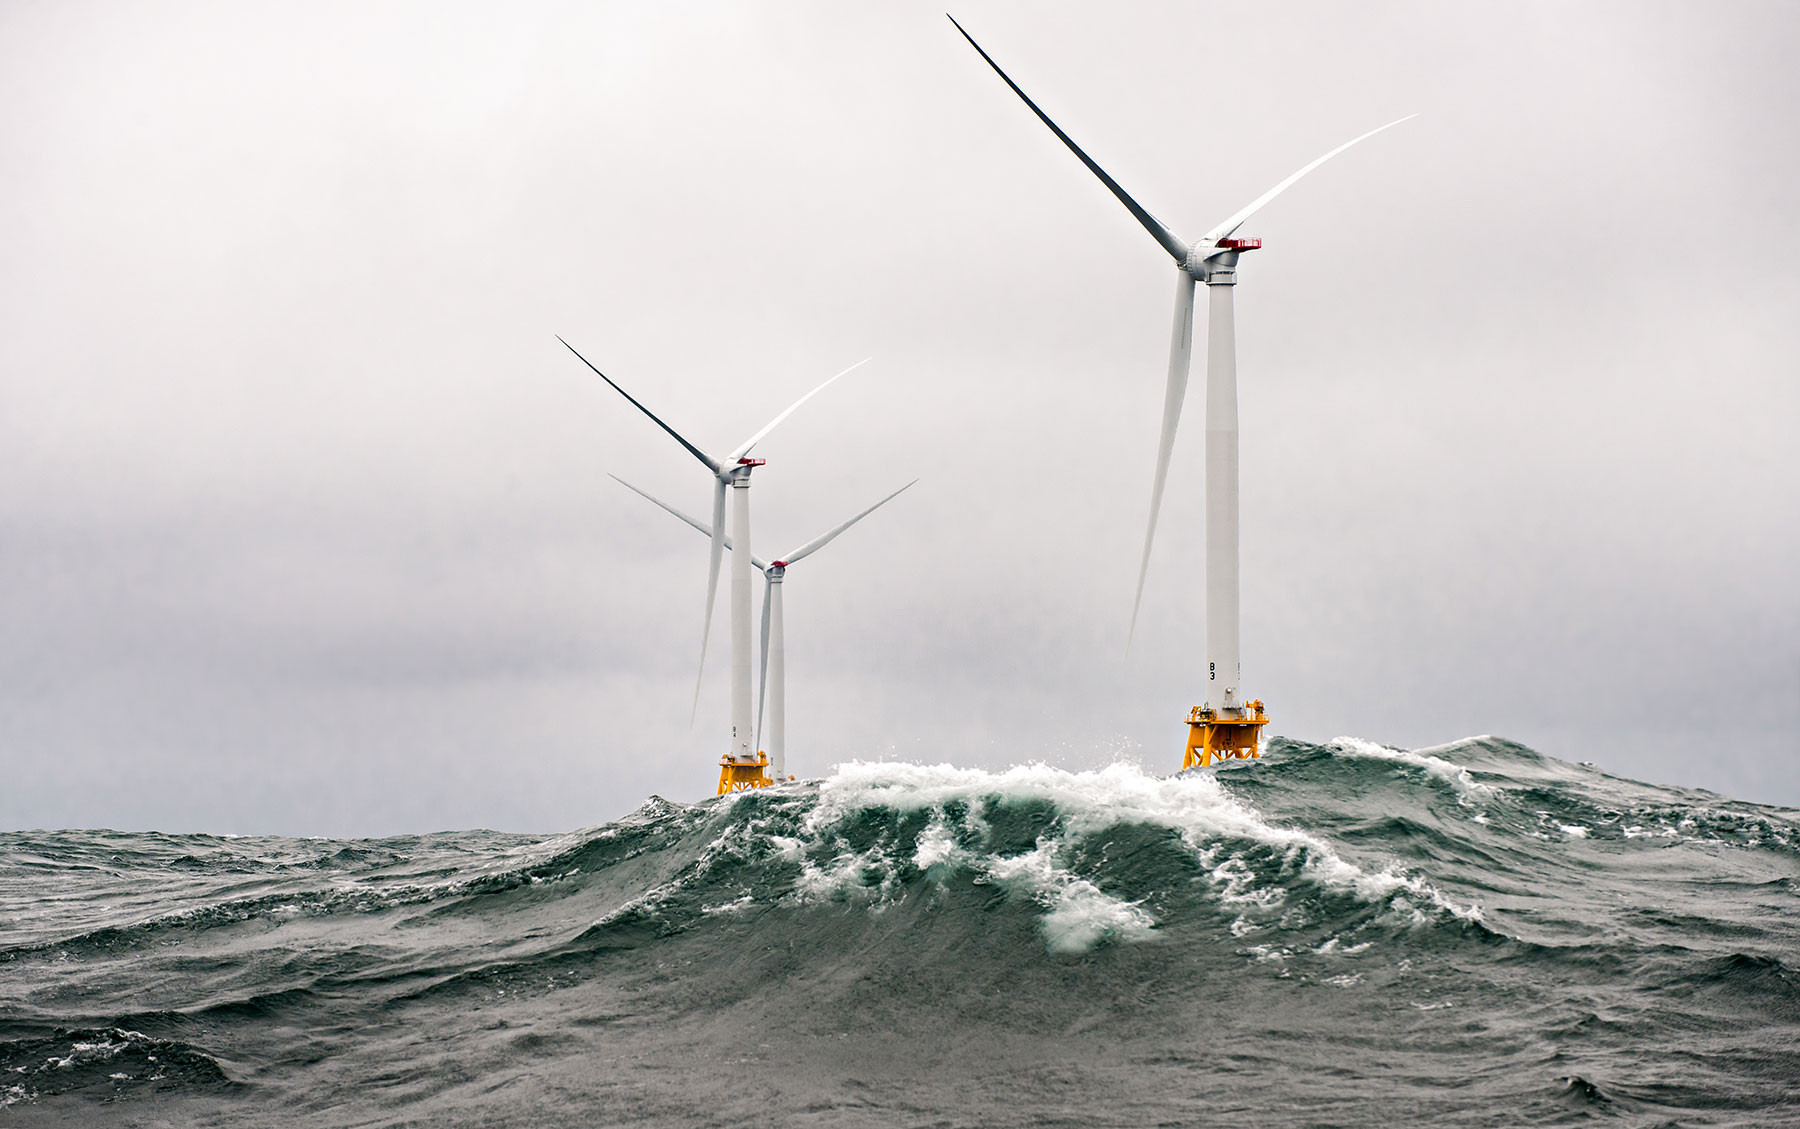
The technical challenges of developing and operating offshore wind projects are significant and more complex than land-based applications because the marine environment imposes new design and environmental constraints as well as physical access and logistic limitations. Among the added considerations are waves (sea and swell), currents, corrosive salt water, site remoteness, accessibility, the need for specialized vessels, and extreme weather events such as hurricanes and nor’easters. Additionally, offshore wind equipment tends to be much larger in physical size and generating capacity than land-based construction. Most offshore structures extend from the seafloor (or below) up through the entire water column and into the atmosphere to maximum blade tip heights approaching 300 m. Fixed-bottom foundations are generally used in water depths of up to 50–60 m; floating foundation designs, which are moored to the seabed, are becoming commercially viable and enabling wind energy deployments in much deeper water (IRENA, 2016; Ng and Ran, 2016; BOEM, 2021). Generating capacities of the largest commercial wind turbines have reached 15 MW (DOE, 2022).
It is important to understand the metocean forces confronting offshore wind energy projects in advance of their deployment (AMS, 2013; Bailey, 2016). Many characteristics of the metocean environment play key roles in project siting and structural design, energy production assessments, operations and maintenance, investment decisions, and financial risk. Figure 1 illustrates a number of these characteristics, encompassing the atmospheric, sea surface, and subsurface domains. Even after a project is commissioned, metocean conditions impact day-to-day operations. For example, they modify wind turbine output relative to ideal conditions due to variations in temperature, air density, turbulence, wind shear and veer (speed and direction), and precipitation. They also define the safety envelope for maintenance vessel and crew access.
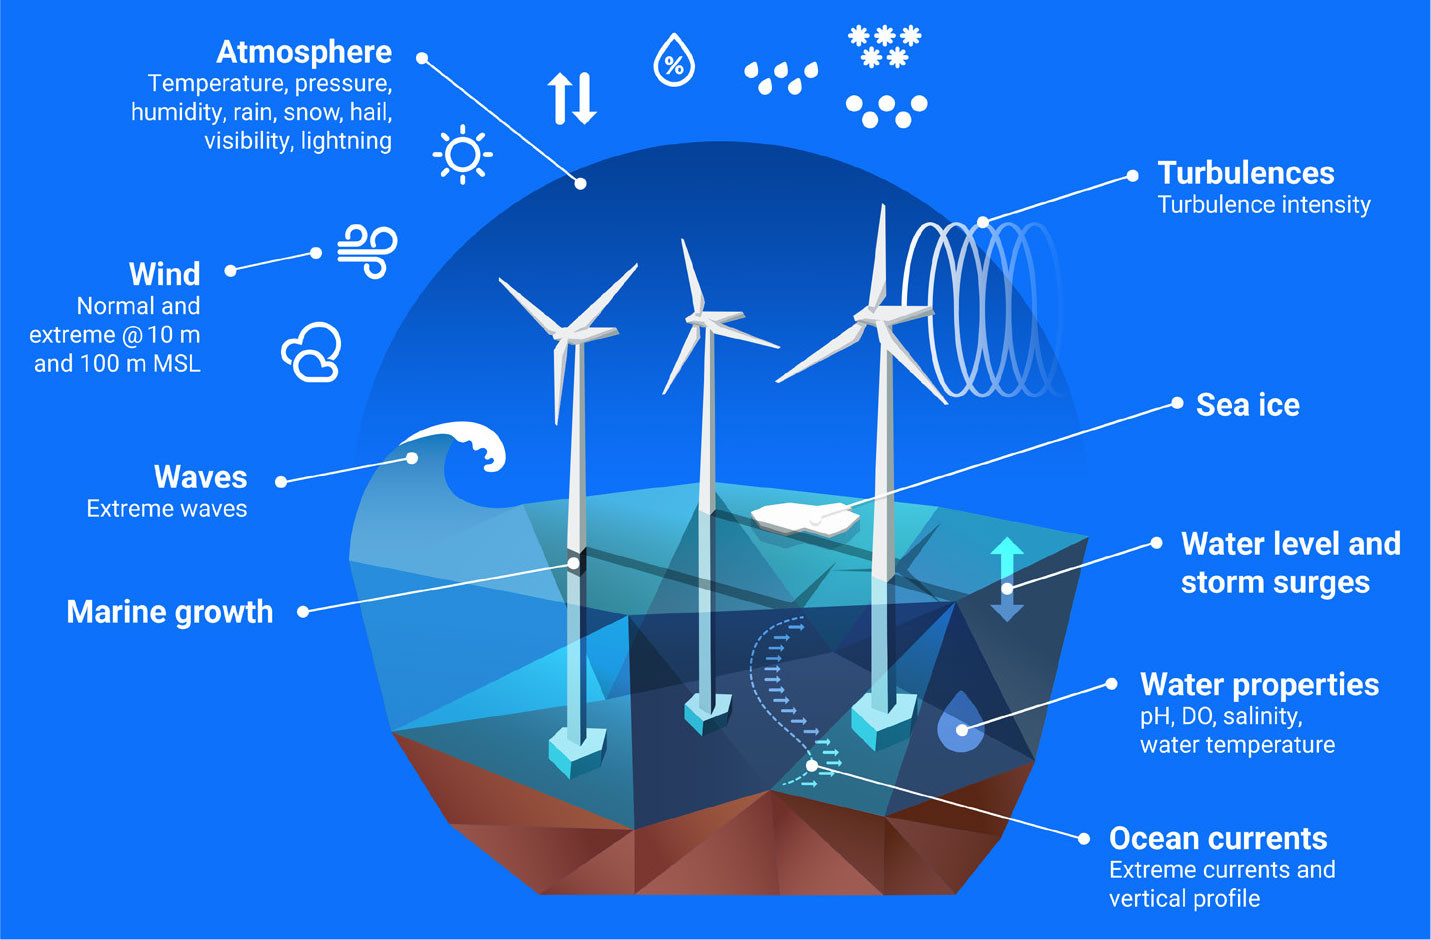
FIGURE 1. Some metocean parameters relevant to offshore wind energy projects are illustrated here. MSL = mean sea level. DO = dissolved oxygen. Courtesy of DHI (2021). > High res figure
|
Metocean data are derived from several sources. These include direct meteorological and oceanographic observations; derived values using satellite, radar, and other technologies; and modeling reanalysis products. Measurements obtained from other marine-related disciplines (such as the offshore oil and gas industry) and summary datasets (e.g., metadata) are also mined for relevance to offshore wind resource assessment studies. Metadata are important for properly interpreting and processing datasets and assessing their quality and applicability. Realistic representations of the metocean environment are crucial for accurately assessing the spectrum of load cases, including extreme events, that offshore wind structures are likely to encounter at a specific site of interest.
The following sections describe the relevance of key metocean parameters and analyses to the offshore wind energy field and the opportunities and challenges that may be encountered by related metocean initiatives, particularly in the United States where offshore wind is in the early stages of development. As of early 2024, there were four offshore wind projects under construction or in operation adjacent to the states of Massachusetts, New York, Rhode Island, and Virginia. Several more projects are slated for initiation within the same general region over the next five years, in addition to a few projects off the California coast. Further into the future, the southeastern United States, the Gulf Coast, and the Pacific Northwest are expected to host additional projects. We also address ways in which offshore wind-driven metocean initiatives can reap spin-off benefits to broader oceanographic interests.
RELEVANCE OF METOCEAN DATA ACROSS OFFSHORE WIND PROJECT PHASES
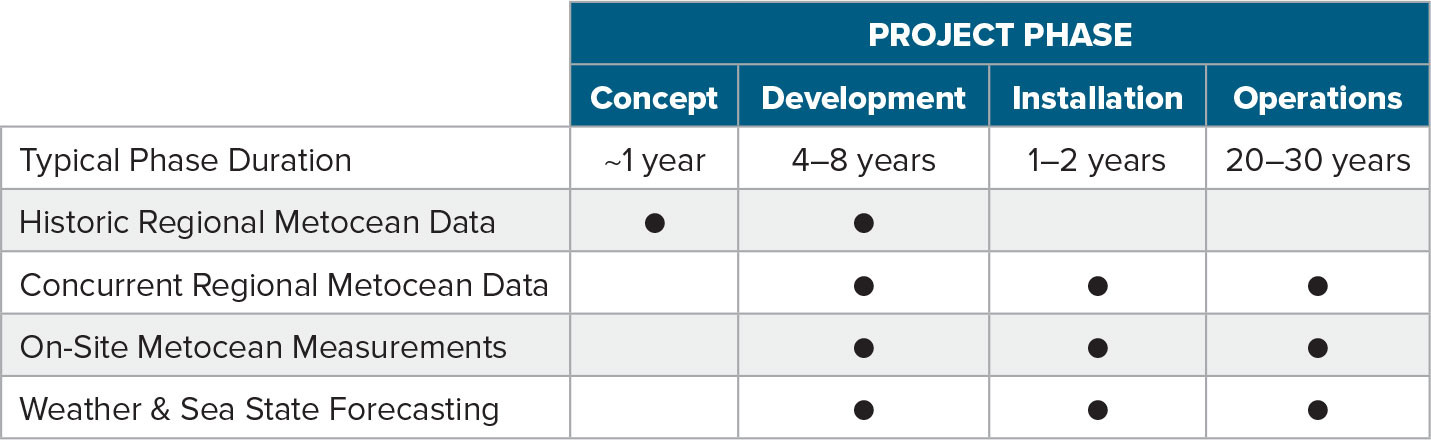
An offshore wind energy project undergoes multiple planning and execution phases spanning decades, with each phase reliant on metocean data. The general type of metocean data required depends on the particular phase, as shown in Table 1. This section describes how historic and newly measured metocean data are employed to help accomplish four phases of a project’s life cycle: concept, development, installation, and operations.
TABLE 1. Four phases of an offshore wind energy project’s life cycle, typical phase duration, and corresponding primary metocean information needs. > High res table
|
Concept Phase
The initial project phase is often a high-level exercise to determine whether a conceptual project has sufficient merit to proceed to more intensive assessment activities. Typical issues addressed in this phase include turbine layout and project sizing options within a potential project area; approximate gross and net energy production potential and returns on investment; turbine/foundation technology suitability and constructability; exposure to extreme risks such as hurricanes; and proximity to major ports and grid interconnection points. This phase relies heavily on historical metocean information (e.g., local/regional wind and wave records, model-based analysis products such as wind maps and related datasets) and environmental and demographic data (e.g., bathymetry and designated navigation lanes).
In the United States, the Department of Interior Bureau of Ocean Energy Management (BOEM) is responsible for identifying and leasing wind energy development areas on the outer continental shelf. As of mid-2023, BOEM had granted approximately 35 commercial leases for offshore wind development along the US eastern seaboard and the Pacific coast (BOEM, 2023). Publicly funded preliminary assessments of metocean conditions have been targeted for some lease areas (e.g., NREL, 2013; NYSERDA, 2017), while other metocean datasets are available for regionally representative locations off the East and West Coasts of the United States and in the Gulf of Mexico (Stewart et al., 2016).
Development Phase
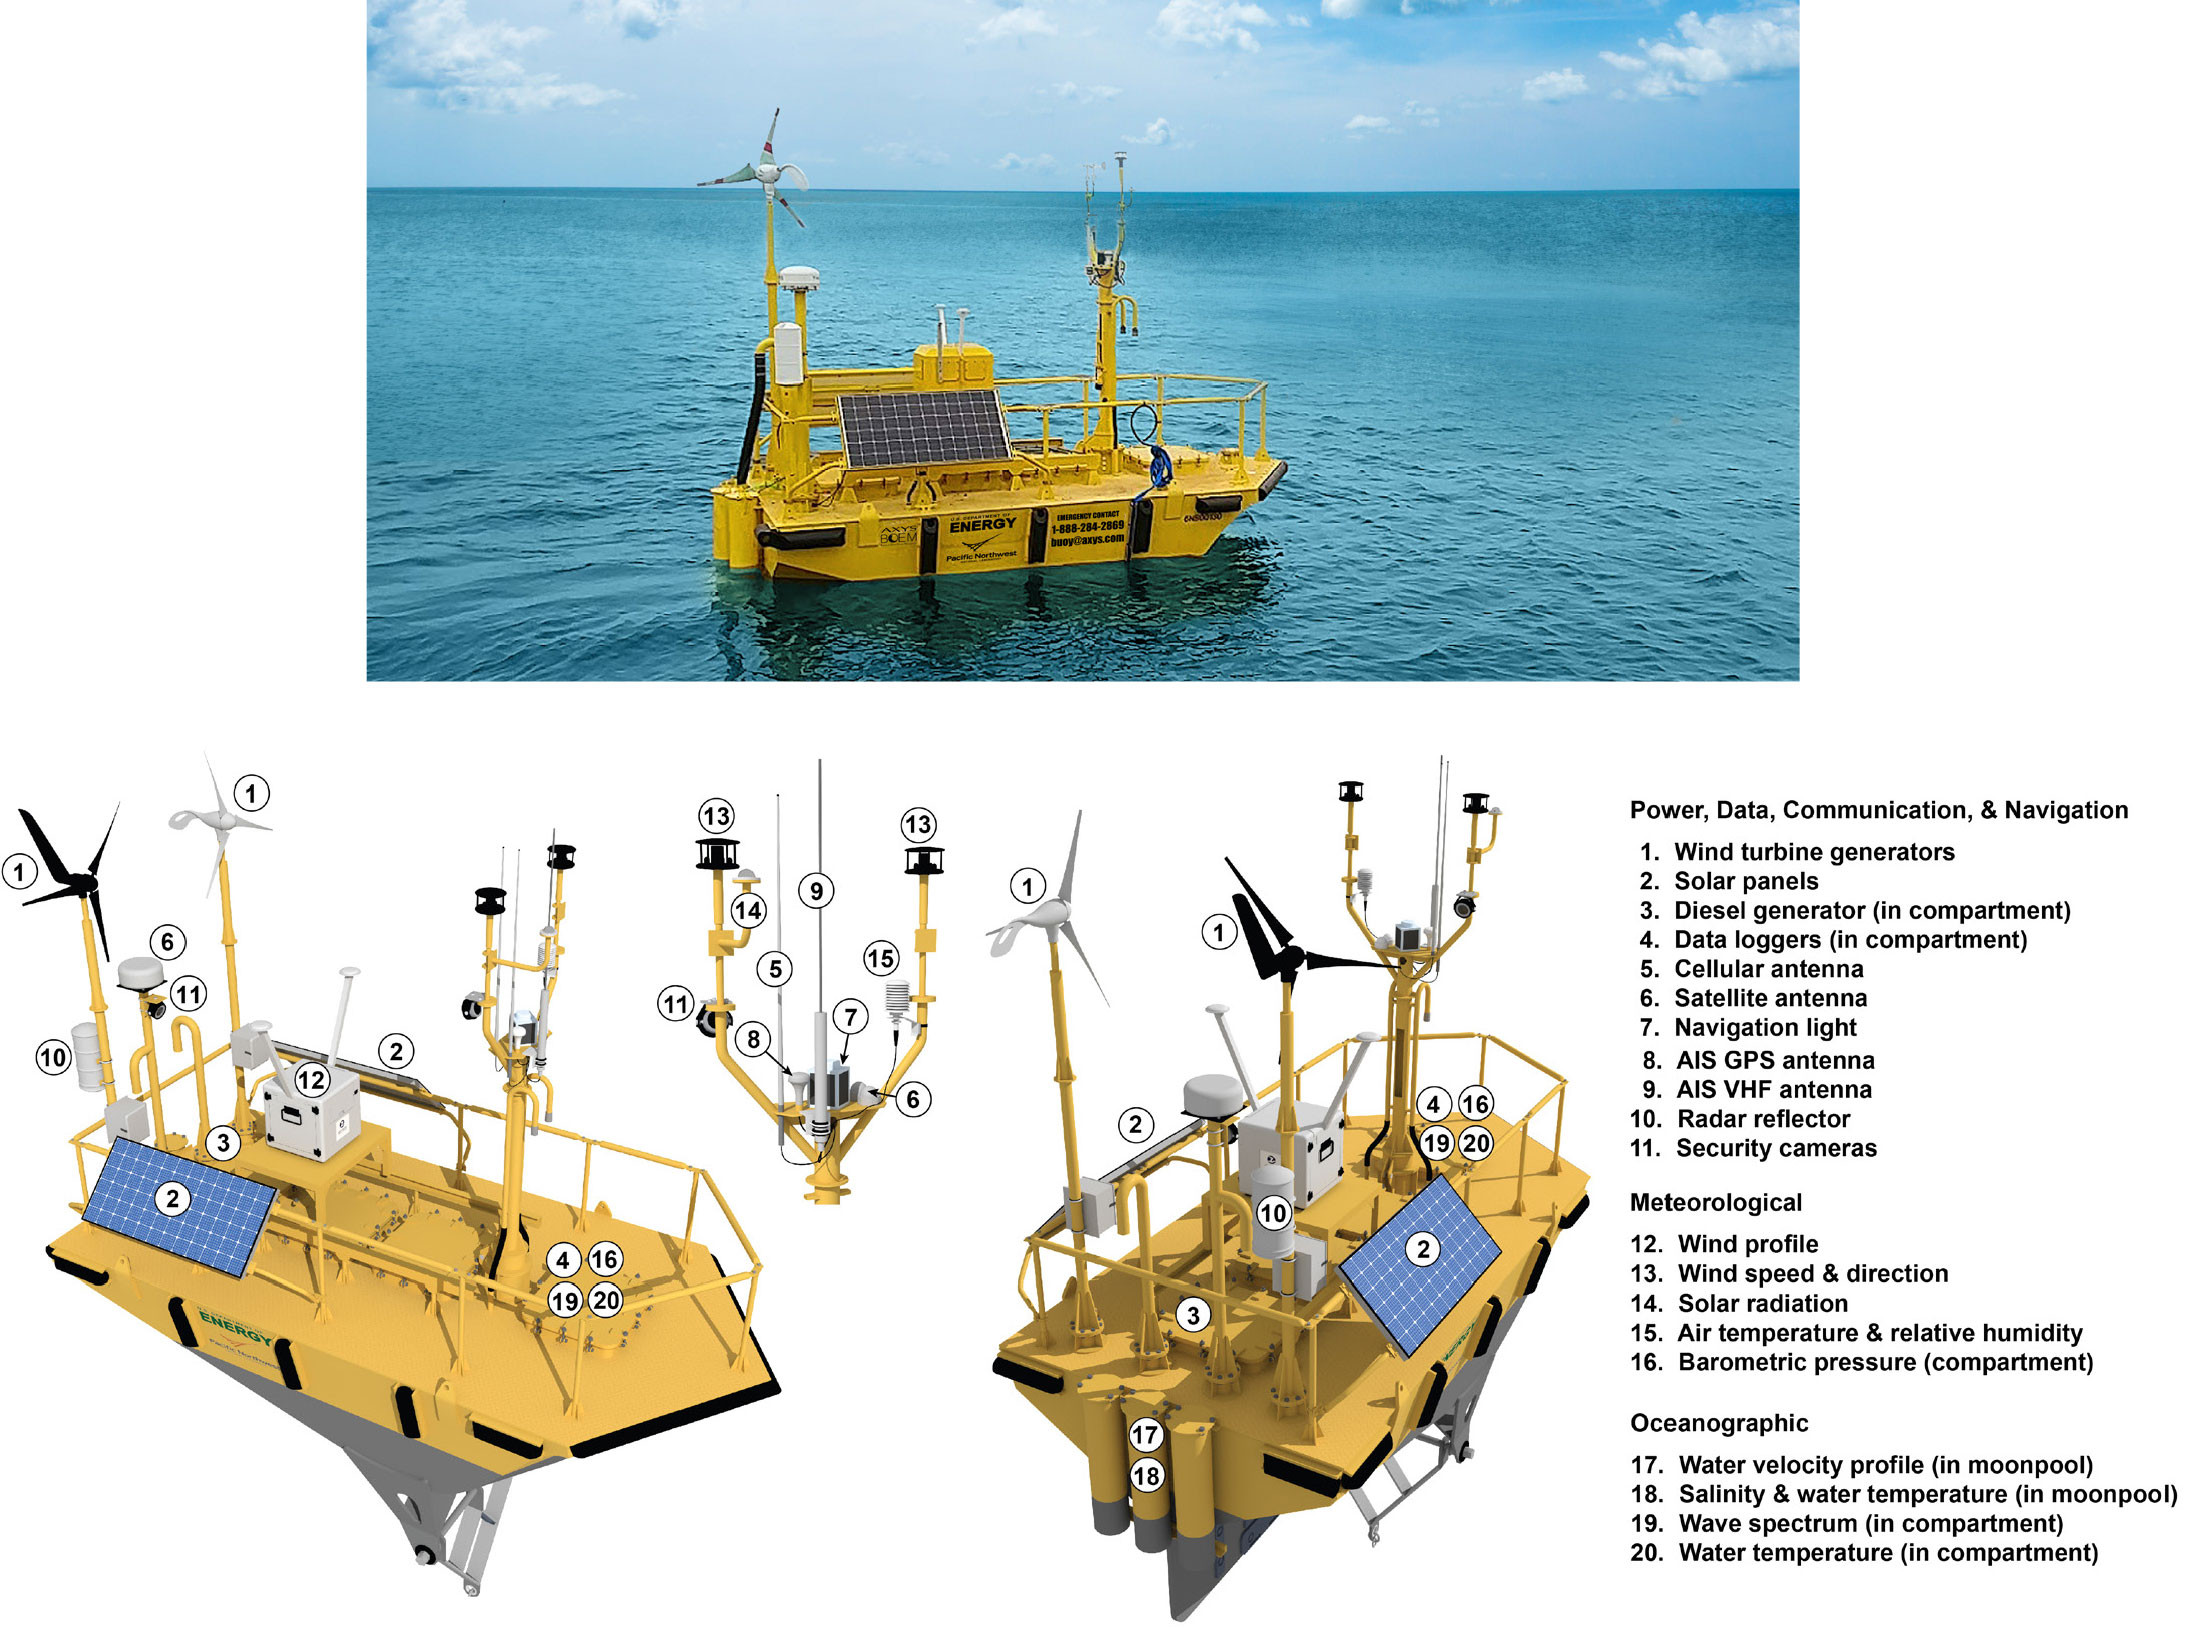
Once a lease has been granted by BOEM for a given area, a field measurement campaign is typically launched by the grantee to acquire the on-site metocean data necessary to address all the engineering specifications required to appropriately design, build, and operate the wind project. Metocean measurement campaigns have a minimum duration of one year and more commonly last for two or more years. Time-series measurements are taken from fixed (e.g., meteorological tower, acoustic Doppler current profiler) and/or floating platforms (e.g., wave/lidar buoy; see Figure 2) to assess atmospheric, sea surface, and water column conditions. Atmospheric parameters include wind speed/direction and air temperature at multiple heights as well as pressure, humidity, and precipitation. Sea surface parameters include wave conditions (height, frequency, direction), swell state, and water temperature. Subsurface parameters include pH and profiles of currents, temperature, and salinity.
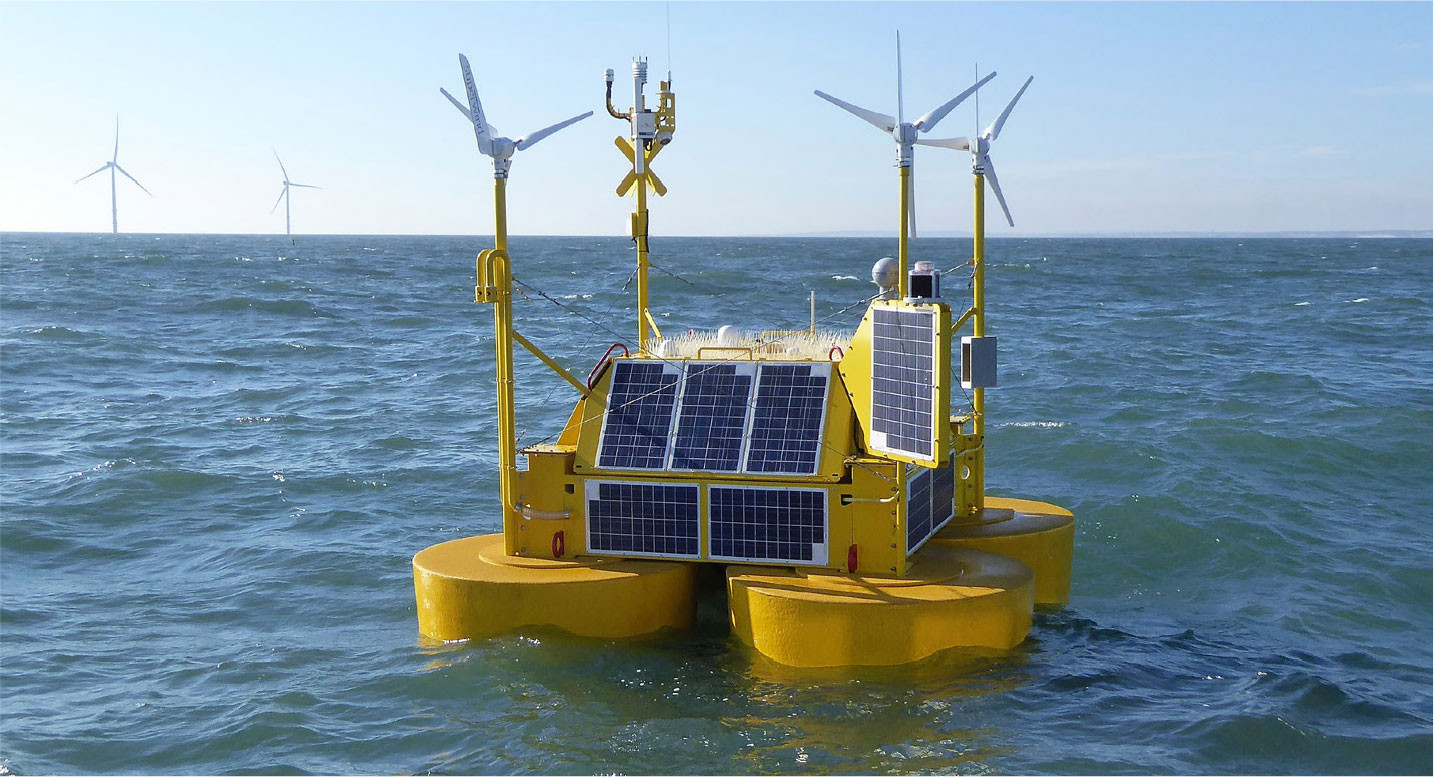
FIGURE 2. In 2019, the New York State Energy Research and Development Authority commissioned the deployment of two floating lidar buoys in the New York Bight. These buoy-based lidars provided nearly three years of physical metocean parameters to facilitate offshore wind development within the region. Parameters include multi-level wind speed and direction, wave, and current measurements, as well as other environmental and wildlife data. Courtesy of New York State Energy Research and Development Authority, https://oswbuoysny.resourcepanorama.dnvgl.com/overview. > High res figure
|
The measure-correlate-predict (MCP) technique (Brower, 2012; Carta et al., 2013), which relies on concurrent and historical data from regional measurement stations and assimilated datasets, is then used to temporally extrapolate the on-site observations into long-term means, frequency distributions, extreme values, distributed probabilities, and 50- and 100-year (or longer) return periods. This technique represents the past climate characteristics of the site and does not consider potential future trends affected by natural variability (longer climate cycles) or anthropogenically induced climate change. Because the time between a project’s development phase and the end of its design life is sufficiently long (i.e., decades), design considerations for offshore wind equipment must therefore consider the potential influences of climate change. These influences include sea level rise and changes in storm frequency/severity, sea/air temperature, and wind speed/direction distributions, among others. Guidance for potential climate change trends for a particular area can be obtained from regional climate models (e.g., JPL, 2024), which rely on reanalysis products and long-term surface and satellite observations, and from the literature (e.g., reports from the Intergovernmental Panel on Climate Change [https://www.ipcc.ch] or studies conducted by the academic and private sectors, such as Pryor et al., 2020, and Gernaat et al., 2021).
Estimation of annual energy production from a proposed wind project is determined by combining the specific operational characteristics of the project with the site’s environmental conditions; characterizations of the long-term, hub-height wind resource and other meteorological conditions (e.g., air density and turbulence intensity) are foremost in the estimation process. Gross energy production is predicted by applying the derived long-term meteorological statistics to the power and thrust curve specifications for a selected wind turbine model. Once the gross estimate is obtained, production losses due to several factors are subtracted to obtain the net energy production. Loss factors include: turbine and plant downtime; wake effects from adjacent turbines and (potentially) upwind regional projects; electrical component inefficiencies; suboptimal turbine performance (e.g., blade degradation); and operational curtailments due to transmission, wildlife, or high turbulence factors. Average total losses are on the order of 15%–25% (Lee and Fields, 2021). Finally, an uncertainty analysis derives probabilistic values for net annual energy production by considering factors such as potential resource measurement and extrapolation error, the interannual variability of the wind resource, and recent trends, including those attributable to climate change (Brower, 2012).
The engineering specifications for offshore wind project equipment and structures (e.g., turbines, blades, towers, foundations, substation, electrical cables) follow standards established by the International Electrotechnical Commission and the Det Norske Veritas group (e.g., IEC, 2019a, 2019b; DNV, 2021), among other organizations. These design standards ensure structural performance over a project’s design lifetime (minimum of 20 years) according to expected normal and extreme environmental conditions where the equipment will be sited. They cover the gamut of weather variables (e.g., wind, temperature, humidity, air density, lightning, hail) and ocean variables (e.g., waves, current, salinity, marine growth, seabed stability). They also consider the correlation of wind and waves, which influences loads on the support structure.
Metocean data requirements for engineering designs are met by a combination of site-specific measurements and analysis of, and correlation with, regional historic data sources. Reanalysis datasets are a popular source of historic (hindcast) data, given their high quality and global coverage. They consist of assimilated measurements of atmospheric and oceanic variables gathered from fixed surface stations, upper air soundings from twice-daily radiosonde launches, ships/airplanes, and satellites. Numerical weather prediction models fill in the time and space gaps to derive a consistent 3D-gridded data record reaching back in time for decades. ERA5 is one of the most advanced and accurate reanalysis products, providing hourly values beginning in 1940 at a horizontal resolution of ~32 km (Hersbach et al., 2020). Data values extend from Earth’s surface up through multiple (~137) layers of the atmosphere for such variables as wind, air, and sea surface temperature, pressure, precipitation, and ocean wave height.
As shown in Figure 3, offshore wind projects can choose from among a variety of bottom-fixed and floating foundation types, depending on the site’s bathymetry, seabed soil characteristics, and the wind/wave/current environment. Bottom-fixed types are generally chosen where water depths are less than 60 m. This is the case for currently planned projects off the US East Coast. Deployed in deeper waters, floating designs rely on mooring and anchoring systems. Wind projects using floating foundations may experience harsher wave/weather conditions and more challenging access than their bottom-fixed counterparts because, in many coastal regions, they are sited farther from shore.
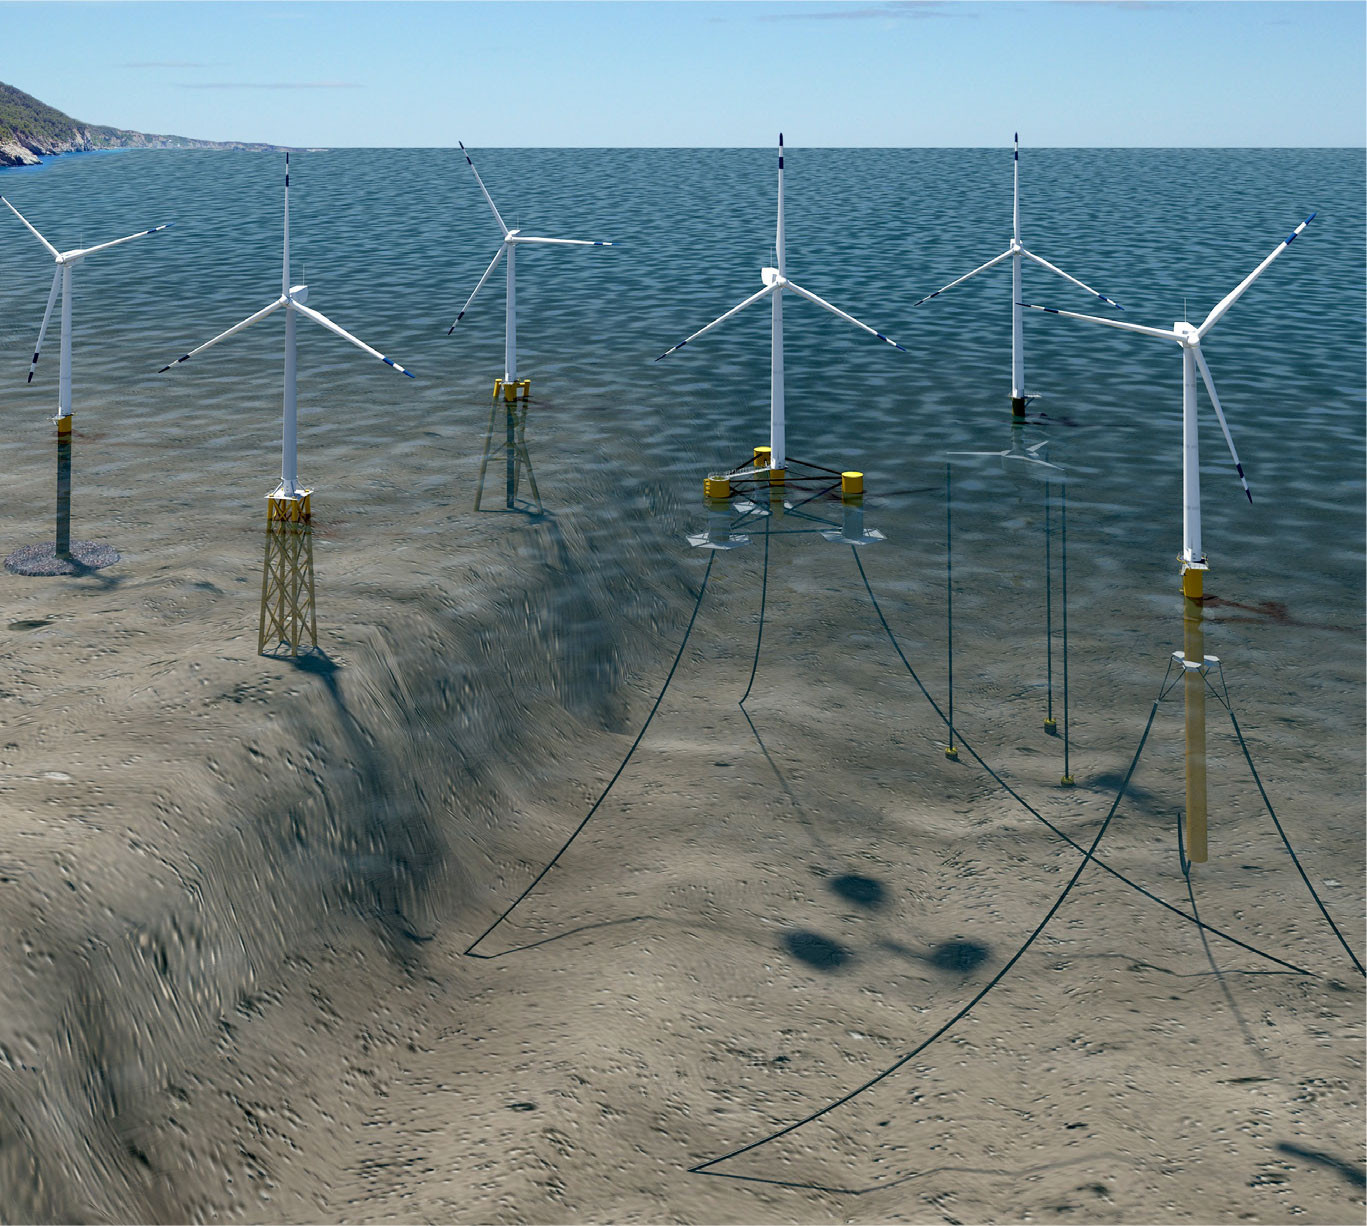
FIGURE 3. Offshore wind foundation types include, from left to right, monopile, jacket, twisted jacket, tension-leg floating platform, semi-submersible platform, and spar buoy. Illustration by Josh Bauer, National Renewable Energy Laboratory. > High res figure
|
Metocean conditions also impact the turbine selection process by guiding turbine control settings, equipment enhancements (such as extreme cold weather packages), and turbine warranty provisions. Another dimension of project design—the layout and spacing of the turbine array—is largely determined by the joint wind speed-direction frequency distribution. The design of the turbine array is a key factor in wake losses within a wind farm. Wider spacing between turbines generally leads to lower wake losses, but also reduces the number of turbines in a given area.
Detailed engineering design, equipment and materials procurement, and construction of a functioning project is typically performed by an engineering, procurement, and construction firm. Because it normally assumes risks for project schedule and budget, this type of firm accounts for the frequency and severity of challenging weather and sea state conditions when selecting appropriate construction-related vessels and lifting equipment as well as planning for associated logistics. This includes staging and scheduling transport from designated ports and on-site construction activities, which can be precluded for weeks or months at a time due to the frequency of strong winds, high seas, or the formation of surface ice (such as in the Great Lakes).
Metocean-related risk factors impact the equity and debt financing required to cover the project’s capital and operating costs while achieving the desired economic returns. Risk factors include probabilities of concurrent extreme wind and wave events (Buljac et al., 2022), lightning, icing, and significant deviation from the expected energy production over the course of the investment period. The relative probability of these risk factors varies by region. For example, major hurricane risk (categories 3–5) is greatest along the southern United States and Gulf of Mexico coasts, while maximum wave heights are generally experienced near the southern New England and Mid-Atlantic coasts, as well as near the northern Pacific coast. Insurance products, including their cost and availability, are likewise linked to the degree of metocean-related risk. Insurance products are intended to spread or mitigate risks related to performance, technology reliability, and safety.
Installation Phase
The installation phase involves one or more years of construction and transport work at sea and is constrained by limited periods of permissive sea states and suitable weather windows. Foreknowledge of the approximate frequency and duration of favorable sea and weather conditions enables accurate construction scheduling and cost management. During construction, much of the installation occurs during low-to-moderate wind speeds (<12 m s–1) and minimal significant wave heights (generally <1.5 m) (Tjaberings et al., 2022). Multi-day forecasting of offshore conditions, combined with on-site metocean observations, is critical during this phase. On-site measurements not only supply inputs to forecast models but also can validate and tune forecasts to reduce errors. Reliable forecasts help with contingency planning, recognizing that different operations have different weather sensitivities. For example, wind may have a greater effect on lifting operations than on subsea work. In mid- and northern-latitude regions prone to stormy weather during the cold season (late fall to early spring), construction activities may be suspended altogether, thus requiring a multi-year construction schedule.
Vessel selection and operation, including onboard lifting equipment, is dependent on such metocean factors as wave heights, wind speeds, water depth, and currents. Installation vessel types include cable laying vessels, jack-up barges/vessels that deploy legs into the seabed to lift the platform out of the water to provide improved stability for lifting operations, transport vessels, crane ships, accommodation vessels/platforms to house work crews, and purpose-built wind farm installation vessels. On-site metocean observations and operational wave and weather forecasts along the transit route from port are relied upon by vessel captains and construction managers during construction and commissioning. Accurate metocean forecasts can greatly reduce the capital-intensive construction and worker safety risk of an offshore project.
Worker safety is an integral part of construction, commissioning, and operations, and is best achieved when metocean conditions are continuously monitored and complemented by short-term weather forecasts. Adverse metocean conditions can impact health and safety issues both by increasing the probability of injuries and errors and by increasing response and recovery times. The effects of metocean conditions on personnel include not only seasickness, fatigue, and temperature extremes but also emergency response and casualty evacuation. In addition to cold temperatures, which can cause hypothermia, icy surfaces can prevent safe movement. Warm air temperatures can cause heat stress, whether because of working in hot enclosed spaces, such as turbine nacelles (enclosures), or climbing an access ladder while wearing a survival suit. Rain, hail, snow, and fog can all affect visibility, and lightning is a hazard to people exposed on structures. Construction activities need to be terminated or postponed whenever worker safety is jeopardized.
Operations Phase
Following project construction and commissioning, the operations phase relies on real-time, on-site, and regional metocean observations and forecasts of waves, weather, and energy production to monitor project performance and conduct maintenance, both scheduled and unscheduled. Over time, forecast accuracy can be optimized with the accumulation of on-site data for model validation and improvement. Maintenance activities span the spectrum of servicing and repairing wind turbines and electrical equipment, including inspection of subsea foundation components and mooring systems. Maintenance planning requires a forecast outlook of several days. As with construction crews, maintenance crews require safe weather windows not only when working on-site but also along the round-trip transit route to and from port. For most project areas in the United States, the transit distance will be several tens of kilometers and take hours to complete. Most of the same types of weather hazards of concern during construction also apply to maintenance operations. Vessels used to support maintenance activities include crew transfer vessels and multi-purpose vessels that have equipment transfer and lifting capabilities. Wave heights are a significant concern as most current service vessels have wave height restrictions of 1.5 m or less. This limits the number of days that maintenance crews can safely access a site.
Metocean data also play a role in the integration of electrical output into the regional transmission grid. Grid entities, including utilities and transmission system operators, routinely require forecasts (also referred to as schedules) of expected availability and production from offshore wind projects. The applicable time horizons include next-hour through next-day (or longer) periods, in hourly or finer increments. The same forecasting requirement applies to land-based wind projects and conventional power plants. Forecasts play a critical role in the unit commitment and economic dispatch decisions made by grid entities to ensure the reliability of electricity supply. Due to the inherent uncertainty in weather forecasting, production forecasts for wind projects are often expressed probabilistically.
Environmental Considerations
Although beyond the scope of this paper, we note that any proposed offshore wind facility under US jurisdiction undergoes an extensive environmental review process during the development phase. This necessitates additional measurement and monitoring capabilities beyond typical metocean observations. These include assessing potential impacts during the construction and operation phases on marine mammals (e.g., right whales), migratory and locally endemic species of birds and waterfowl, and commercial and recreational fisheries. They also involve extensive monitoring of the benthic, water column, air-sea interface, coastal and onshore habitat (for any land-falling transmission cables), and lower atmospheric boundary layer regions. Such reviews are comprehensive (e.g., for the South Fork Wind Farm, a 132 MW facility 60 km east of Montauk NY, the federal environmental impact statement is over 1,300 pages in length including appendices), and they can take several years to complete.
ADVANCEMENTS IN METOCEAN MEASUREMENTS AND IMPLICATIONS FOR OCEANOGRAPHY
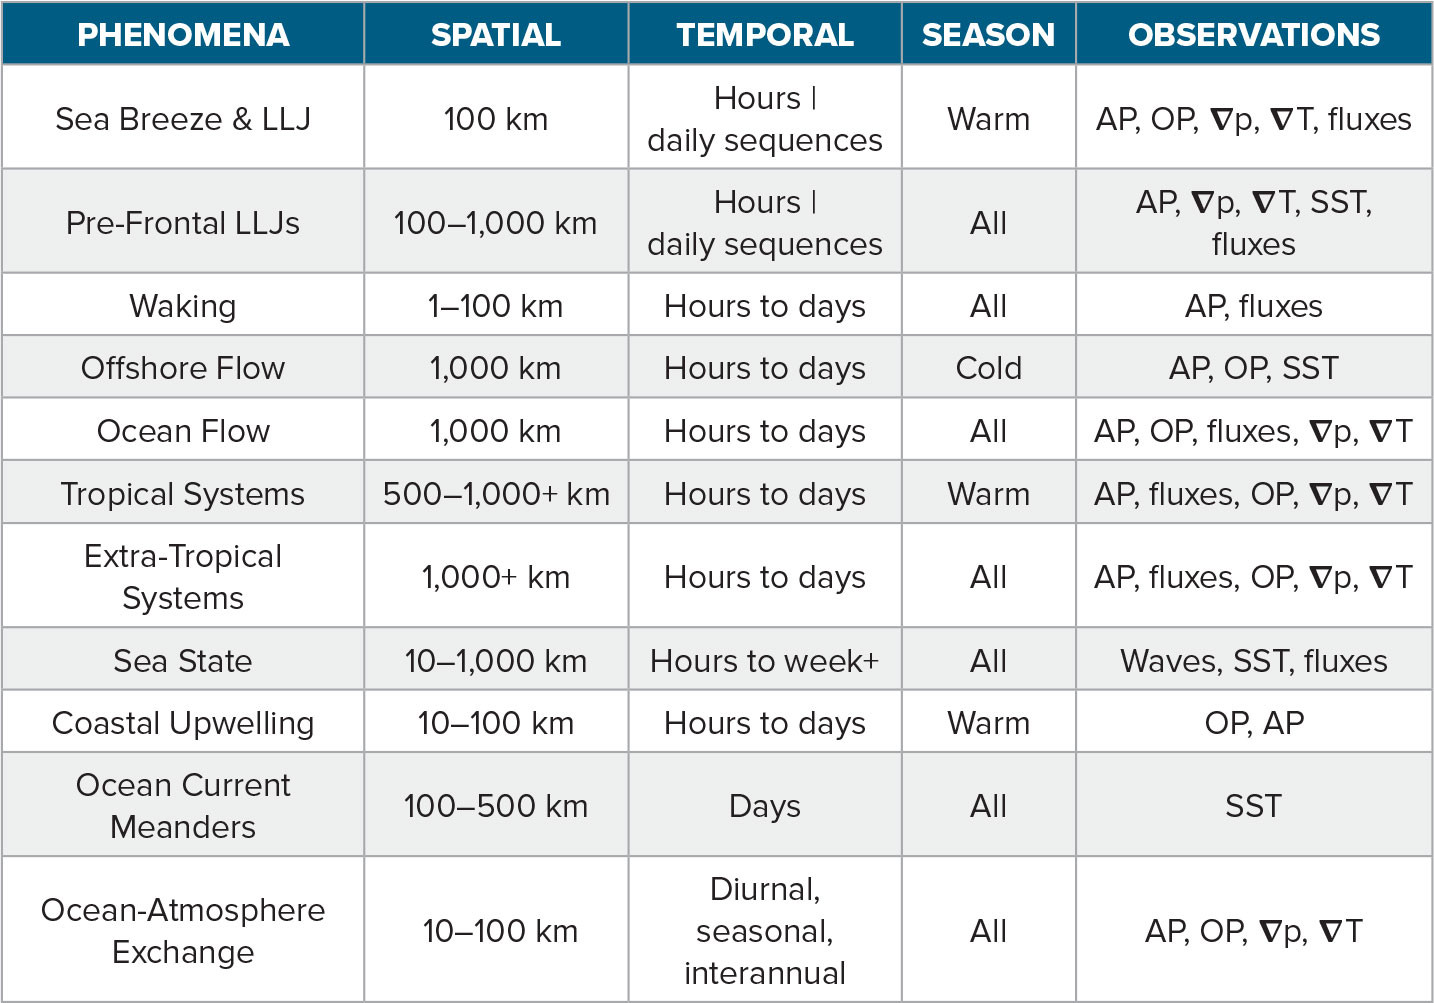
As shown in Table 2, a variety of metocean phenomena that affect offshore wind projects require better understanding from an observational and modeling perspective. Relevant data to accurately describe these phenomena support project engineering and operations and associated modeling exercises while also advancing research into basic and coupled atmospheric and oceanic processes. These phenomena range across multiple horizontal spatial scales (1–1,000+ km), and their timescales mostly vary from hours to days, although some have even longer life cycles (e.g., surface and subsurface currents). Some, such as low-level jets (local wind speed maxima in the lowest few hundred meters above the ocean surface) and coastal upwelling, favor the warm season (April–September) while, along the East Coast of the United States, for example, offshore wind flow (from land to sea) occurs predominantly during the cold season (October–March). Table 2 also lists the types of observations needed to characterize these phenomena. They include vertical profiles of selected characteristics of the ocean and atmosphere, horizontal gradients of pressure and temperature, and fluxes (or exchanges) of momentum, heat, and moisture at the air-water interface.
TABLE 2. Phenomena affecting the metocean environment and measurement needs. LLJ = low level jets. AP = atmospheric profiles. OP = oceanic profiles. Fluxes = fluxes of momentum, heat, and moisture. SST = sea surface temperature.  and and  refer to horizontal and vertical gradients of pressure and temperature. > High res table refer to horizontal and vertical gradients of pressure and temperature. > High res table
|
Beginning with a context of historical metocean information, this section next describes some measurement technology advancements that are now being used or are under development for offshore wind applications. They include buoy-based lidar systems, which are replacing fixed tall towers as the primary measurement platform for metocean monitoring; microwave radiometers to capture the temperature and humidity profiles of the atmosphere; radar to detect wake-induced atmospheric turbulence; and a flux measurement package to monitor air-sea interactions. All are intended to establish a firmer awareness of the metocean environment in tandem with the expansion of offshore wind energy.
Historical Context of Metocean Measurements for Offshore Wind Energy
The metocean environment presents daunting challenges for making dependable, long-term, and continuous measurements. Not surprisingly, there are few such long-term observations available, essentially confined to historical buoy-based near-surface (0–5 m) heights for standard meteorological variables such as wind speed and direction, temperature (sea surface and ambient air), atmospheric pressure, and wave characteristics (e.g., significant height, period, direction, type). For the US coastal and offshore (including continental shelf) waters, long-term observations are predominantly acquired from 3 m discus buoys under the purview of the National Data Buoy Center (NDBC) with support from the US Coast Guard. A few Coastal-Marine Automated Network stations located in nearshore waters have wind measurement heights well above the surface (~25 m), with the ROAM4 lighthouse in Lake Superior featuring wind measurements at 46.9 m above site elevation. However, these heights are not representative of the much greater hub height and rotor span of modern wind turbines, and for some weather phenomena, wind conditions can vary significantly across this span. For example, low-level jets are a common warm season occurrence usually associated with the sea breeze circulation in the New York Bight (among other locales). As illustrated in Figure 4, they can produce significant speed shear across the rotor plane (spanning from 40 m to 260 m above the surface) but may also result in favorably high gross capacity factors (>80%) during periods of high electricity demand (McCabe and Freedman, 2023).
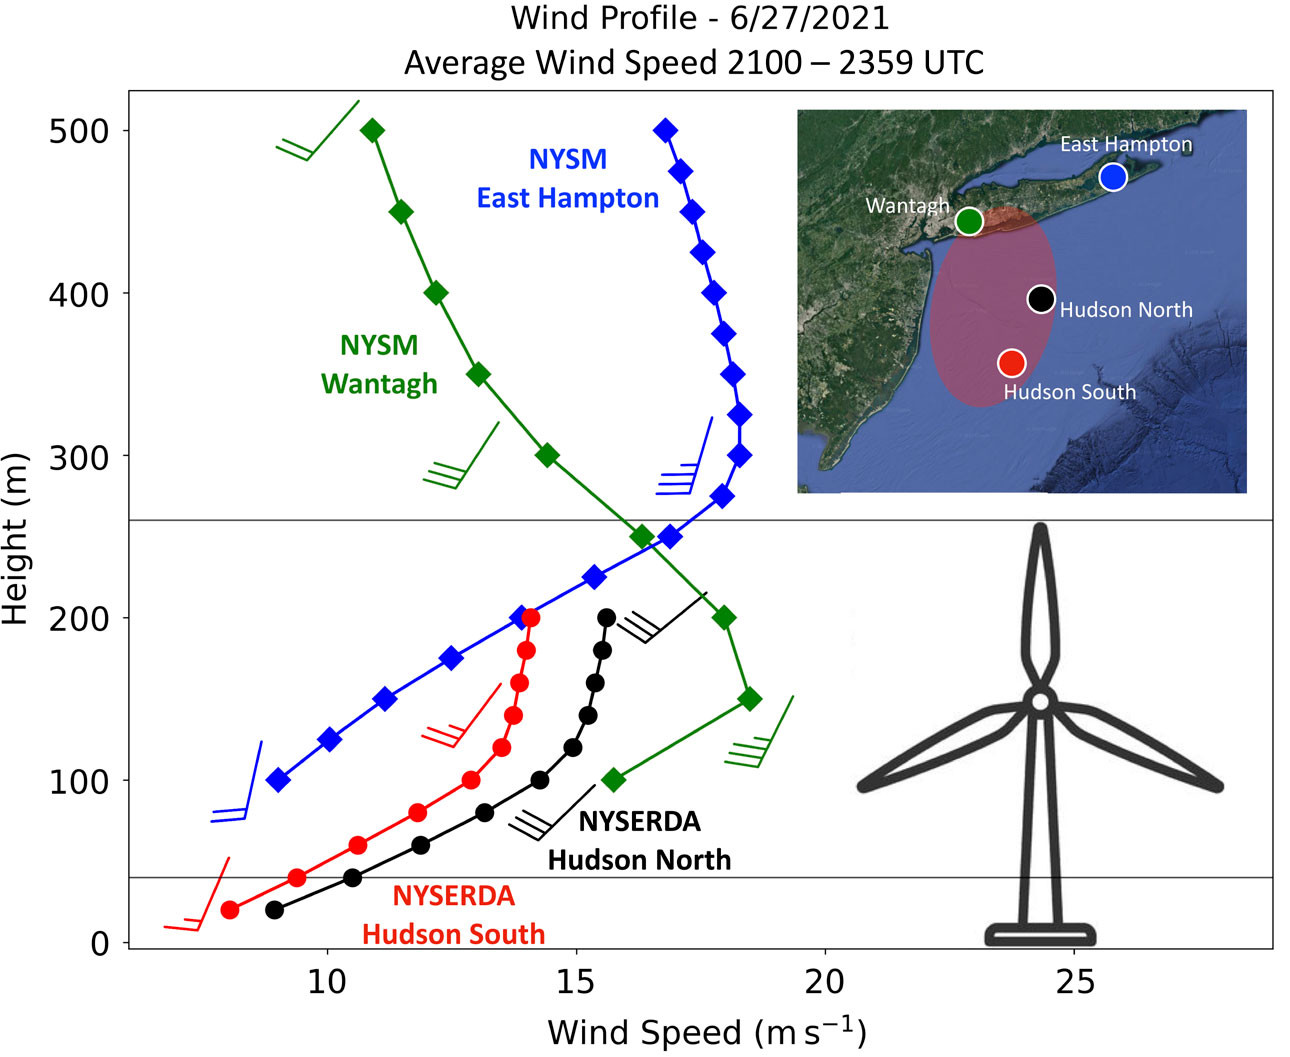
FIGURE 4. Wind profiles using lidar data from land-based New York State Mesonet (NYSM) and offshore New York State Energy Research and Development Authority (NYSERDA) sites on June 27, 2021, averaged over a three-hour afternoon period. (The offshore lidar platform is shown in Figure 2.) Horizontal lines at 40 m and 260 m indicate the approximate location of the rotor plane of an offshore wind turbine. The map at upper right depicts the location of each site and the approximate area of the New York Bight low-level jet (shaded in red). From McCabe and Freedman (2023). > High res figure
|
Since the late 1980s, weather satellites have provided valuable information about the ocean’s near-surface winds. They commonly use sensors to detect the amount of microwave radiation emitted or reflected by small wavelets at the ocean surface, which are primarily created by surface winds. Using weather buoys as a standard of comparison, methods have been developed to relate microwave observations to wind conditions. While satellite-derived wind data are useful in defining ocean wind magnitudes and patterns, for several reasons, they are of limited value for wind energy applications. First, as with buoy-based measurements, much uncertainty is introduced when extrapolating near-surface wind speeds to wind turbine hub height. Second, the spatial resolution from scatterometer-type satellite sensors is approximately 25 km, which limits the ability to resolve winds within this distance of a coast or island due to the corrupting influence of land. Third, although higher resolution (~25 m) imagery is available from polar-orbiting satellites using synthetic aperture radar, the field of view is much narrower, and coverage of a given area occurs less frequently.
A few long-term offshore fixed towers have been deployed in support of basic research and wind energy applications. One example is the Woods Hole Oceanographic Institution’s Martha’s Vineyard Coastal Observatory Air-Sea Interaction Tower (ASIT; see https://mvco.whoi.edu/about). Installed in 2002, ASIT is located 3 km south of Martha’s Vineyard at a 17 m water depth with a measurement tower extending 23 m above sea level. The facility continuously monitors a suite of atmospheric and oceanic parameters and was the first to implement high frequency radar sensing of ocean surface currents from a fixed metal offshore structure (Kirincich, 2020). Another example is the set of three Forschungsplattformen in Nord- und Ostsee (FINO) towers, installed between 2003 and 2009, that have been operating in the North and Baltic Seas (see https://www.fino-offshore.de). Each tower has multiple levels of wind, temperature, and other atmospheric measurements up to 105 m above sea level, plus subsurface profiles of current, dissolved oxygen, salinity, and water temperature. Both the ASIT and FINO towers provide high quality, multi-year reference metocean data for their respective regions.
Prior to initiating on-site data collection, historical measurements of wave characteristics and ocean currents provide important guidance when siting and designing offshore wind projects. NDBC historical archives for coastal and offshore stations include calculated significant wave heights (defined as approximately equal to the average of the highest one-third of the waves during a 20-minute sampling period every hour), the average wave period (in seconds) of all waves during the 20-minute period, and, for some buoys, the direction from which the waves travel at the dominant period. NDBC-reported wave measurements are not directly measured by sensors on the buoys. Instead, onboard accelerometers or inclinometers measure the heave acceleration or the vertical displacement of the buoy hull during the wave acquisition period. Satellite-derived wave data are also available, but as mentioned previously, the relatively coarse spatial resolution can lead to compromised values in the vicinity of land.
A widely used source of ocean surface current speed and direction in North America is the Integrated Ocean Observing System, which manages a network of high frequency radar systems in the United States, Canada, Mexico, and Puerto Rico (https://hfradar.ioos.us). These coastal-based systems continuously measure large regions of the ocean with a range from a few kilometers to over 200 km (at low frequencies—4–5 MHz—these systems can “see” over the horizon). The range resolution depends on the transmission frequencies used, but resolutions below a kilometer are possible at higher frequencies (e.g., 45 MHz). Subsurface current profile data for offshore wind-related assessment studies are scarce by comparison. Past observational studies to determine subsurface and bottom currents offer useful insights for planned offshore wind projects in the same vicinity. For example, oceanographic observations were made by the US Geological Survey in the Hudson Shelf Valley, offshore of New York, as part of a program to investigate the transport and fate of sediment and associated contaminants in the coastal waters offshore of the New York/New Jersey metropolitan region (Butman et al., 2003; Gong et al., 2010). Acoustic Doppler current profilers were deployed at several sites as part of this field study. Similar types of current profilers are now often used in conjunction with buoys as part of wind energy resource monitoring campaigns, as they provide critical information regarding the potential for scouring around sea floor-based wind turbine foundations and anchorages.
Buoy-Based Lidar and Metocean Measurement Systems
Lidar technology is increasingly used by the wind energy industry as a wind measurement tool to complement or replace measurements from fixed towers. In the offshore arena, lidar mounted on floating buoy-based systems, which apply motion correction algorithms to wind data in real time, has recently become popular with project developers. Floating lidars have a cost advantage compared to tall, fixed towers and can sample winds to heights well above standard tower heights. As is the case at the ASIT facility, lidar paired with a relatively short, fixed tower platform offers a combination of benefits to support a robust research program.
Lidar operates by emitting a laser light signal (either as pulses or a continuous wave) that is partially backscattered in the direction of the emitter by suspended aerosol particles. The light scattered from these particles is shifted in frequency in proportion to their speed (and the speed of the wind). Following the Doppler effect, this frequency shift is used to derive the radial wind speed along the laser path. Fortunately, the ocean environment typically has a sufficient concentration of aerosols to provide near optimum conditions for lidar data acquisition. Specific guidelines for offshore lidar use were recently adopted by the International Energy Agency (Bischoff et al., 2017).
Three distinct types of lidar are currently employed in offshore wind energy. Profiling lidars measure the wind along one dimension, usually vertically, analogous to measurements taken from a tower. These lidars typically measure wind speeds from 20 m to 300 m above the device and can be mounted on the ground (for coastal deployment), on a fixed offshore platform, or on a floating offshore platform. Three-dimensional scanning lidars have the capacity to rotate the laser beam about two axes, which allows the device to measure wind speed at nearly any point within a hemispherical volume. This scanning technology is typically designed to obtain an array of wind speeds over a large area and can provide a vertical profile of the lower atmosphere (up to ~3 km). Scanning lidars tend to be heavier and require more power, but coastal sites can support wind assessment and siting campaigns, given their horizontal scanning ranges (12 km or more). Larger ocean-based platforms (e.g., barges) can support such systems, and near future developments should enable buoy-based scanning lidar to be deployed. Nacelle-mounted lidars are systems specially designed to support the measurement of inflow and outflow conditions from atop a wind turbine.
Buoy-based lidar systems are often leased by offshore project developers from commercial entities who install and maintain the systems. The US Department of Energy (DOE) Pacific Northwest National Laboratory (PNNL) maintains several of these buoy-based lidar platforms for research and qualitative resource assessment purposes (see Figure 5). PNNL has deployed these systems along the US East, West, and Gulf Coasts and in Hawai‘i in support of BOEM offshore wind activities. PNNL uses these data to “validate wind models, improve the understanding of air-sea interactions, and reduce uncertainty and risk in characterizing offshore wind resources” (PNNL, 2020). Data are available through PNNL’s data archive and portal (https://a2e.energy.gov/about/dap).
Microwave Radiometry
Although metocean measurements in the context of offshore wind energy have embraced remote sensing technologies, there is a need for continuous monitoring of the thermodynamic (i.e., temperature and moisture) profile of the atmosphere. Offshore wind developers and operators now recognize the need for these measurements, which provide critical information on atmospheric stability and temperature and moisture conditions within and above the turbine rotor plane. The most common and commercially available instrument for such measurements is the microwave radiometer, a passive instrument that measures downwelling microwave radiation to estimate vertical profiles of temperature, humidity, and liquid at varying vertical resolution (50–250 m) up to 10 km heights. Microwave radiometers have been deployed in the field for decades at a variety of locations. Although they currently lack the ability to accurately depict fine-scale gradients of temperature and humidity (e.g., see Bianco et al., 2017), improvements in measurement technology and post-processing applications (e.g., machine learning and neural network algorithms) demonstrate that these instruments will eventually be deployed on offshore platforms for wind energy applications.
Radar
Doppler radar technology has been used to study turbine wake effects (Hirth et al., 2012), to improve model parameterizations of atmospheric turbulence (Marjanovic et al., 2017), and to propose improved turbine control technologies that reduce the long-term cost of energy (D’Amato et al., 2023). Land-based deployments typically involve mobile platforms using Doppler radar technologies (e.g., the Ka-band [35 GHz] Doppler radar systems operated by Texas Tech University; Weiss et al., 2009). The use of radar for offshore applications, however, is limited by the difficulty in deploying such systems in coastal and offshore sites (e.g., system weight, expense, power requirements, and need for onsite personnel). Recent studies have used onshore-sited radars scanning nearby offshore wind farms (e.g., Valldecabres et al., 2020). However, radar technology has the potential for providing detail in the study of intra- and inter-farm wake effect characteristics such as wake meandering, turbulence, and flow properties of the atmosphere.
Fluxes (Surface-Atmosphere Exchange)
Technological advances are opening new ways to observe the atmosphere and improve wind energy resource assessment and operational forecasting models. As noted above, commercially available floating lidars can now resolve wind profiles at heights approaching 300 m, sufficient to capture the entire rotor planes of the next generation of offshore wind turbines. Moreover, the fidelity of continuous 15–30-minute averaged eddy covariance (EC) air-sea momentum and buoyancy flux measurements from moored platforms has been demonstrated (e.g., Weller et al., 2012). To date, however, there is no operational (or commercial) system that integrates buoy-based lidar and EC air-sea flux capabilities into a single package. Combining these two approaches will allow the continuous characterization of atmospheric surface fluxes, turbulence, and wind profiles in situ that can be used to evaluate and refine wind resource assessment and short-term to medium-range forecast models.
Working with the DOE’s Wind Energy Technologies Office, the Atmospheric Sciences Research Center (ASRC) at the University at Albany (State University of New York) has designed and built an automated EC flux measurement package for integration with a buoy-based lidar system under a contract with PNNL. The resulting buoy-based “flux-lidar” package provides a new tool for air-sea interaction research that can be used to evaluate and improve wind resource forecast model performance, resulting in better forecasting of smaller scale weather features such as low-level jets and local stability. ASRC deployed the instrument on a PNNL buoy in early 2024 (see Figure 6) as part of the 3rd Wind Forecast Improvement Project (see https://www.pnnl.gov/projects/wind-forecast-improvement-project-3). In addi-tion to momentum and buoyancy fluxes, the EC flux measurement package directly measures water vapor (i.e., latent heat) flux. The fluxes are computed in real time aboard the buoy and transmitted to shore to enable rapid evaluation of forecast models and air-sea exchange parameterizations. The system primarily employs commercially available sensors and components, facilitating broader use of the buoy-based measurement package by the public and private sectors for both research and commercial applications, particularly in the rapidly growing US offshore wind market.
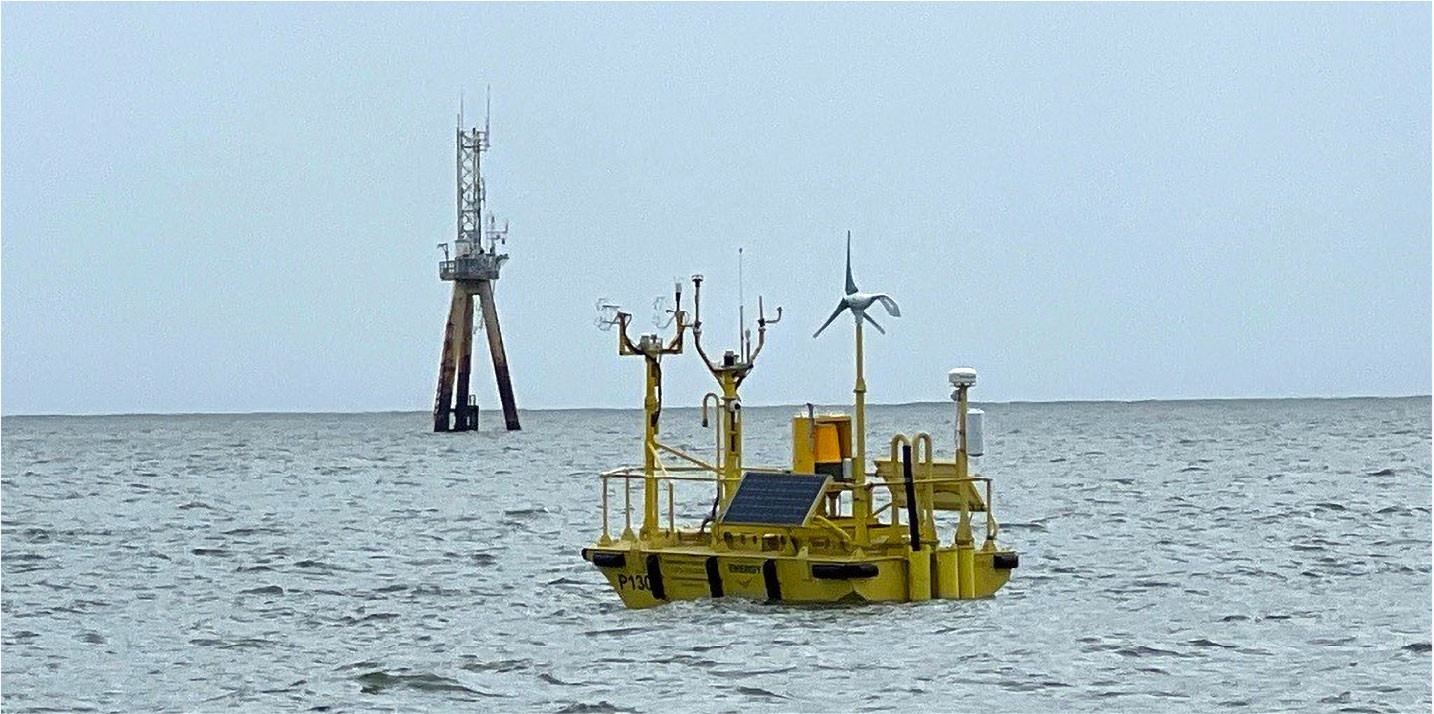
FIGURE 6. The Pacific Northwest National Laboratory lidar buoy newly equipped with a flux measurement package is shown deployed in the vicinity of the Air-Sea Interaction Tower (ASIT) near Martha’s Vineyard. Package measurements include fluxes of moisture, momentum, and buoyancy. Photo courtesy of Pacific Northwest National Laboratory. > High res figure
|
Implications for Oceanography
The expansion of offshore wind energy in the US and abroad has direct and indirect benefits to the field of oceanography in terms of greater field and modeling activity, and interdisciplinary collaboration. These benefits are derived in part from the growth of renewable energy sources and their migration into the energetic marine environment by a unique community of interests: energy companies, manufacturers, marine engineers, policymakers, regulators, financial institutions, and researchers/academia, among others. This community has a common stake in the success of offshore wind energy and recognizes the importance of investing in appropriate metocean measurement and assessment efforts. It also supports the development of best practices and taking advantage of lessons learned from pioneering projects. Without the contributions of the oceanographic disciplines, this community would not succeed.
New measurement and assessment activities, typically multi-year in duration, enrich the overall body of knowledge about the metocean environment. Routine observations of winds, waves, currents, and other metocean variables are taken continuously for the life of projects to support operations. The degree to which metocean data are publicly available will depend on the policies of individual project operators and may require special permission for use of data for research purposes. Many project developers already are actively collaborating with the academic community to conduct pre-construction metocean assessments, and to develop tailored workforce training programs as well.
Offshore wind development is stimulating innovations in metocean measurement and platform technologies, as described earlier, and enabling more measurement applications. Because the US expansion of offshore wind energy is expected to increase by at least an order of magnitude by the end of this decade, the climate will be conducive to more innovation, especially as project development also expands geographically. Some innovation will be a natural outcome of scientific collaboration with “adjacent” disciplines such as atmospheric sciences, marine engineering, instrumentation, and artificial intelligence.
Oceanographic modeling efforts will benefit from the addition of observational and validation data as well as from greater attention to air-sea coupled processes. Advancements in atmospheric modeling over the ocean rely on these same processes and on more geographically extensive characterizations of parameters like sea surface temperature, waves, and stability. The substantial subsurface infrastructure (foundations, moorings, electrical/communication cables) associated with offshore wind projects will demand ongoing current, scouring, and biological growth surveillance. Accurate short-term marine forecasts will be increasingly necessary to support project construction and operations, including vessel transits and personnel safety.
In the future, the presence of more and more arrays of wind structures in the ocean will raise questions about their physical and biological impacts on the local and surrounding metocean environments. Together with the different phases of an offshore wind project, this reality makes clear that the oceanographic community will always play a vital role in this industry.
CONCLUSIONS
Metocean considerations for offshore wind energy purposes are multidisciplinary and relevant to a diverse array of stakeholders over the course of a wind project’s lifetime. These considerations span the physical aspects of the atmosphere, ocean, and seabed and have implications for public policy and safety, energy, and financing. Recognizing the importance of characterizing metocean conditions for offshore wind development in the United States, BOEM commissioned a set of recommended practices (BOEM, 2018). Metocean guidance for other offshore energy sectors is also available. For example, the American Petroleum Institute offers guidance on the use of metocean data to assist in the design and operation of offshore oil and gas industry-related structures of various types (API, 2019). The International Organization for Standardization offers similar metocean guidance for the evaluation of offshore structures (ISO, 2014, 2016).
Heightened activity in offshore wind development is expanding the measurement and understanding of metocean conditions in coastal areas around the world. A deepening knowledge of the metocean environment is likely to yield benefits to a community of marine interests beyond offshore wind energy interests. This community includes other types of marine renewable energy (or hydrokinetic) systems that tap the waves, tides, currents, or ocean thermal profiles to extract and convert energy into electricity (Institute of Marine Engineering, Science, and Technology, 2018). It also includes researchers engaged in the study of coastal processes, marine engineering, and others. This broadening of our metocean knowledge base is likely to advance science in such areas as ocean-atmospheric dynamics, numerical modeling, and the forecasting of winds, waves, and weather. An increasing focus on the dynamics of the marine environment will also contribute to improving our understanding of, and preparation for, the risks of a changing climate on offshore activities.