Introduction
Simulation of ocean currents by numerical models has been revolutionized by information technology advances in the last 50 years. New discoveries have resulted from improved observing technologies, such as the global Argo network of autonomous profiling floats (Riser et al., 2016; Argo, 2020) and satellite observations of sea level (Lee et al., 2010; Vinogradova et al., 2025). Improved ocean circulation models have also resulted in new discoveries (Fox-Kemper et al., 2019; Haine et al., 2021), particularly those based on better model grid resolution. The growth in ocean circulation model fidelity brings challenges, however. One challenge concerns the difficulty of providing access to the very large volumes of data ocean circulation models produce, and another concerns the priorities for future cutting-edge ocean circulation model simulations.
This commentary introduces and explains these topics and outlines some possible ways ahead. Developments in cloud storage and cloud computing are providing open cyberinfrastructure platforms that lower the barrier to data access. Open discussion on future circulation model priorities is also beginning. These services for, and engagement with, the oceanographic community aim to make cutting-edge ocean current simulations as widely accessible and as useful as possible.
Grid Cell and Data Growth
Global ocean general circulation models (OGCMs) show exponential growth in grid cell resolution. This remarkable expansion ultimately derives from Moore’s law, which states that the density of microelectronic devices doubles every two years (Moore, 1975). To illustrate, Figure 1 shows the number of horizontal grid cells used to discretize the global ocean in five cutting-edge OGCMs since 1980 (with black dots). The number of horizontal grid cells doubles every 2.5 yr, keeping up with Moore’s law (some of the increase in computer power is used to refine OGCM vertical resolution). Nowadays, cutting-edge OGCMs have horizontal resolutions of around 1 km, with hundreds of millions of grid cells covering the surface of the global ocean.
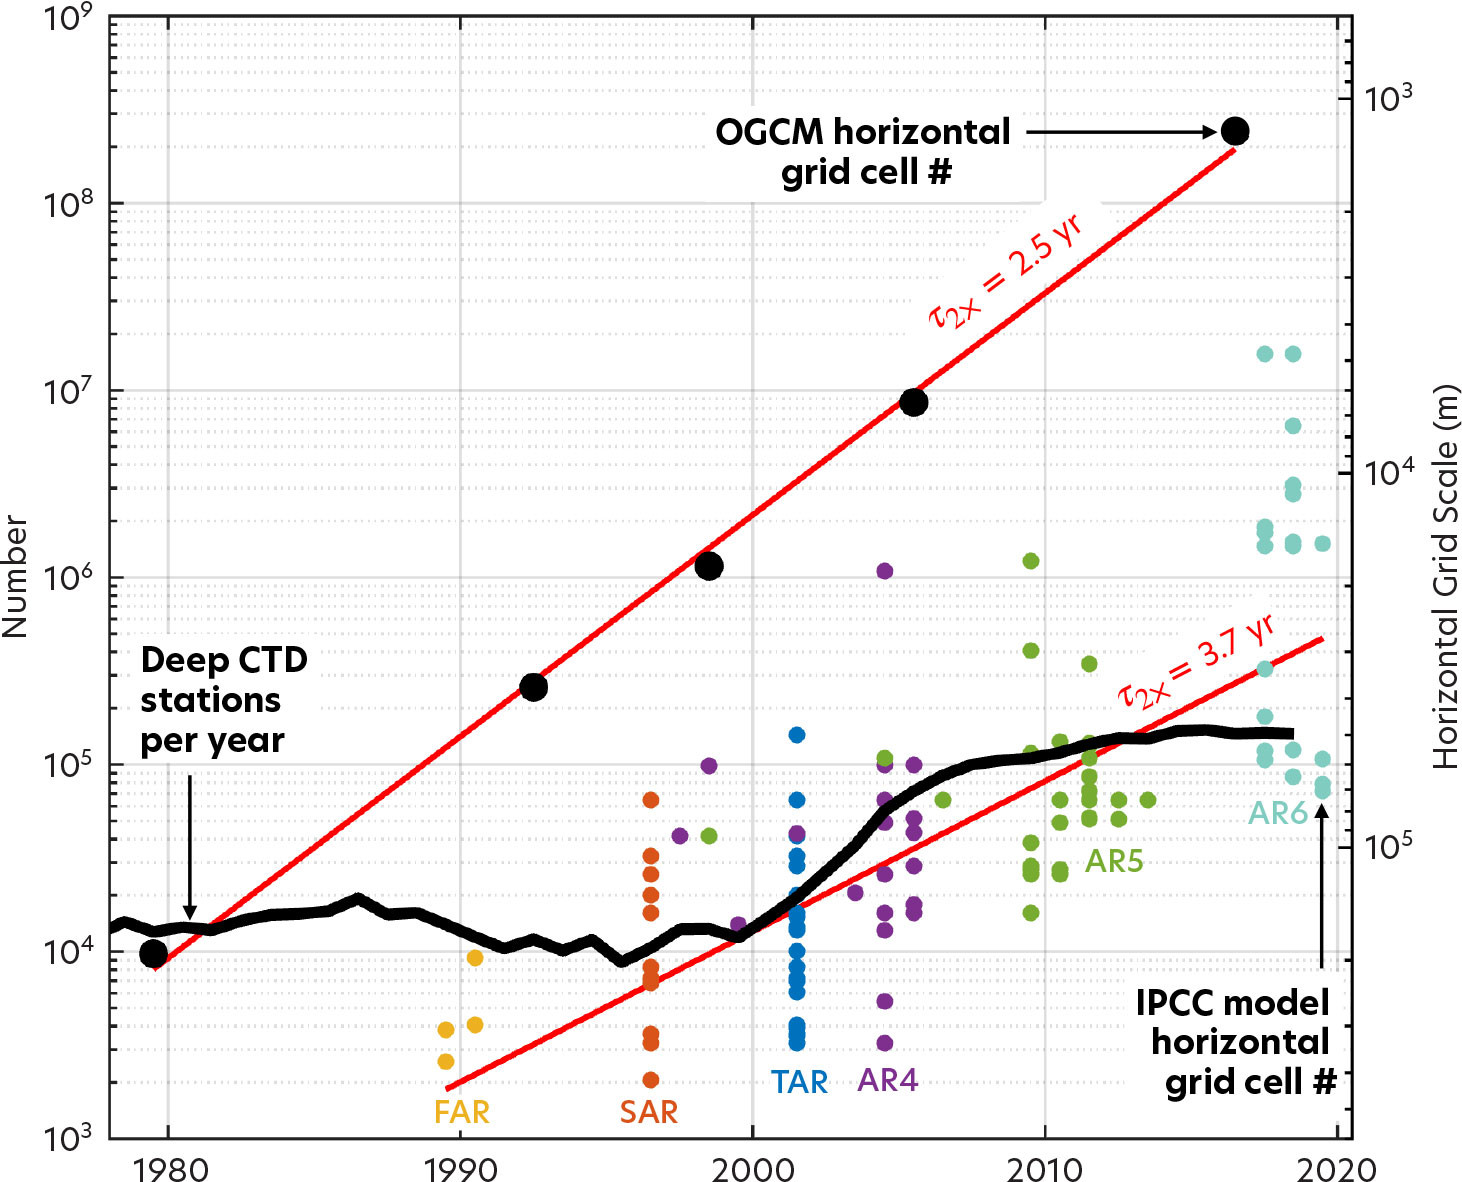
FIGURE 1. Growth over time of the number of horizontal grid cells in global ocean general circulation models (OGCMs, see the black dots), the number of horizontal grid cells in the global coupled climate model from the Intergovernmental Panel on Climate Change (IPCC, see the colored dots), and the number per year of deep (greater than 1,000 m depth) CTD stations. Note that the y-axis is logarithmic and the straight red lines indicate exponential growth (the doubling times, τ2× are shown). The black dot in 2016 is for the LLC4320 OGCM (see text and Figures 2 and 3). The three-letter abbreviations in color refer to the IPCC assessment reports. Modified from Figure 2 in Haine et al. (2021) > High res figure
|
Coupled Earth system models of the kind used to project global climate change by the Intergovernmental Panel on Climate Change (IPCC) also show exponential refinement of the horizontal grid resolution in their ocean models (Figure 1, colored dots). For these models, the doubling time is 3.7 yr, somewhat slower than for OGCMs because other components of the Earth system model compete for the computer speedup.
Observations of the global ocean have been revolutionized by information technology advances too. Figure 1 shows, for example, the number of annual deep stations with high-quality temperature measurements (CTD stations deeper than 1,000 m). In the early 2000s, the rate of such observations increased by a factor of 10 as the global Argo network came online. Today, about 100,000 deep temperature stations are reported each year.
Consider next the relative rates of growth of OGCM resolution and deep temperature measurements. Figure 1 shows that OGCMs outstrip the observations, so there are now around 1,000 horizontal grid cells for every deep temperature station. Put another way, the average spacing between Argo CTD profiles is 300 km, whereas the average spacing between cutting-edge OGCM grid cells is 1 km. In this sense, cutting-edge OGCMs are becoming unconstrained by data because the data are sparse compared to the OGCM degrees of freedom (and notice that this is not true for the ocean components of cutting-edge IPCC models). The unequal growth of OGCM resolution and data density reflects the so-called maturation of computational oceanography (Haine et al., 2021). Cutting-edge OGCMs are thus becoming more and more valuable as a resource in oceanography.
OGCM Solutions and Data Access
LLC4320
For example, the 2016 black dot in Figure 1 is a model solution called LLC4320 (the name refers to the latitude-longitude-cap horizontal grid with 4320 × 4320 grid cells in each of 13 faces that tile the global ocean; Rocha et al., 2016; Arbic et al., 2018). The LLC4320 simulation provides hourly output for one year in 2011–2012 using the Massachusetts Institute of Technology OGCM code. A few similar solutions exist using other circulation models and different configurations. Collectively, such solutions are called “nature runs” or “digital twins” of the ocean currents (Boyes and Watson, 2022; Chen et al., 2023; NASEM, 2024; Vance et al., 2024). They are useful for many purposes that include understanding ocean dynamics, designing observing systems, and machine learning.
Indeed, the oceanographic community is eagerly adopting these cutting-edge OGCM solutions. To illustrate, the red dots in Figure 2 show the number of papers each year that utilize the LLC4320 solution. As in Figure 1, the y-axis of Figure 2 is logarithmic, and straight lines indicate exponential growth. Thus, Figure 2 shows that the number of LLC4320 papers per year has grown roughly as an exponential with a doubling time of around 3 yr; dozens of papers now employ the LLC4320 simulation per year.
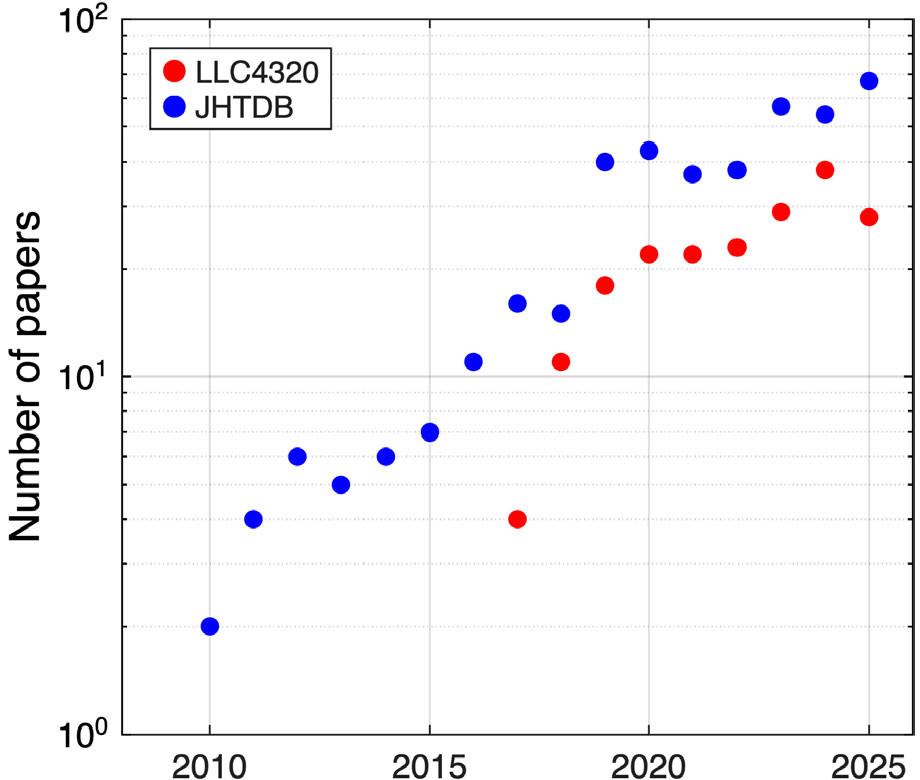
FIGURE 2. Growth over time of the number of papers per year citing the LLC4320 global OGCM and the Johns Hopkins Turbulence Database (JHTDB). Note that the y-axis is logarithmic (the τ2× doubling time for the annual JHTDB citations is 3.0 yr). The data are taken from the LLC4320 and JHTDB websites as of March 2025. > High res figure
|
Despite this growing popularity, the data from LLC4320-type cutting edge simulations are very challenging to use. The main problem is the massive size of the datasets, which means that access to these data is difficult and time-consuming. For LLC4320, the total uncompressed data volume is four petabytes (one petabyte is 1015 bytes), and it takes many months to obtain accounts on the NASA supercomputers where the LLC4320 simulation was run. Moreover, the datasets are far too massive for individual researchers to download and analyze personal copies.
Poseidon Project
Making the LLC4320 (and similar) simulation data easy to use is therefore an important priority. Evidence from a neighboring field in fluid mechanics shows the benefits of opening massive simulation datasets to easy community access. Specifically, the blue dots in Figure 2 show the number of papers each year that utilize the Johns Hopkins Turbulence Database (JHTDB; Li et al., 2008). The JHTDB is an open numerical turbulence laboratory that provides free access to benchmark numerical solutions for various canonical turbulence problems. Figure 2 shows that the number of JHTDB papers per year has also grown exponentially, with a doubling time of 3.0 yr. In total, more than 6 × 10¹⁴ individual model grid cells have been queried using the JHTDB. A recent paper states that “since its publication, the JHTDB had become a gold standard and an hypothesis testing tool in the turbulence community” (Shnapp et al., 2023). This opening up of cutting-edge benchmark simulations has been termed “democratizing the data.” In addition, such databases significantly reduce carbon emissions by reusing extant data rather than recomputing them (Yang et al., 2024).
Inspired by the JHTDB, an initiative called the Poseidon Project has been democratizing the LLC4320 (and similar) OGCM data. Figure 3 illustrates some key features of the Poseidon Project and the modular workflows it supports. The left panel of Figure 3 is a screenshot from the public Poseidon Viewer showing surface relative vorticity in the LLC4320 North Atlantic Ocean. The first Poseidon Project design goal is for users to access the data with very low latency (time delay). The Poseidon Viewer achieves this goal by visualizing the LLC4320 simulation data interactively, including on mobile devices in a few seconds (try the Poseidon Viewer interactive LLC4320 visualization tool).
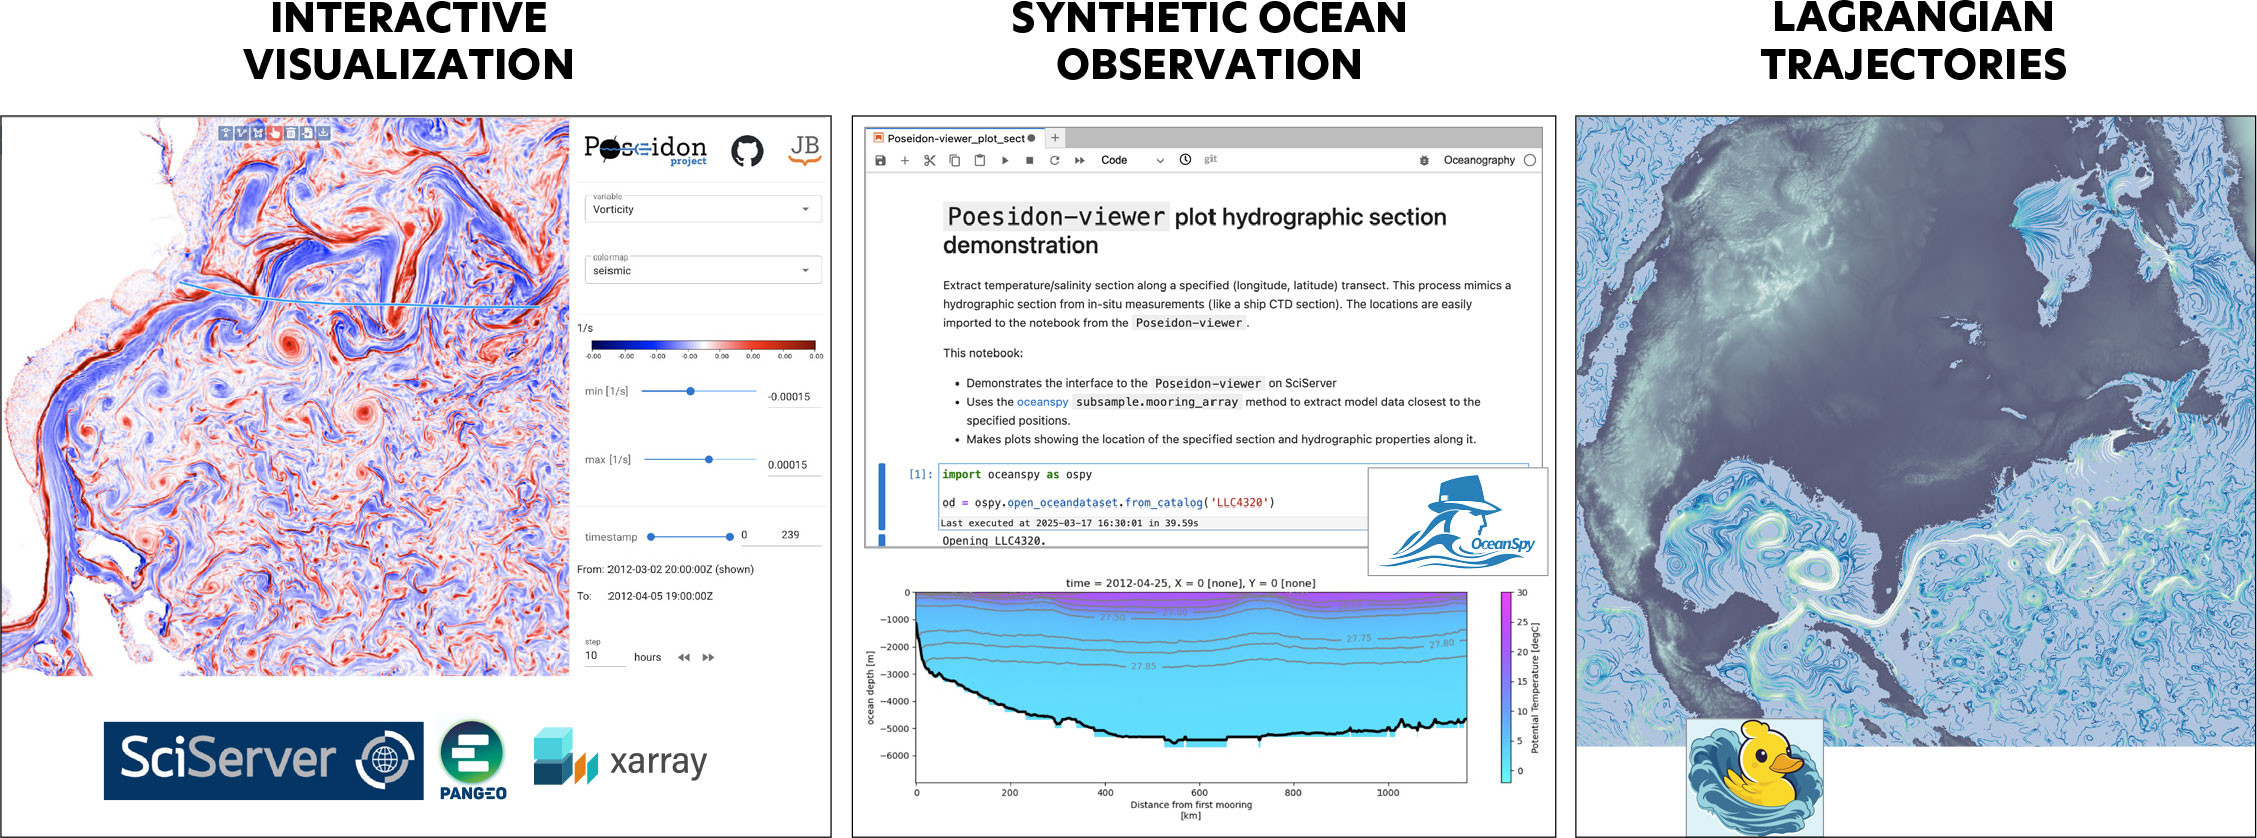
FIGURE 3. The Poseidon Project makes high-resolution OGCM solutions publicly available, such as the global LLC4320 simulation. Users can interact with the data using a mobile-friendly, interactive visualization tool and Python application programming interface software such as OceanSpy (Almansi et al., 2019), which samples the OGCM data using synthetic oceanographic instruments, along with Seaduck (Jiang et al., 2023), which computes Lagrangian trajectories. The data can also be accessed using Pangeo tools such as xarray. Run the Poseidon Viewer interactive LLC4320 visualization tool. > High res figure
|
The second Poseidon Project design goal is to provide a simple software interface for accessing the data. The Poseidon Project (like the JHTDB) is hosted on SciServer, which is a collaborative cloud environment for analysis of extremely large datasets (Medvedev et al., 2016). The SciServer supports Jupyter notebooks for data analysis. The middle panel of Figure 3 shows a screenshot of a SciServer Jupyter notebook using the OceanSpy Python software to analyze LLC4320 data (Almansi et al., 2019). In this example, a synthetic hydrographic section is being plotted. The OceanSpy software is an interface to scalable, open-source tools from the Pangeo community (which can be used directly in SciServer, for example, by using xarray without the OceanSpy interface). The right panel of Figure 3 shows trajectories of drifting particles in the LLC4320 surface currents. The trajectories were computed in a SciServer Jupyter notebook using the Seaduck Python software (Jiang et al., 2023).
The third Poseidon Project design goal is to focus on final computation and rendering of high-quality figures. SciServer achieves these goals by performing data-proximate, lazy calculations (no data downloads are necessary, although they are possible) and providing a robust, stable, fully functional programming environment in the cloud. Thus, anyone with internet access can interact with the LLC4320 data, make calculations, and produce publication-ready figures. This is another sense in which the simulation data are being “democratized” (made open to everyone).
Future OGCM Priorities
Returning to Figure 1, notice that the LLC4320 simulation is already a decade old. Moore’s law has continued in the years since NASA computed LLC4320, and the time is ripe to make a new benchmark cutting-edge calculation. Extrapolating the OGCM red line in Figure 1 suggests that such a new simulation could have 3 × 10⁹ horizontal grid cells, which corresponds to a horizontal grid scale of 350 m. This resolution captures part of the unexplored regime of submesoscale dynamics in which rotational, inertial, and buoyancy effects are all of similar importance (Taylor and Thompson, 2023), and which is very hard to observe with current oceanographic instruments.
Alternatively, the extra computational power could be spent on other priorities. For example, the simulation could be run for longer than one year at the same resolution as LLC4320. Or the initial condition could be improved to avoid transient adjustments during the simulation. The question is, what are the most important priorities and, in particular, how should the extra computational power be spent?
This question was asked during a town hall meeting at the 2024 Ocean Sciences Meeting. Participants in the town hall responded to an online survey that asked them to rank 11 different priorities for designing the next cutting-edge global benchmark OGCM simulation. Participants could also write in their own priorities. Figure 4 shows the results of the survey, summarizing the opinions of 44 respondents (the survey is still open—take the survey).
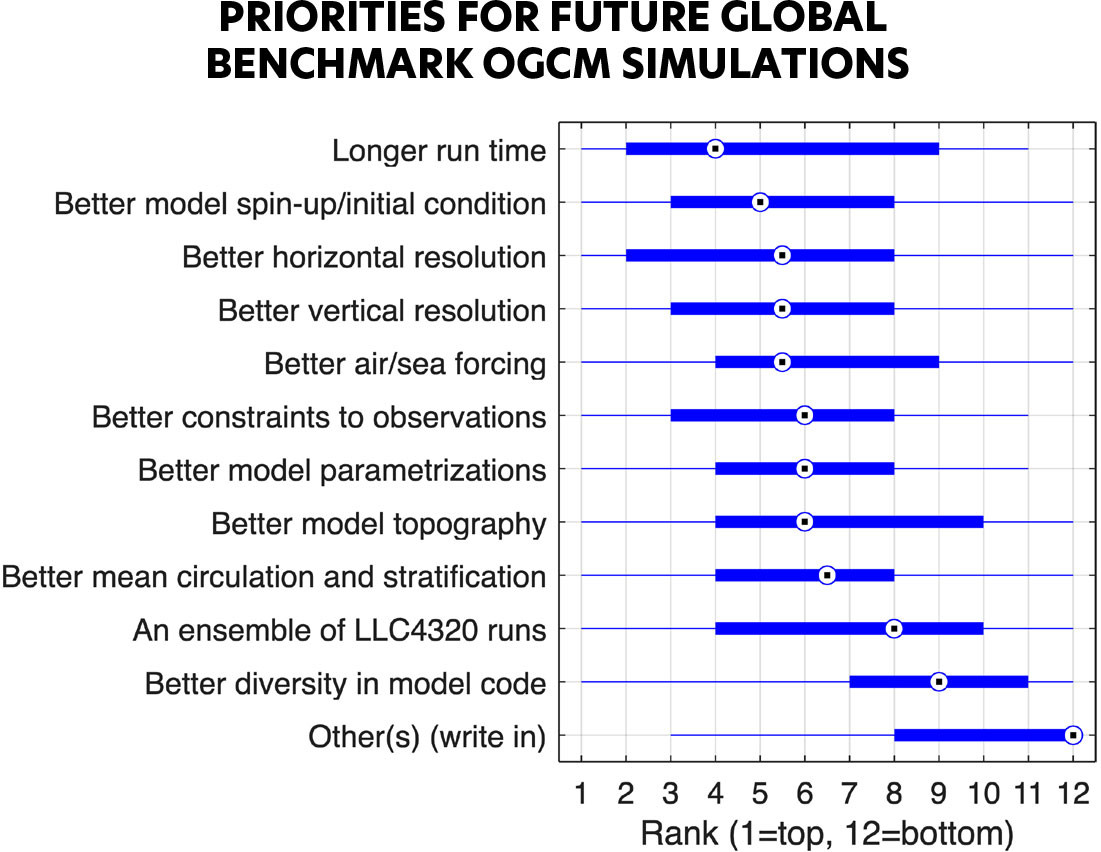
FIGURE 4. Results from a 2024 Ocean Sciences Meeting survey on priorities for the next benchmark global OGCM simulation. Forty-four respondents ranked the priorities on the y-axis on a scale of 1 to 12 (1 is the top priority). The median value is shown with the dotted circle, the 25th and 75th percentiles are shown with the thick bar, and the thin bars indicate maximum and minimum values. “Other(s) (write in)” priorities included adding biogeochemistry, better documentation and tutorials, and better evaluation with observations. Take the survey. > High res figure
|
The survey results show no consensus for future benchmark OGCM solutions because all the priorities were ranked as important by some respondents and as unimportant by others. Nevertheless, preferences are clear overall. The most highly ranked priorities include longer run time and better horizontal and vertical resolution. These priorities are relatively easy to implement because they require little OGCM code development and little pre-computation before the main OGCM code is run. Better model spin-up/initial conditions and better air-sea forcing are also highly ranked. These priorities are harder to implement because they involve improvements (which need to be precisely defined) to input data from other large, complex modeling systems. The four middle-ranked priorities are: better constraints to observations, better model parametrizations, better model topography, and better mean circulation and stratification. These are desirable scientific goals that are easy to state but hard to achieve. One reason is that they involve detailed tuning of OGCM parameters and input data, or improvements to OGCM software. Another reason is that these priorities are interrelated because, for example, improving the mean circulation probably requires better parametrizations and topography, which will inevitably improve agreement with observations. Two priorities were ranked as unimportant overall, namely an ensemble of LLC4320 runs (easy to implement) and better diversity in model code (relatively easy to implement using existing OGCM systems). Other priorities listed by a few respondents included adding biogeochemistry, better documentation, and better comparison with observations.
Outlook
Given the ongoing advances in computational hardware, software, and infrastructure, the time is ripe for a new cutting-edge OGCM solution (or more than one) to be computed. Efforts like LLC4320 and the Poseidon Project require significant resources and therefore need broad support from academia, industry, funding agencies, and non-professional oceanographers. To date, these efforts have been supported by government agencies and private foundations with standalone projects every few years. The need to sustain open shared cyberinfrastructure like SciServer and digital twins like LLC4320 is widely recognized (Barker et al., 2019; Grossman, 2023; Le Moigne et al., 2023; NASEM, 2024). The future sources of support and the pathway for migrating from research project funding to community infrastructure funding are uncertain, however.
One notable example of a stable, long-term, cloud-based data analysis environment for ocean sciences is the Mercator Ocean International and Copernicus Marine Service resource, funded by the European Commission. It provides real-time global ocean hindcasts, analyses, and forecasts using ocean circulation models, in situ and remote observations, and data assimilation (although not presently at the LLC4320 horizontal resolution). Their focus is on operational oceanography and the state of the ocean for diverse stakeholders (von Schuckmann et al., 2024). Apart from academic users, people have applied the Copernicus Marine Service to oil spill modeling, shipping route optimization, and maritime tourism, to name a few. The value of such resources for catalyzing research and expanding the community of users engaged with ocean currents is tremendous.
As this commentary outlines, the track record of ocean model advancements is remarkable, with no obvious end in sight. The knowledge and tools for disseminating and analyzing massive ocean current simulations currently exist. Decisions on future priorities with broad community input and engagement are now required. The prospects for future ocean model improvements and refinement are very bright, and many are straightforward to implement.
Acknowledgments
This work was supported by the National Science Foundation under grants 1835640 and 2103874, by the Institute for Data Intensive Engineering and Science at Johns Hopkins University, and by the Alfred P. Sloan Foundation.