Oceanography The Official Magazine of
The Oceanography Society
Volume 35 Issue 2

View Issue TOC
Volume 35, No. 2
Pages 78 - 80

OpenAccess

THE OCEANOGRAPHY CLASSROOM • Collaborative Sketching to Support Sensemaking: If You Can Sketch It, You Can Explain It

By Kjersti Daae  and Mirjam S. Glessmer  
Jump to
Full text Citation References Copyright & Usage
Full Text

Imagine entering a classroom with your arms full of portable whiteboards. A student looks up, smiles broadly, and says, “Yes—more sketching today! I really enjoy these exercises!” This happened recently in an undergraduate oceanography classroom. Here, we want to share our experiences with collaborative sketching to support students’ sensemaking.

As teachers, we want our students to make sense of how various ocean processes or systems work. Sensemaking is “a dynamic process of building or revising an explanation in order to ‘figure something’ out” (Odden and Russ, 2019). But, where does sensemaking happen in the learning process, and how can we support it? Two metaphors are commonly used to describe learning: “knowledge as acquisition” or “knowledge as participation” (Sfard, 1998). The importance of participation has been stressed in the literature under the umbrella of “active learning” (e.g., Deslauriers et al., 2011, 2019; Freeman et al., 2014).

A third metaphor focuses on “objects of knowledge” (Knorr-Cetina, 2001)—physical representations of ideas or concepts (e.g., texts, sketches, and objects). When a group of students creates physical representations of their learning, they focus on the task and take ownership of the documentation of their learning (Wenger et al., 2002). For example, when a group of students uses a whiteboard to document their discussions, they practice the language of the discipline they are studying (Wood and Kutcher, 2017) while creating a shared understanding of its concepts that is visible to everyone in the same way (Dillenbourg and Traum, 1997), thus constructing a “shared memory” (Dillenbourg and Traum, 2006). The sketches (“objects of knowledge” in pedagogical terms) can be further discussed (Paavola and Hakkarainen, 2005, 2009).

When designing learning situations, teachers continuously make decisions about how to engage students and what kinds of artifacts they ask them to create, and they consider how a series of exercises and instructions can support the students’ learning. When students produce physical representations of their discussions, the instructor can get a good overview of the many discussions taking place in the classroom and better evaluate and decide how to proceed and interact with the students.

We use collaborative sketching exercises to support students’ sensemaking and help them reach two main goals: (1) development of conceptual understandings of central ocean processes or systems, and (2) development of well-founded and testable hypotheses for various practical experiments. During the collaborative sketching activity, students sketch, negotiate, interact with the teacher or other groups, re-sketch, and try to arrive at final sketches they can explain and that make sense (see Examples 1 and 2).


How to Use Collaborative Sketching

We roughly divide the collaborative sketching activity into four steps:

  • Step 1. Establish the boundary conditions. Understand the task, retrieve prior knowledge, and outline the framework for the sketch.
     
  • Step 2. Consider the relevant processes to gain a mechanistic understanding. Make lists of, and sort/​compare, important elements and include them in the sketch.
     
  • Step 3. Analyze and conclude. Make sense of the theory and how various processes and systems interact. This is where we bring in experiments, mini-​lectures, etc.
     
  • Step 4. Apply the knowledge. Analyze various situations or come up with similar examples.

For the sketching exercises, we use portable whiteboards created from inexpensive A3 frames with white sheets of paper placed behind the glass cover and multiple whiteboard markers. When the whiteboard is lying flat on a table, students can access it from all sides in order to contribute to the sketch simultaneously, and it is easy to erase and update parts of the sketch. Using portable whiteboards also makes it easy to share the groups’ solutions with the class simply by holding up the boards and comparing the different sketches. The teacher can invite students to explain parts of their sketches or summarize the similarities or differences between sketches from different groups.


Our Experiences Using Collaborative Sketching

In our undergraduate oceanography course, students often struggle to make sense of new concepts, such as effects of Earth’s rotation. We find that collaborative sketching exercises help students develop conceptual understandings of central processes, including coastal upwelling, geostrophic balance, Hadley circulation, trade winds, and estuarine circulation (see Example 1). The students follow detailed instructions that lead them through Steps 1–4, and they can also interact with the instructor if they get stuck (see blog post at https://mirjamglessmer.com/​sketch2learn/). Sometimes, the student groups find it difficult to reach or agree on conclusions. Instead of providing answers, we support their sensemaking process by incorporating targeted mini-​lectures (5–15 minutes) on the theories they need to apply to their specific questions to help them come up with the answers themselves.


Example 1. How do freshwater sources and sinks shape the circulation in a fjord?

We first ask the students to sketch a transect along a fjord (supporting Step 1). They need to agree on the geography of a fjord, which typically contains a deep basin, a sill, and a connection to the open ocean (Figure B1). To support Step 2, we ask the students to list freshwater sources and sinks and add these to the sketch (typically, river discharge, precipitation, and evaporation). The students then discuss how many distinct layers they expect and how the flow is directed in each layer. This is an important sensemaking step, where the students use their understanding of freshwater fluxes to inform their interpretation of circulation in a fjord. Students often agree on a correct layering of the fjord, but struggle to determine flow directions. Instead of providing the solution, we give a mini-lecture on the conservation of volume and mass (salt), leading to Knudsen’s relations (Knudsen, 1900) for flow in a two-layer fjord. After the mini-lecture, the students continue their discussions and adjust their flow schemes to fit the theory and draw conclusions (Step 3). Finally, the students apply the knowledge of fjord circulation to specific contexts (Step 4). They calculate the current speed for specific fjords and discuss how seasonal changes in freshwater fluxes affect the flow. They could also discuss how tides and wind-generated currents will influence the flow in the various layers.

FIGURE B1. Process sketch of estuarine circulation, including (1) boundary conditions (the fjord geometry), (2) relevant processes—here, fresh­water sources and sinks, and (3) conclusions about the flow scheme in the fjord. The inset to the right shows an example of a student group sketch. > High res figure


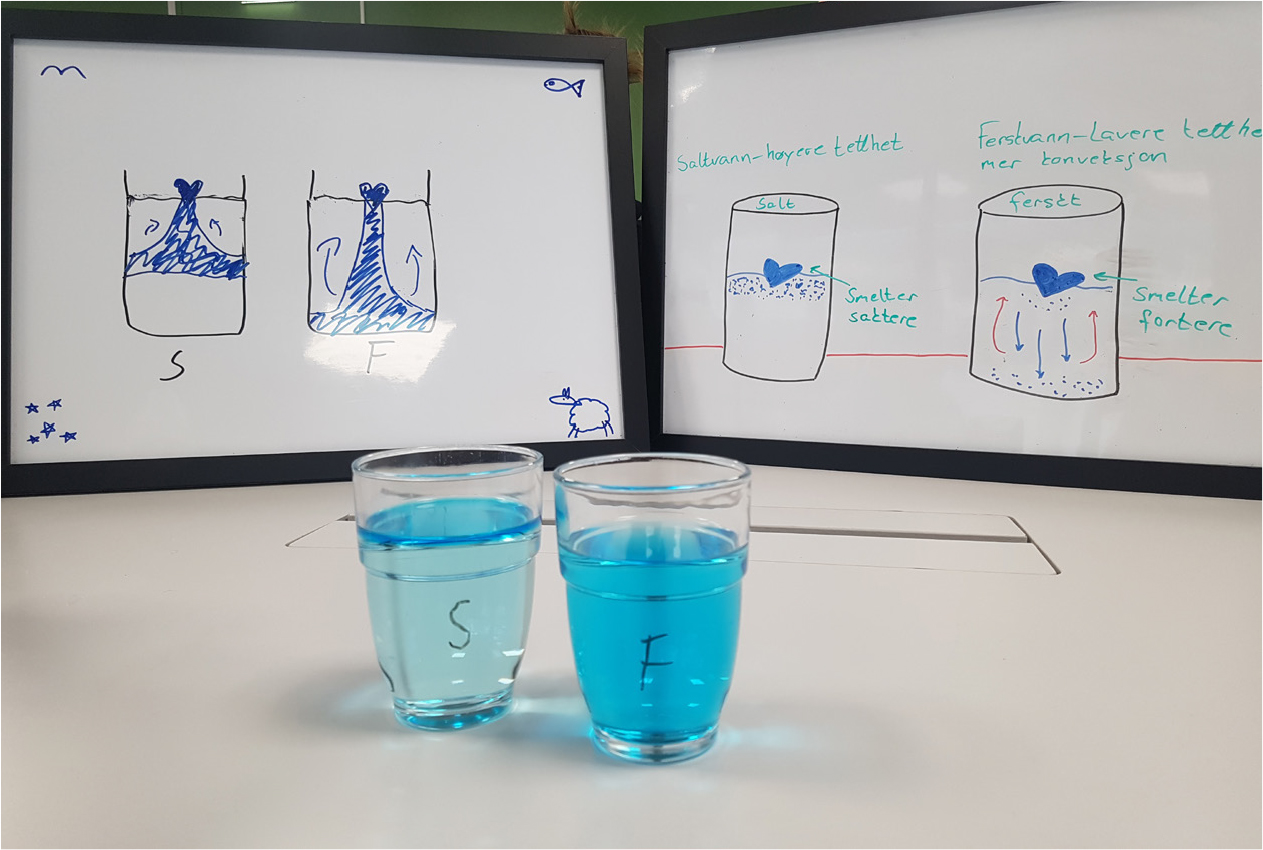
We also find that collaborative sketching helps students develop well-founded and testable hypotheses for practical experiments (such as melting ice cubes to learn about convection in Example 2). First, the sketch provides a concrete and visual representation of the group’s negotiated hypothesis. By inspecting the sketch, the students can more easily discover whether their idea fits with that of the others or if there are possible mismatches that need to be renegotiated. Second, the sketches help the students discuss a system or a process more thoroughly. When sketching their intuitive suggestions, students often realize that there are pieces of the system or the process they did not consider or that parts of their explanations do not make sense.


Example 2. What can we learn about convection in lakes and oceans from melting colored ice cubes in freshwater and saltwater at room temperature?

This is a classical experiment where we typically ask students which ice cube will melt faster—one floating in freshwater or one in saltwater (Glessmer, 2019). Most people (even many with PhDs in physical oceanography) quickly and intuitively suggest that the ice cube in saltwater will melt first. They argue that we use salt to prevent ice from forming on the road, so there must clearly be some sort of rapid melting in the saltwater. But students’ hypotheses change if they are asked to sketch what they predict will happen in the two different cases. When they try to sketch the process (Steps 1–4), they realize that there is something odd that simply does not make sense (for Step 3). They come up with important questions related to convection: Will the meltwater sink, and how deep will it sink? Will the meltwater mix with the ambient water? What will it look like in the end? The follow-up discussions lead the students to renegotiating and modifying the sketches until they agree on an improved hypothesis, suggesting that the ice cube in freshwater will melt first due to convection (Figure B2). After confirming or adjusting the hypothesis through the experiment (Step 3), we ask follow-up questions where students can apply their new understanding (Step 4), for example: Under which circumstances would the ice cube in salt water melt faster?

FIGURE B2. Melting blue heart-shaped ice cubes in freshwater (F) and saltwater (S). Two examples of students’ sketches are shown in the background. > High res figure


In addition to supporting the sensemaking process, the sketching activity promotes a collaborative classroom community where thinking is made visible. Students report that they enjoy the activity, and we often see them decorating their sketches, adding happy faces to elements of the sketch (e.g., the sun), or adding wildlife to emphasize geographic locations (e.g., penguins in Antarctica vs. polar bears in the Arctic).

Using low-tech portable whiteboards increases student participation. Students are used to working with pen and paper, and this method avoids the technical anxiety that digital programs or advanced software might induce. The sketching activity also offers students the possibility of choosing different roles because “just talking” is not the only valid contribution. Even if students choose to contribute to the discussion mainly by drawing, they still need to make sense of the discussion, ask clarifying follow-up questions, and find ways to translate the spoken word into a concrete sketch.

Ultimately, we find that when students have agreed on a drawing, they can explain it to their peers or the teacher, because they have made sense of a problem together. If you can sketch it, you can explain it!

Citation

Daae, K., and M.S. Glessmer. 2022. Collaborative sketching to support sensemaking: If you can sketch it, you can explain it. Oceanography 35(2):78–80, https://doi.org/10.5670/oceanog.2022.208.

References

Deslauriers, L., E. Schelew, and C. Wieman. 2011. Improved learning in a large-enrollment physics class. Science 332(6031):862–864, https://doi.org/​10.1126/science.1201783.

Deslauriers, L., L.S. McCarty, K. Miller, K. Callaghan, and G. Kestin. 2019. Measuring actual learning versus feeling of learning in response to being actively engaged in the classroom. Proceedings of the National Academy of Sciences of the United States of America 116(39):19,251–19,257, https://doi.org/​10.1073/pnas.1821936116.

Dillenbourg, P., and D. Traum. 1997. The role of a whiteboard in a distributed cognitive system. In Swiss Workshop on Distributed and Collaborative Systems, Lausanne, Switzerland.

Dillenbourg, P., and D. Traum. 2006. Sharing solutions: Persistence and grounding in multimodal collaborative problem solving. The Journal of the Learning Sciences 15(1):121–151.

Freeman, S., S.L. Eddy, M. McDonough, M.K. Smith, N. Okoroafor, H. Jordt, and M.P. Wenderoth. 2014. Active learning increases student performance in science, engineering, and mathematics. Proceedings of the National Academy of Sciences of the United States of America 111(23):8,410–8,415, https://doi.org/10.1073/pnas.1319030111.

Glessmer, M.S. 2019. When water swims in water, will it float, or will it sink? Or: what drives currents in the ocean? Frontiers for Young Minds 7:85, https://doi.org/​10.3389/frym.2019.00085.

Knorr-Cetina, K. 2001. Objectual practice. Pp. 175–188 in The Practice Turn in Contemporary Theory. T.R. Schatzki, K. Knorr Cetina, and E. von Savigny, eds, Routledge.

Knudsen, M. 1900. Ein hydrographischer Lehrsatz. Annalen der Hydrographie und Maritimen Meteorologie 28:316–320.

Odden, T.O.B., and R.S. Russ. 2019. Defining sensemaking: Bringing clarity to a fragmented theoretical construct. Science Education 103(1):187–205, https://doi.org/10.1002/sce.21452.

Paavola, S., and K. Hakkarainen. 2005. The knowledge creation metaphor–An emergent epistemological approach to learning. Science & Education 14(6):535–557, https://doi.org/10.1007/s11191-004-5157-0.

Paavola, S., and K. Hakkarainen. 2009. From meaning making to joint construction of knowledge practices and artefacts–A trialogical approach to CSCL. Pp. 83–92 in CSCL ’09: Proceedings of the 9th International Conference on Computer Supported Collaborative Learning, vol. 1.

Sfard, A. 1998. On two metaphors for learning and the dangers of choosing just one. Educational Researcher 27(2):4-13, https://doi.org/​10.3102/​0013189X027002004.

Wenger, E., R.A. McDermott, and W. Snyder. 2002. Cultivating Communities of Practice: A Guide to Managing Knowledge. Harvard Business Review Press, 284 pp.

Wood, K.E., and L.W. Kutcher. 2017. A tale of two classrooms: Active learning in STEM classes using whiteboards. The Journal for Research and Practice in College Teaching 2(1):1–19.

Copyright & Usage

This is an open access article made available under the terms of the Creative Commons Attribution 4.0 International License (https://creativecommons.org/licenses/by/4.0/), which permits use, sharing, adaptation, distribution, and reproduction in any medium or format as long as users cite the materials appropriately, provide a link to the Creative Commons license, and indicate the changes that were made to the original content. Images, animations, videos, or other third-party material used in articles are included in the Creative Commons license unless indicated otherwise in a credit line to the material. If the material is not included in the article’s Creative Commons license, users will need to obtain permission directly from the license holder to reproduce the material.