Introduction
Satellite remote sensing revolutionized our understanding of the ocean surface, revealing tight coupling between biological and physical processes at scales of 100 km and larger and on timescales of weeks to months (McGillicuddy et al., 1998; Siegel et al., 1999; Gaube and McGillicuddy, 2017). Interactions between physical circulation and ocean biology at horizontal scales ranging from the submesoscale (O(0.1–10 km)) to the mesoscale (O(100 km)) have also been implicated as vital for structuring marine ecosystems (White et al., 2010; McGillicuddy, 2016; Lévy et al., 2018) as they move nutrients and organic matter vertically in the water column (Klein and Lapeyre, 2009; Mahadevan, 2016), stir communities laterally (d’Ovidio et al., 2010; Clayton et al., 2013; Lehahn et al., 2017), and connect the ocean’s surface mixed layer and upper mesopelagic zone (Freilich et al., 2024, 2026). However, observational validation of these tight biophysical couplings with implications for community composition only exist through case studies. The overlapping missions of the NASA Surface Water and Ocean Topography (SWOT; Morrow et al., 2019; Fu et al., 2024) and NASA Plankton, Aerosol, Cloud, ocean Ecosystem (PACE; Gorman et al., 2019; Werdell et al., 2019) satellites—providing high-resolution sea surface altimetry and ocean color data, respectively—offer an unprecedented opportunity for expanding biophysical research at the ocean surface.
At global scales, satellite altimetry is used to estimate surface velocity using the geostrophic approximation, which requires computing sea surface height gradients. Conventional altimetry has been used to map sea surface height at scales of ¼° by averaging over 10 or more days of observations (Pujol et al., 2016). This limits observations of currents to those that are in geostrophic balance and are relatively large in scale. Through two-dimensional sea surface height observations, SWOT observations have already revealed energetic coherent submesoscale eddies (wavelengths of 15 km and larger; Morrow et al., 2019; Fu et al., 2024; Archer et al., 2025; Wang et al., 2025) as well as fine-scale eddies and filamentary structures (Coadou-Chaventon et al., 2025; Qiu and Chen, 2025; Verger-Miralles et al., 2025) and ocean waves (Ardhuin et al., 2025). Increased resolution in horizontal velocities can also be used to infer vertical velocities using dynamical frameworks such as the omega equation or surface quasi-geostrophic approaches (Carli et al., 2025), although these methods rely on simplifying assumptions. Mesoscale eddies have relatively weak vertical velocity (O(1−10 m/day)), but the larger velocity gradients and faster temporal scales associated with submesoscale dynamics lead to larger vertical velocities, even when dynamics are largely geostrophic or cyclostrophic and result in tighter biophysical coupling in models and observations of shifts in plankton community structure (Lévy et al., 2015, 2018; Freilich et al., 2022; Gray et al., 2024). Modeling studies show that vertical velocity inferred from surface observations can reduce uncertainty in heat and carbon budgets (Su et al., 2018; Siegelman et al., 2020), suggesting that reductions in biogeochemical uncertainty, including the magnitude of the biological carbon pump and of nutrient fluxes, are possible as well.
Observations suggest that oceanographic small- to fine-scale dynamics do not just alter the abundance of phytoplankton but also result in shifts in community composition due to biogeochemical forcing. For example, diatoms are thought to respond to rapid vertical nutrient injection (Benitez-Nelson et al., 2007; McGillicuddy, 2016), including upwelling that can occur within the interiors of cyclonic eddies. Shifts in community composition have implications for food web dynamics as well for biogeochemical function; such shifts have been observed in focused field campaigns (e.g., Benitez-Nelson et al., 2007; Baltar et al., 2010; Nelson et al., 2014; Tzortzis et al., 2021). Modeling studies are less conclusive regarding the impacts of fronts and eddies on community composition. The signal of lateral redistribution (passive stirring) appears to overwhelm that of a reactive response to vertical nutrient supply in some global studies (Martin and Pondaven, 2003; Clayton et al., 2013; Lévy et al., 2014), while other modeling studies argue for the predominance of reactive dynamics (Marinov et al., 2010; Levy and Martin, 2013; Clayton, 2017a). While conventional ocean color sensors are multispectral, PACE contains a hyperspectral instrument, opening the possibility to infer phytoplankton pigment composition and plankton community structure (Chase et al., 2022; Kramer et al., 2022; Cetinić et al., 2024) on global scales. This global-scale perspective is necessary to constrain the role of fronts and eddies in shaping community composition.
The combination of SWOT and PACE products enables new insights into physical processes operating on timescales relevant to biological growth that previously were limited from space and that cannot be resolved by either platform alone. Here, we present some of the first coincident analyses of SWOT and PACE data to investigate the response of community composition to physical forcing. We demonstrate the potential of combining SWOT and PACE observations through a case study, conditional averaging of biological conditions based on physical characteristics, and seasonal scale temporal analysis.
Data and Methods
SWOT
A primary advancement of the SWOT mission (launched in December 2022) compared to previous sea surface altimeters is the increased horizontal resolution made possible by the Ka-band radar interferometer (KaRIn; Rodriguez et al., 2018). KaRIn makes measurements across two parallel 50 km-wide swaths, providing two-dimensional observations of ocean topography of sub-100 km oceanic processes (Wang et al. 2025; Figure 1a) and routinely capturing ocean eddies at scales of a few kilometers (Archer et al., 2025). SWOT’s two-swath design leaves a 20 km “nadir gap” directly below the satellite, which is filled by a traditional altimeter that provides pointwise measurements (dots in Figure 1a).
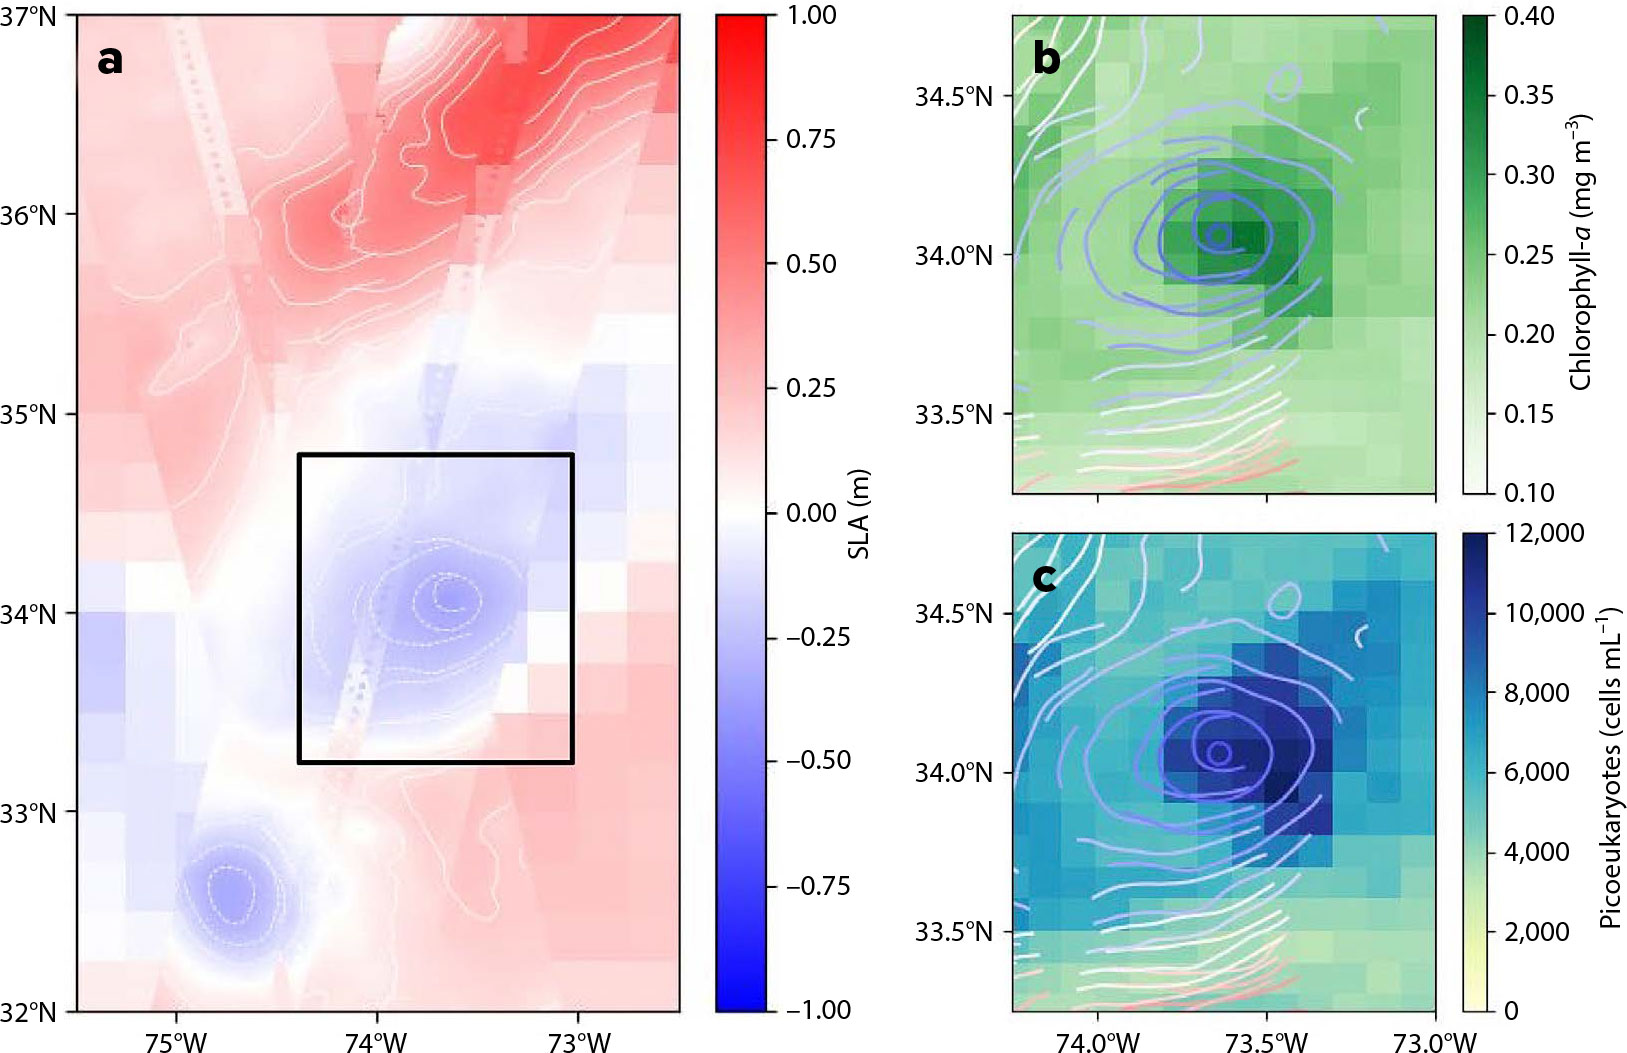
FIGURE 1. A mesoscale eddy is shown as measured by the NASA Surface Water and Ocean Topography (SWOT) satellite and the NASA Plankton, Aerosol, Cloud, ocean Ecosystem (PACE) satellite between March 28 and April 1, 2024: (a) sea level anomaly (SLA in m) as measured by the Data Unification and Altimeter Combination System (DUACS; background grid) and SWOT (swaths), (b) chlorophyll a as measured by PACE with SLA SWOT contours, and (c) Prochlorococcus concentration as estimated by the PACE Multiple Ordination ANAlysis (MOANA) algorithm with SLA SWOT contours.
> High res figure
|
In contrast to the high-resolution swaths of SWOT, DUACS (Data Unification and Altimeter Combination System), an operational multi-mission altimeter data system developed by the French national space agency (CNES), combines along-track measurements from multiple nadir satellite altimeters into gridded, daily sea level fields. The current operational DUACS products are gridded at ¼° (~25 km) resolution through mapping and interpolation, which smooths variability at smaller scales. As a result, DUACS products are optimized for high temporal coverage, whereas SWOT enables the observation of finer-scale variability at the expense of less frequent sampling.
Sea level anomaly (SLA) and absolute dynamic topography (ADT) from two different SWOT products are presented here. Figure 1 uses a Level 3 (L3; version 3.0) product of individual swaths on a 2 km × 2 km grid. The data presented in the rest of the manuscript use the provisional Level 4 (L4; version 2.0) product Multiscale Interpolation Ocean Science Topography (MIOST), which provides gridded fields by incorporating nadir altimetry satellite data from DUACS with SWOT KaRIn measurements (Ballarotta et al., 2025; Ubelmann et al., 2021). The MIOST product consists of daily gridded products at 1/10° (~10 km) spatial resolution at global scale and is under provisional status, meaning it is publicly available but still undergoing validation and refinement. The MIOST product is generally too coarse to resolve inertia-gravity waves, meaning that the sea surface height gradients predominantly reflect geostrophic currents. MIOST data are accessed from the AVISO+ server, supported by CNES. SWOT L3 data are also available and documented on NASA EarthData.
The Rossby number (Ro) is a non-dimensional number that represents the ratio of inertial forces to Coriolis forces, indicating whether a fluid flow is dominated by Earth’s rotation (low magnitude Ro) or by its own inertia (high magnitude Ro). In this study, Ro is used to quantify the strength and polarity (sign of rotation) of mesoscale circulation and to classify ocean regions into cyclonic, anticyclonic, and background flow regimes. Ro is calculated as
Ro = ζ/f = (vx − uy)/f,
where u and v are the zonal and meridional geostrophic velocities, respectively, and f is the Coriolis parameter. Subscripts represent partial derivatives. The assumption of geostrophy breaks down when the Rossby number approaches O(1), so the Rossby numbers calculated here are only estimates.
PACE
PACE (launched in February 2024) introduced a number of advances for research across the hydrosphere, biosphere, and atmosphere (Gorman et al., 2019; Werdell et al., 2024). In the context of ocean biology, the hyperspectral nature of the Ocean Color Instrument (OCI) allows us to derive different phytoplankton pigmentations from spectral remote sensing reflectances, not only for the calculation of chlorophyll a concentrations but also for first-order derivation of community composition (Cetinić et al., 2024). PACE L3 mapped products are provided with a horizontal resolution of 4 km and 1/10°.
For this study, PACE data is accessed from the Ocean Biology DAAC L3 and L4 browser. These data, including derived products, are also available and documented on NASA EarthData. The PACE OCI product for chlorophyll a is currently in provisional status.
The Multiple Ordination ANAlysis (MOANA) algorithm takes advantage of the hyperspectral ocean color radiometry of PACE-OCI and returns near-surface concentrations of three different phytoplankton groups in cells mL–1: Prochlorococcus, Synechococcus, and autotrophic picoeukaryotes (Figure 1c). The approach, described in Lange et al. (2020), uses a principal component analysis and multiple regression, requiring inputs of remote-sensing reflectance collected by PACE-OCI. Sea surface temperature is also used for the calculation of Prochlorococcus concentrations, but not for the other phytoplankton groups. MOANA is in provisional status, so currently is only produced for and validated in the Atlantic sector of the global ocean. Additional algorithms for delineating community composition from PACE-OCI’s hyperspectral surface reflectance are also in development at NASA.
Data Merging
PACE and SWOT have fundamentally different global coverage times due to their observing geometries: PACE’s wide-swath, sun-synchronous orbit enables near-daily global coverage, whereas SWOT’s narrower swath and interferometric sampling has a longer effective revisit time (a global average of 11 days). Because our focus is on mesoscale features rather than submesoscale structure captured in swaths, we use the MIOST product, which sacrifices some spatial resolution to provide more temporally consistent, gap-free fields that are better suited for tracking the evolution of mesoscale features. As a result, we are able to get near-daily overlaps between SWOT and PACE data.
For each day analyzed, we incorporate available PACE observations within a ±2-day window, forming a five-day composite to enhance spatial coverage while maintaining near-coincident sampling. Because ocean color observations are limited by cloud cover, substantial spatial and temporal gaps in daily satellite measurements occur. To mitigate these effects, we exclude data from the five-day averages during which more than 50% of the region of interest is cloud covered. This temporal averaging reduces noise associated with intermittent cloud contamination and increases the number of valid observations contributing to each estimate, while still preserving variability at the mesoscale. The five-day averaged observations are then collocated onto the relevant sea surface altimetry grid by averaging all measurements within each altimetry pixel.
Regional Study Setting
This study focuses on analyzing data from 63°–75°W, 30°–40°N in the North Atlantic Ocean (between April and November 2024. This region was chosen for its energetic mesoscale variability associated with the Gulf Stream and its frequent shedding of cyclonic cold-core eddies into the subtropical gyre. These eddies, typically O(100 km) in diameter, form from Gulf Stream meanders and propagate southwestward, transporting relatively nutrient-rich and biologically distinct Slope Sea waters into the oligotrophic subtropical Atlantic (The Ring Group, 1981; McGillicuddy et al., 1998).
The region encompasses a strong meridional gradient in physical and biogeochemical properties across the Gulf Stream that separates cooler, more productive waters to the north from warmer, nutrient-poor waters to the south. Cyclonic eddies in this region are associated with depressed sea surface height and positive relative vorticity (Gaube and McGillicuddy, 2017). The April–November time frame captures the transition from the spring bloom through stratified summer conditions and into early fall. This seasonal window allows for investigation of both episodic (subseasonal) variability associated with individual eddies and broader seasonal shifts in biological response to physical forcing.
To focus on subtropical eddies and minimize contamination from the Gulf Stream core, analyses are restricted to waters south of the Gulf Stream, identified using an absolute dynamic topography (ADT) threshold of 0.3 m. Closed contours exceeding this threshold are retained to preserve coherent eddy structures with relatively low ADT that extend south of the Gulf Stream.
Results
SWOT’s two-dimensional swath data are higher resolution than the ¼° data from DUACS, so they capture submesoscale features and provide finer resolution of sea level anomalies associated with mesoscale eddies (Figure 1a). Examining swath data with collocated PACE observations demonstrates tight correspondence between enhanced chlorophyll a concentration and the core of a cyclonic eddy (Figure 1b).
Compared to the conventional DUACS product, the SWOT-informed MIOST product also resolves features with larger magnitude Rossby numbers, indicating a greater prevalence of high-magnitude vorticity (long tails; Figure 2a). This expanded range reflects SWOT’s ability to resolve smaller-scale, higher-intensity motions. In the context of the Gulf Stream region, SWOT captures a wider range of physical features than DUACS (Figure 2b). Though DUACS captures the larger coherent cyclonic mesoscale eddies, it misses smaller submesoscale eddies. Even in eddies that are present in both the SWOT and DUACS products, the contours of the eddy edges (as defined by an SLA or the Rossby number threshold) are smoother with SWOT than DUACS, and SWOT identifies larger regions with high Rossby numbers, higher eddy core Rossby numbers, and more elongated (anisotropic) features (Middleton et al., 2025). In addition, within the Gulf Stream itself, DUACS captures some cyclonic features; however, SWOT captures both more cyclonic features and the elliptical natures of these features.
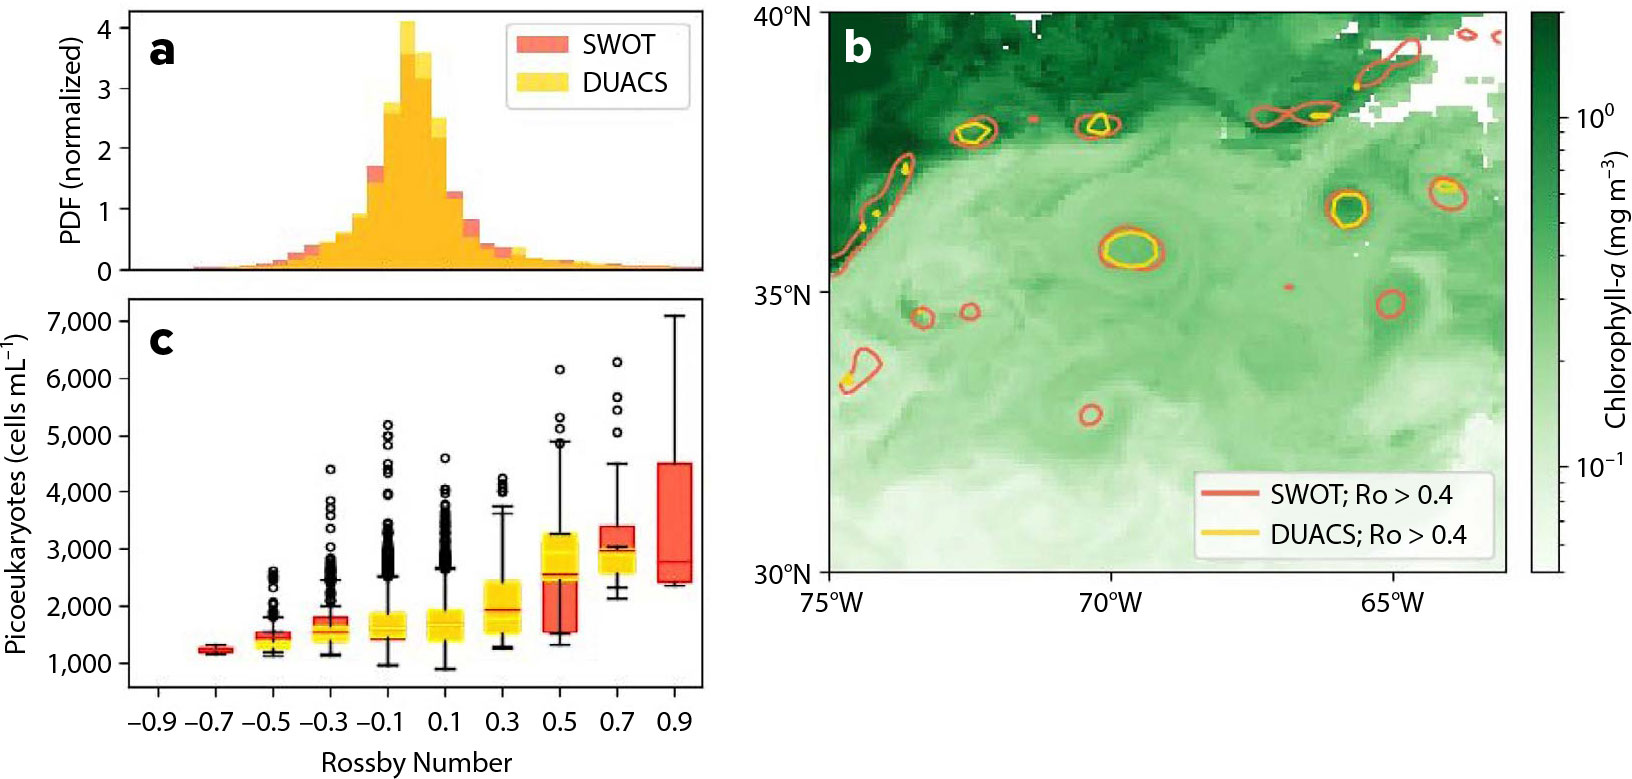
FIGURE 2. These panels illustrate the advancement of SWOT over DUACS for capturing small-scale features. (a) Probability density function (PDF) of the Rossby number measured across the study region from March 2024 through October 2024. (b) Five-day average (April 11–15, 2024) of derived concentrations of chlorophyll a (mg m−3) from PACE overlain by contours of Ro > 0.4 for both SWOT (red) and DUACS (yellow). (c) Concentration of autotrophic picoeukaryotes (cells mL−1) binned per Ro for both SWOT (red) and DUACS (yellow) south of the Gulf Stream.
> High res figure
|
Binning observations of PACE-OCI derived community composition products by Rossby number demonstrates that the extended tails of the SLA distribution captured by SWOT and increased fidelity contribute biologically relevant information (Figure 2c). In the areas of the Ro distribution with 90% of the data (–0.3 < Ro < 0.3), the binned averages and ranges of chlorophyll a concentrations and cell counts (e.g., picoeukaryote cells in Figure 2c) look similar between both DUACS and SWOT. However, the greatest deviations in phytoplankton concentration are observed at the lowest and highest Ro. The extreme Ro values observed only in the SWOT dataset, –0.7 and 0.9, reveal the tightest biophysical coupling with the lowest and highest phytoplankton concentrations, respectively.
At high Ro (Ro ≥ 0.5; cyclonic), we also observe a distinct signal between DUACS and SWOT. Both products reveal that higher Ro is associated with higher phytoplankton concentrations. However, we observe generally lower concentrations of autotrophic picoeukaryotes for a given Ro in SWOT than in DUACS because DUACS products underestimate Ro for a given feature compared with SWOT. This result provides concrete evidence that submesoscale dynamics (Ro of order 1) are most significant for primary producers and for the growth of autotrophic picoeukaryotes.
While prior literature has mostly focused on responses by fast growing taxa such as diatoms to physical forcing, the combination of PACE and SWOT observations suggests systematic variation in photosynthetic cyanobacteria (Prochlorococcus and Synechococcus) across physical features, in addition to the systematic enhancement of autotrophic picoeukaryotes (Figure 3). In contrast to larger diatoms, which can achieve maximum growth rates of ~1–2 day–1 under favorable conditions (Marañón, 2015), smaller cyanobacteria such as Prochlorococcus and Synechococcus typically grow more slowly, with rates on the order of ~0.2–0.7 day–1, depending on light and nutrient availability (H. Liu et al., 1998). The highest concentrations of Synechococcus (~20,000 cells mL–1; Figure 3c,d) and the autotrophic picoeukaryotes (~3,000 cells mL–1; Figure 3e,f) are aligned with features that exhibit strongly positive Ro, the cyclonic eddies shed from the Gulf Stream or that have local upwelling in their cores. The concentrations of these taxa in what could be considered background waters without eddies (i.e., |Ro| < 0.1) and in anticyclones, which are downwelling, are significantly lower (~10,000 cells mL–1 for Synechococcus and ~1,000 cells mL–1 for picoeukaryotes). The inferred concentration of Prochlorococcus (Figure 3a,b) also appears to respond to eddies, with evidence of elevated concentrations in both cyclonic and anticyclonic features.
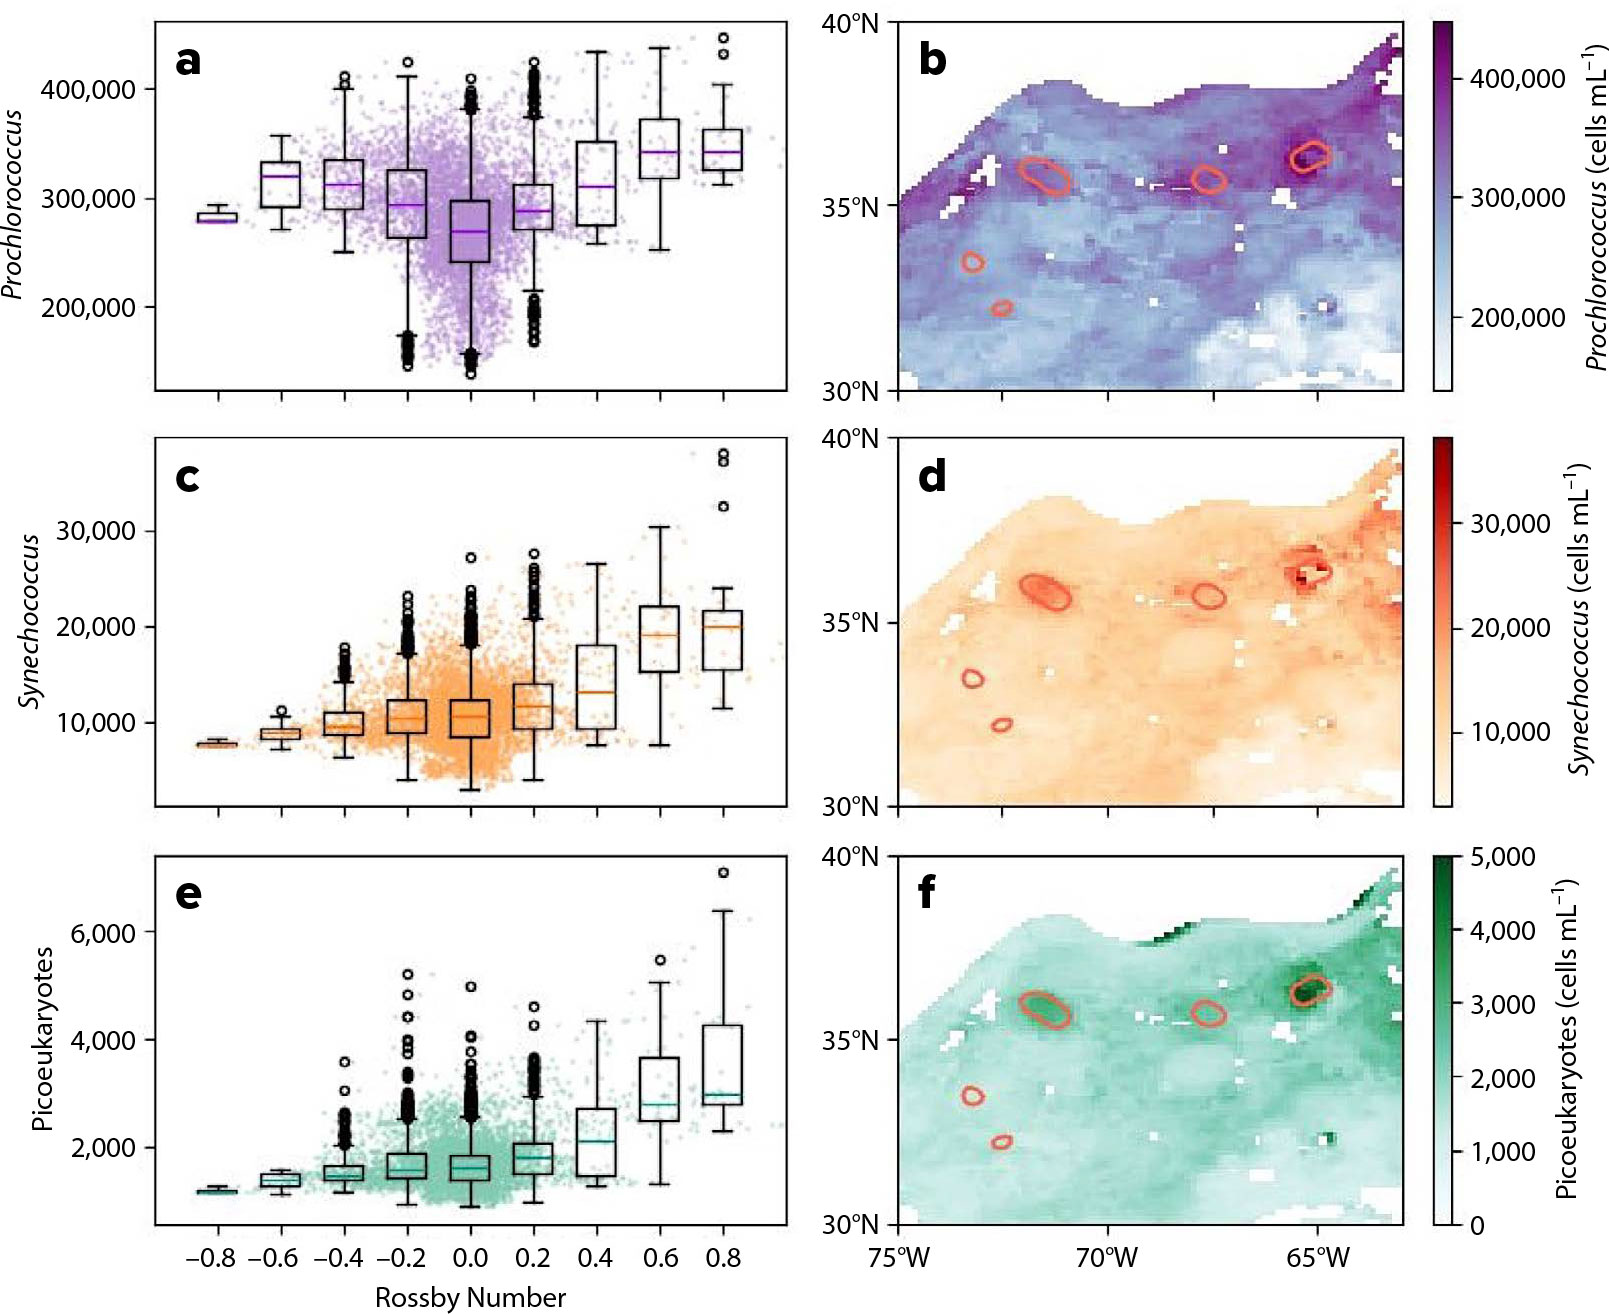
FIGURE 3. Derived plankton concentrations from the MOANA algorithm applied to PACE-OCI (June 1–5, 2024). Concentrations (cells per mL) are plotted per binned Rossby number for (a) Prochlorococcus, (c) Synechococcus, and (e) picoeukaryotes. Points in (a), (c), and (e) show the five-day averaged points and are not binned. Snapshots (June 1–5, 2024) are shown of derived plankton concentrations in the region of consideration for (b) Prochlorococcus, (d) Synechococcus, and (f) picoeukaryotes. Red contours indicate locations of Ro > 0.4 as measured by SWOT, and areas north of the Gulf Stream (as determined by an ADT > 0.3 m unclosed contour threshold) are masked.
> High res figure
|
By merging five-day averaged PACE snapshots of the Gulf Stream region with the daily gridded SWOT product, we investigate the seasonal evolution and subseasonal variability of these plankton groups. Figure 4 shows the average concentration of Prochlorococcus, Synechococcus, and autotrophic picoeukaryotes in cyclonic eddies (colored lines, Ro > 0.4) and in background conditions (black lines, |Ro| < 0.1) between April and October 2024.
Cyclonic mesoscale eddies have distinct biological composition compared to their surrounding waters, with enhancement of all phytoplankton groups observed by MOANA throughout nearly the whole spring and summer (Figure 4), but there is evidence that this biological composition shifts seasonally. Between April and July, the spring bloom results in enhanced concentration of plankton across the domain. During this time frame, concentrations of Synechococcus (Figure 4b) and autotrophic picoeukaryotes (Figure 4c) are heightened within cyclonic eddies compared to background ocean values, with statistically significant differences between the two dynamic regions. The differences are up to 2.5 times as large (Figure 4d), with subseasonal, episodic intensifications. The peaks of Synechococcus and picoeukaryotes are well aligned, suggesting a common controlling factor. In the same time period, Prochlorococcus does not exhibit the spring bloom background enhancement. However, the concentration of Prochlorococcus within cyclonic eddies is slightly higher than background (Figure 4a), but the ratio between the two falls between 1.0 and 1.2, lower than other plankton groups.
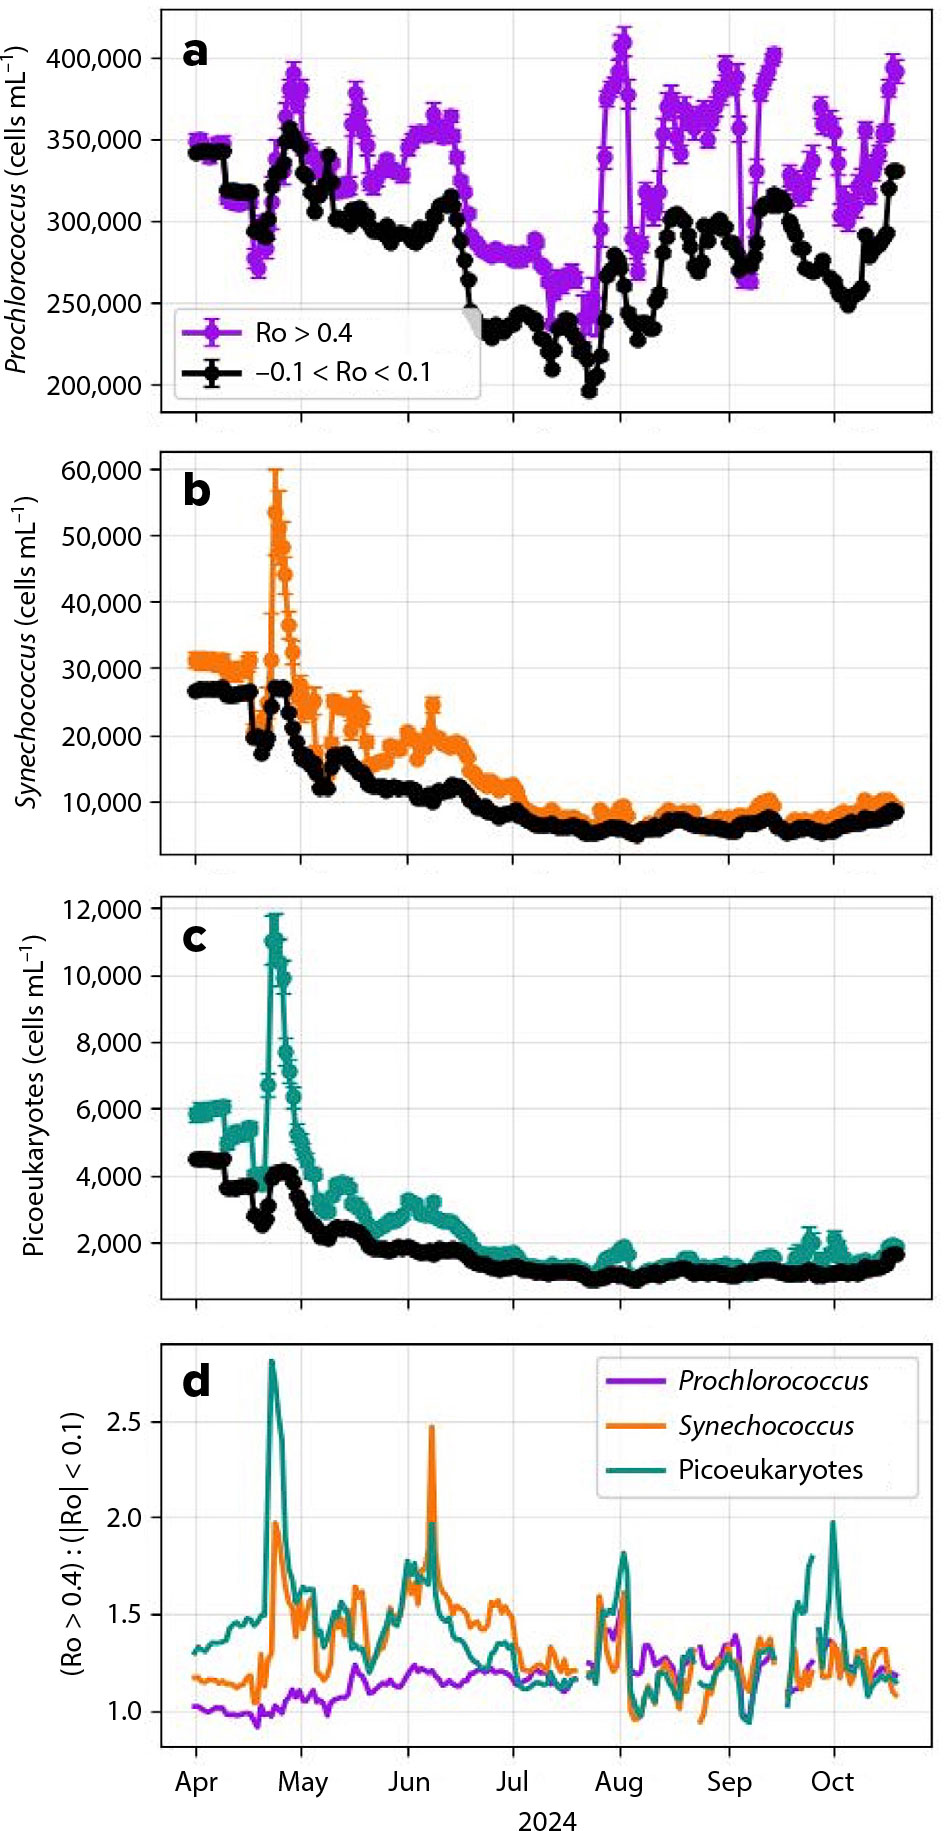
FIGURE 4. Time series of community composition where Ro > 0.4 (cyclonic eddies) and |Ro| < 0.1 (background) are plotted for (a) Prochlorococcus, (b) Synechococcus, and (c) autotrophic picoeukaryotes. Error bars represent standard error of the mean for concentrations on each date. Dates when more than 50% of the composited regional area was covered with clouds were removed from analysis. (d) Ratio of community composition at Ro > 0.4 and |Ro| < 0.1 for each taxonomic group.
> High res figure
|
Between August and November, the ratios between cyclonic features and background for the three plankton groups converge around 1.25, with some variability. Generally, concentrations of Synechococcus and picoeukaryotes are lower than in the spring, while concentrations of Prochlorococcus remain somewhat constant, with potentially higher concentrations within cyclones than in background. During this time frame, the concentrations of Synechococcus and picoeukaryotes within cyclonic eddies and in background waters are statistically indistinguishable.
Discussion
Differential Enhancement of Plankton Groups Within Cyclonic Eddies
Global-scale simultaneous observations of physical properties from SWOT and ocean color properties from PACE demonstrate that there is differential enhancement of all distinguished plankton groups (Prochlorococcus, Synechococcus, and picoeukaryotes) within subtropical and Gulf Stream eddies in the spring and early summer. Specifically, the largest concentrations of autotrophic picoeukaryotes and Synechococcus are found in cyclonic eddies, and these dynamic features are central to describing the distribution of plankton communities throughout the domain.
Community compositions in mesoscale eddies can be attributed both to local upwelling and to their source waters. In the case of the cyclonic eddies in the region of focus, many are Gulf Stream eddies with source waters in the Slope Water north of the Gulf Stream (Richardson, 1980; The Ring Group, 1981). After formation, eddy-driven processes can modify the biogeochemical properties of the “trapped” water. One such eddy-driven process that is a hallmark of cyclonic eddies is nutrient injection due to upwelling that causes intermittent nutrient fluxes into the euphotic zone (McGillicuddy et al., 1998; Doblin et al., 2016). In addition, submesoscale dynamics on eddy edges can be significant sources of nutrients that fuel production (Omand and Mahadevan, 2015; Freilich and Mahadevan, 2019). Taken together, eddies significantly shape nutrient distributions in the subtropics (Gupta et al., 2022). Eddy processes dominate nutrient replenishment in the thermocline of subtropical gyres, as compared to microscale turbulence (Oglethorpe et al., 2025). Autotrophic picoeukaryotes and Synechococcus concentrations increase significantly in biomass following nutrient enrichment in both laboratory and field studies (Fernández-González et al., 2022; Coello-Camba et al., 2020). These observations provide important evidence for the influence of eddy-driven processes on shifts in community composition. In situ observations (Clayton et al., 2017b; Oms et al., 2024) and multispectral satellite observations (Lévy et al., 2025) also document shifts in community composition at fronts.
Here, by combining remote sensing with independent physical information from SWOT, we establish the significance of eddy processes for the compositions of communities in the subtropical gyre. Our analysis masks the source waters of the eddies under consideration, so we do not quantitatively assess the contributions of lateral transport across the Gulf Stream within eddies compared with vertical transport during and after eddy spin up in structuring the plankton community here; however, such investigations are a potential use case for an integrated SWOT-PACE dataset.
Prochlorococcus, the most abundant plankton in the open ocean, demonstrates less differential enhancement than other plankton groups. This is consistent with the group’s known physical and ecological traits as Prochlorococcus is optimized for low-nutrient, stratified conditions (Johnson et al., 2006; X. Liu and Levine, 2016), which are not favored within cyclonic eddies but are generally present in the subtropical Atlantic. The low ratio (1.2) of cyclonic-to-background Prochlorococcus concentrations (Figure 4d) suggests that cyclonic enhancement is weak relative to natural variability and provides evidence for ecologically relevant shifts in community composition within eddies rather than agnostic biomass enhancement (Gérikas Ribeiro et al., 2016). However, the elevated concentrations of Prochlorococcus in both cyclonic and anticyclonic features (Figure 3a) suggest that they are not completely out-competed due to eddy nutrient enrichment. There are potentially different ecotypes of Prochlorococcus that respond to eddies (Sheyn et al., 2025), that cannot be resolved with current datasets, but that may be inferred with future algorithms applied to PACE-OCI.
The biological response to cyclonic eddies exhibits a pronounced seasonal dependence in this region. During spring and early summer spring bloom period (April–July), Synechococcus and picoeukaryotes reach their annual peaks in the surface waters in this region. There is also pronounced enhancement of the same species in cyclonic eddies, particularly within episodic pulses of enhanced concentrations. The observed enhancement of Synechococcus and picoeukaryotes within cyclonic eddies is consistent with known physical properties associated with spring and summertime, as surface nitrate and other macronutrients in the upper ocean are typically drawn down through spring and summer biological uptake and only replenished during deeper winter mixing (Louanchi and Najjar, 2001). We observe a seasonal pattern with greater enhancement of Synechococcus and picoeukaryotes within cyclonic eddies in the spring and early summer than in later summer and fall. This pattern likely arises due to vertical shifts in water column structure with surface-enhanced biomass in the spring transitioning to deep chlorophyll maxima in the summer, which are out of view of satellites. The episodic, subseasonal intensification of both Synechococcus and picoeukaryotes concentrations suggests response to a shared physical control. The observed subseasonal variability highlights the value of the combined SWOT and PACE repeat sampling with a consistent method for observing across the full annual cycle. These observations could be complemented by subsurface observations to link shifts in surface composition to subsurface processes including formation of deep chlorophyll maxima and carbon flux (Benitez-Nelson et al., 2007; Choi et al., 2020; Marañón et al., 2021; Freilich et al., 2024).
Together, these results demonstrate that Gulf Stream and subtropical cyclonic eddies act as transient, seasonally modulated ecological niches that restructure surface microbial communities. Both source waters and local eddy dynamics play roles in shaping eddy microbial communities, reinforcing the tight coupling between mesoscale physical dynamics and marine microbiome composition. Since the original investigations of cold-core Gulf Stream rings in the 1970s and 1980s, appreciation has grown for smaller-scale eddying features that also have their roots in Gulf Stream meanders (Gula et al., 2019; Gronniger et al., 2023; Jensen et al., 2025). The techniques employed here can be applied broadly, from Gulf Stream frontal eddies in the South and Mid-Atlantic Bight, which are central to nearshore energetics and microbial ecosystems, to distinguishing mesoscale from submesoscale eddies, which are hypothesized to exert different controls on community structure, and to eddy dynamics in other regions.
Toward Coincident Biophysical Measurements Across the Globe
For the first time, the scientific community can now use space-based measurements to observe planktonic community composition alongside the physical processes that shape its distribution. Using this capability, we show that coherent mesoscale eddies are well resolved by a combination of SWOT and PACE observations. In addition to confirming traditional paradigms about enhancements of picoeukaryotes in mesoscale eddies, we have documented systematic shifts across phytoplankton taxa as observed by MOANA. Thinking beyond the mesoscale, investigations of biophysical interactions at the submesoscale from space (Archer et al., 2025) may be possible through increased use of swath observations. Joint SWOT and PACE products offer opportunities to optimize field campaigns by guiding concurrent sampling strategies for biological, chemical, and physical properties in both coastal and open ocean environments.
Despite the massive step forward in observational oceanography that SWOT and PACE present, there remain limitations to these products. Cloud cover limits effective ocean color retrievals, resulting in significantly reduced coverage at the equator and in the polar oceans. Further development of ocean color algorithms is expected to yield new insights into community composition, but these algorithms may be subject to geographic biases in their training data as well as additional biases introduced by reliance on sea surface temperature or salinity. Additionally, during its science phase orbit, the KaRIn altimeter has a relatively low spatial footprint (120 km) and a swath return time of 21 days, making real-time tracking of quickly evolving surface ocean features challenging, and also reducing the overlap between individual submesoscale events and PACE observations. However, the global coverages of SWOT and PACE provide the opportunity for advanced hindcast and real-time observations, especially as the dataset grows over the coming years.
Implications and Future Prospects
SWOT and PACE are steps toward a truly integrated understanding of biophysical oceanography across the globe. These overlapping missions present new opportunities for investigation of critical oceanic biophysical interactions with a wide range of implications. The eddy features studied here are not resolved by current Earth system models; however, the observations reveal that eddies contain significant ecological niches. It is therefore important to evaluate whether models are effectively parameterizing their net biogeochemical impacts in present and future climates (Lévy et al., 2025). Increased resolution of phytoplankton community structure and its correspondence with physical features have implications for both primary production and estimation of the strength of the biological carbon pump (Siegel et al., 2014; Omand et al., 2015; Bellacicco et al., 2025). The observation that larger phytoplankton are more abundant in eddies supports the perspective that eddies may enhance export by promoting blooms in addition to advection of high biomass.
Understanding how the different components of the microbial community respond to eddies and other dynamic features such as fronts can help to advance mechanistic understanding of the organizing forces of phytoplankton community structure through examining responses to perturbations. Investigation of ecological responses to physical forcing will be further enabled by the continued advancement of algorithms for plankton community composition using PACE-OCI (Chase et al., 2017; El Hourany et al., 2019; Kramer et al., 2024). There are important outstanding questions regarding the impacts of physical oceanographic processes on phytoplankton abundance and composition. For example, while observations reveal alignment of physical and biological hotspots, it remains unclear how much of the enhancement of chlorophyll a and shifts in community composition observed in eddy features arises from lateral redistribution from highly productive regions compared with productivity due to eddy nutrient supply. Disentangling the relative roles of vertical and lateral fluxes and elucidating the ways that the three-dimensional nature of biophysical interactions restructures plankton communities and nutrient distributions will be an important application of PACE and SWOT observations. Beyond studying individual features, as more data becomes available, it is critical to quantify annual variability of biological growth driven by eddy processes and the rectified contribution of eddies to the timing and magnitude of the annual cycle of productivity through increased light availability (Mahadevan et al., 2012) and nutrient supply.
These questions are significant not just for the scientific research community but also for the many communities that interact with the ocean. For example, fisheries are influenced by mesoscale eddies (Arostegui et al., 2022; Watts et al., 2006; Sato et al., 2026). Cross-disciplinary collaboration will continue to enhance the impact of science with these new satellite missions. As these observational capabilities continue to expand, they will be critical for improving our ability to understand, predict, and manage ocean ecosystems in a changing climate.
Conclusions
The concurrent SWOT and PACE missions stand to substantially enhance the scientific community’s ability to observe and study ocean dynamics and biophysical interactions at the mesoscale as well as the submesoscale. At the same time, fully exploiting the increased resolution from SWOT and biological products from PACE requires the development of new analysis workflows that can bridge individual events to broader, global-scale perspectives. These advances are especially relevant for biogeochemical and ecological variables, as plankton populations are known to respond to mesoscale eddies, underscoring the importance of resolving these features to better disentangle ocean–ecosystem interactions. Increased understanding of ecological responses to ocean dynamics promises to improve projections of ocean responses to climate and environmental change through improved mechanistic understanding.
Acknowledgments
LAD was partially funded by a NOAA C&GC Postdoctoral Fellowship administered through UCAR Cooperative Programs for the Advancement of Earth System Science (CPAESS). This work was partly funded by NASA Ocean Biology and Biogeochemistry grant 80NSSC24K1422 to MAF. The code used to generate figures in this manuscript can be found on GitHub.