Introduction
Despite efforts over the past few decades in recruiting more racially underrepresented groups and women into the field, ocean science education and research programs continue to struggle to retain participation of these groups from graduate studies into academic positions (e.g., O’Connell, 2014; Orcutt and Cetinić, 2014; Cook et al., 2016; Brooks and Déniz-González, 2021; Legg et al., 2023). This paper’s findings show there has not been much progress in building interest among non-White (NW) participants to enter ocean science, though programs are doing a better job of enrolling those who do apply. Still, NW racial groups make up, on average, less than 20% of in-residence graduate students and graduate degree recipients, which is not much higher than previously reported figures (20% or less; Cook et al., 2016) and is far less than their relative representation in the US population (42.2%, including more than one race, based on US Census Bureau 2020 Decennial Census Data). It is also significantly less than the overall percentage of NW individuals receiving PhD awards across all fields (32.1%) and in science and engineering (31.7%; NCSES, 2023). Participation of NW individuals drops even further in academic positions, though we find positive overall trends for total NW individuals there. The picture is not the same for each individual racial group.
While ocean science is not achieving representative NW participation at any level, student through to academic positions, the situation for women shows mixed success. Women have exceeded parity at the PhD recipient level in ocean sciences, which is far better than the case for PhD recipients reported across all fields (47.0%) or for all science and engineering (44.1%; NCSES, 2023). However, ocean science continues to face challenges in retaining women. The percentage of women decreases with seniority in faculty positions (e.g., non-tenured through tenured positions), as we’ve seen in other reviews (e.g., O’Connell, 2014; Orcutt and Cetinić, 2014; Cook et al., 2016; Brooks and Déniz-González, 2021; Legg et al., 2023), though, as with total NW groups, our findings for women also show positive trends for academic positions.
To assess recruitment and retention of NW racial groups and women within ocean science programs in the last two decades, we use a 15-year data set (2007–2021) to analyze the trends in demographics of ocean science graduate students and academic positions in the United States. The data were collected by the Consortium for Ocean Leadership and supported by the Ocean Science Educators’ Retreat (OSER) series that initiated it. These OSER surveys were valuable tools for monitoring diversity at multiple levels in academic ocean science programs.
Our analysis provides an updated assessment of the participation of US racially underrepresented groups (2011–2021) and women (2007–2021) across three focus areas: (1) graduate student recruitment (applications, offers sent, and new enrollments), (2) graduate student retention (in-residence students, number of master’s and PhD degrees awarded), and (3) academic positions (tenure, tenure-track, non-tenure, temporary, and postdoctoral). We present the significant trends seen across these focal areas over the last 15 years. The Results section outlines trends for US citizens across seven racial groups, as well as, for context, an overview of findings for all US citizens and for the entire population surveyed through OSER. We also present an analysis of the data for women as a comparison to the trends seen for NW US citizens. The Discussion provides an integrated assessment of these trends, including where there is success versus ongoing challenges for building participation of NW groups in the ocean sciences, as well as for recruitment and retention in the field as a whole. Finally, we consider potential impacts of COVID-19 on the ocean science community and reported data. The trends and findings illuminated by these analyses provide context for future action among higher education leaders—and the broader ocean science and stakeholder community—to address the ongoing challenges in broadening participation in our field.
Methods
These analyses used annual data on graduate students and academic positions in US ocean science graduate programs collected from 2007 to 2021. The Consortium for Ocean Leadership (COL), a nonprofit organization with membership that included institutions across the country with graduate ocean science programs, collected and maintained these data in consultation with its member community (an effort referred to as OSER).
The analysis uses data for total and women beginning with the 2007–2008 academic year, when a faculty survey expanded the original 1970s graduate survey and when the survey collection was digitized. The survey was restructured again for the 2011–2012 academic year to modify collection of race and ocean science subdiscipline data and to add new hire data for academic positions (except postdoctoral positions). For the 2020–2021 academic year, questions were added for intersectionality (students and faculty by gender and race together); COVID-related policies and impacts; institutional diversity, equity, and inclusion (DEI) efforts; and organizational structures of ocean science programs within institutions with encouragement to collate and report data from all relevant schools and departments.
The last academic year represented in this data set is 2020–2021. We analyzed the data both with and without this last year to see if there is an impact on trends. We did this for two reasons. First, the 2020–2021 academic year began in the heart of the global COVID-19 pandemic, which could have resulted in anomalies due to the impact of the pandemic on universities, individuals, and, importantly, underrepresented groups and women (NASEM, 2021). In addition, for this year of data collection, we altered the survey in ways that could have an effect on the results relative to previous years, particularly with respect to greater effort on capturing data across all schools and departments with ocean science-related degree programs, which could have increased the per institution reporting numbers from the standing baseline.
This analysis is based on three focal areas:
1. Student Recruitment. Applications received, offers sent, and new enrollments
2. Student Retention. Number of in-residence graduate students, and of degrees awarded (master’s and PhD)
3. Academic Positions. Tenure, tenure-track, non-tenure, temporary, and postdoctoral positions
The number of graduate applications, offers, and new enrollments per year per institution were reported as indicators of student recruitment. Additionally, the number of enrolled graduate students and graduate degrees awarded (master’s and PhD degrees separately) were reported per year per institution as indicators of student retention. Student data were categorized by gender, race (of US citizens), and subdiscipline. For academic positions, the number of people in each position (tenure, tenure-track, non-tenure, temporary, and postdoctoral) were reported per year per institution by gender, race (of US citizens), and subdiscipline (since 2012, academic positions as a whole, excluding postdoctoral positions), along with number of new hires (excluding postdoctoral positions).
The surveys collected race data for US citizens. The following racial groupings were included in the survey: American Indian/Native Alaskan, Asian American, Black/African American, Hispanic/Latino (one or more races), Native Hawaiian/Other Pacific Islander, Non-Hispanic/Latino (more than one race), Unknown, and White. These groupings align with the National Science Foundation’s Survey of Earned Doctorates collection on race and ethnicity (Heuer et al., 2023). We analyzed only binary gender for students and academic positions because the data are not self-reported; the reported numbers for non-binary are too low for meaningful statistical analyses and only a reporting option starting in 2019.
The responding institutions were asked to report academic positions and student recruitment and retention within seven categories of ocean science subdisciplines: (1) marine policy (including marine affairs and law), (2) marine biology and/or biological oceanography, (3) marine chemistry and/or chemical oceanography, (4) marine geology and/or geophysics, (5) ocean engineering, (6) physical oceanography, and (7) other ocean sciences (including aquatic environmental science, coastal and estuarine studies, fisheries and aquaculture, ocean conservation, and other). These data were collected by racial groups for 2020–2021 and by gender for 2007–2021. Across the three focal areas, the percentage of NW individuals by subdiscipline is calculated from the total number of individuals in that subdiscipline. Therefore, while percentages across the subdisciplines are reported in descending order, the n corresponding to that percentage may not be in descending order.
Number of Reporting Institutions
Reporting institutions were selected based on having an ocean science degree-granting program in the United States, with one exception for Nova Scotia. The majority of institutions are from coastal states (East, West, Gulf, and Great Lakes) as a result of such teaching institutions being predominately located along coasts.
Historically, 55 institutions were invited to submit survey responses annually. Of the original 55 institutions, 37 were state schools, 5 were private universities, 6 were research institutions, 5 mixed institutions, and 2 unclassified. In some cases, research institutions transitioned from independent institutions to being part of a state school (e.g., mixed). Also, some institutions had joint-degree-granting programs, and in those cases each institution reported separately.
The number of reporting institutions varied each year and across question types. The average number of reporting institutions per year for the graduate survey was 26.3 and for the faculty survey was 25.6 (Supplementary Table S1).
Analysis
Variables from the graduate survey (student recruitment and student retention) and the faculty survey (academic positions) were calculated per institution per year by overall numbers, percentage of US citizens by seven racial groupings, percentage of women, and across seven subdisciplines:
- For racial data, tenure, tenure-track, non-tenure-track, and temporary positions were reported as one number, postdoctoral positions were reported separately, and new hires were not collected.
- For women, all five positions were reported as separate numbers, and new hires were collected except for postdoctoral positions and by race.
These variables were reported for racial groupings of US citizens from 2011 to 2021 (except for academic positions that were reported from 2007 to 2021), and for total population and for women from 2007 to 2021. Also, racial groupings by gender were reported for the last year—2020 to 2021. The number of new academic positions created each year (by overall and gender) was reported and excluded postdoctoral positions.
The variables in all three focal areas (student recruitment, student retention, and academic position indicators) were first divided by the number of reporting institutions in that year, then averaged over the length of the data set. A standard deviation for each average is also reported. A linear regression was calculated to assess whether the time series data has an upward or downward trend within a 95% confidence interval. If the p-value of a measured variable was less than 0.05, there is a trend (up or down) in the data. A p-value greater than 0.05 indicated no trend in the data.
The numbers reported across most NW racial groups are small, making meaningful statistical analysis challenging, yet statistical significance is listed when found. Tables S2 and S5–S7 include numbers per institution for individual racial groupings.
Results
The results are organized into three major sections: (1) Racial Trends of US Citizens, (2) Gender Trends of Total Population, and (3) DEI Initiatives Across Institutions. Trends across the three focal areas (Student Recruitment, Student Retention, and Academic Positions) are presented within the first two sections. Race was reported by gender (i.e., intersectionality) and by subdiscipline in 2020–2021, and those data are reported under each focal area as well as in the online supplementary materials. Results for total population and women by subdiscipline can be found in the supplementary materials.
Racial Trends of US Citizens
Student Recruitment
For total US citizens from 2011 to 2021, an average of 58.8 applications were received (SD = 12.2), 19.3 offers sent (SD = 3.9), and 16.7 new graduate students enrolled (SD = 3.3) per institution per year (Tables 1 and S2). The number of US citizen applicants had a significant downtrend with and without 2020–2021 data (p = 0.002 and 0.023; Table 1, Figure 1a).
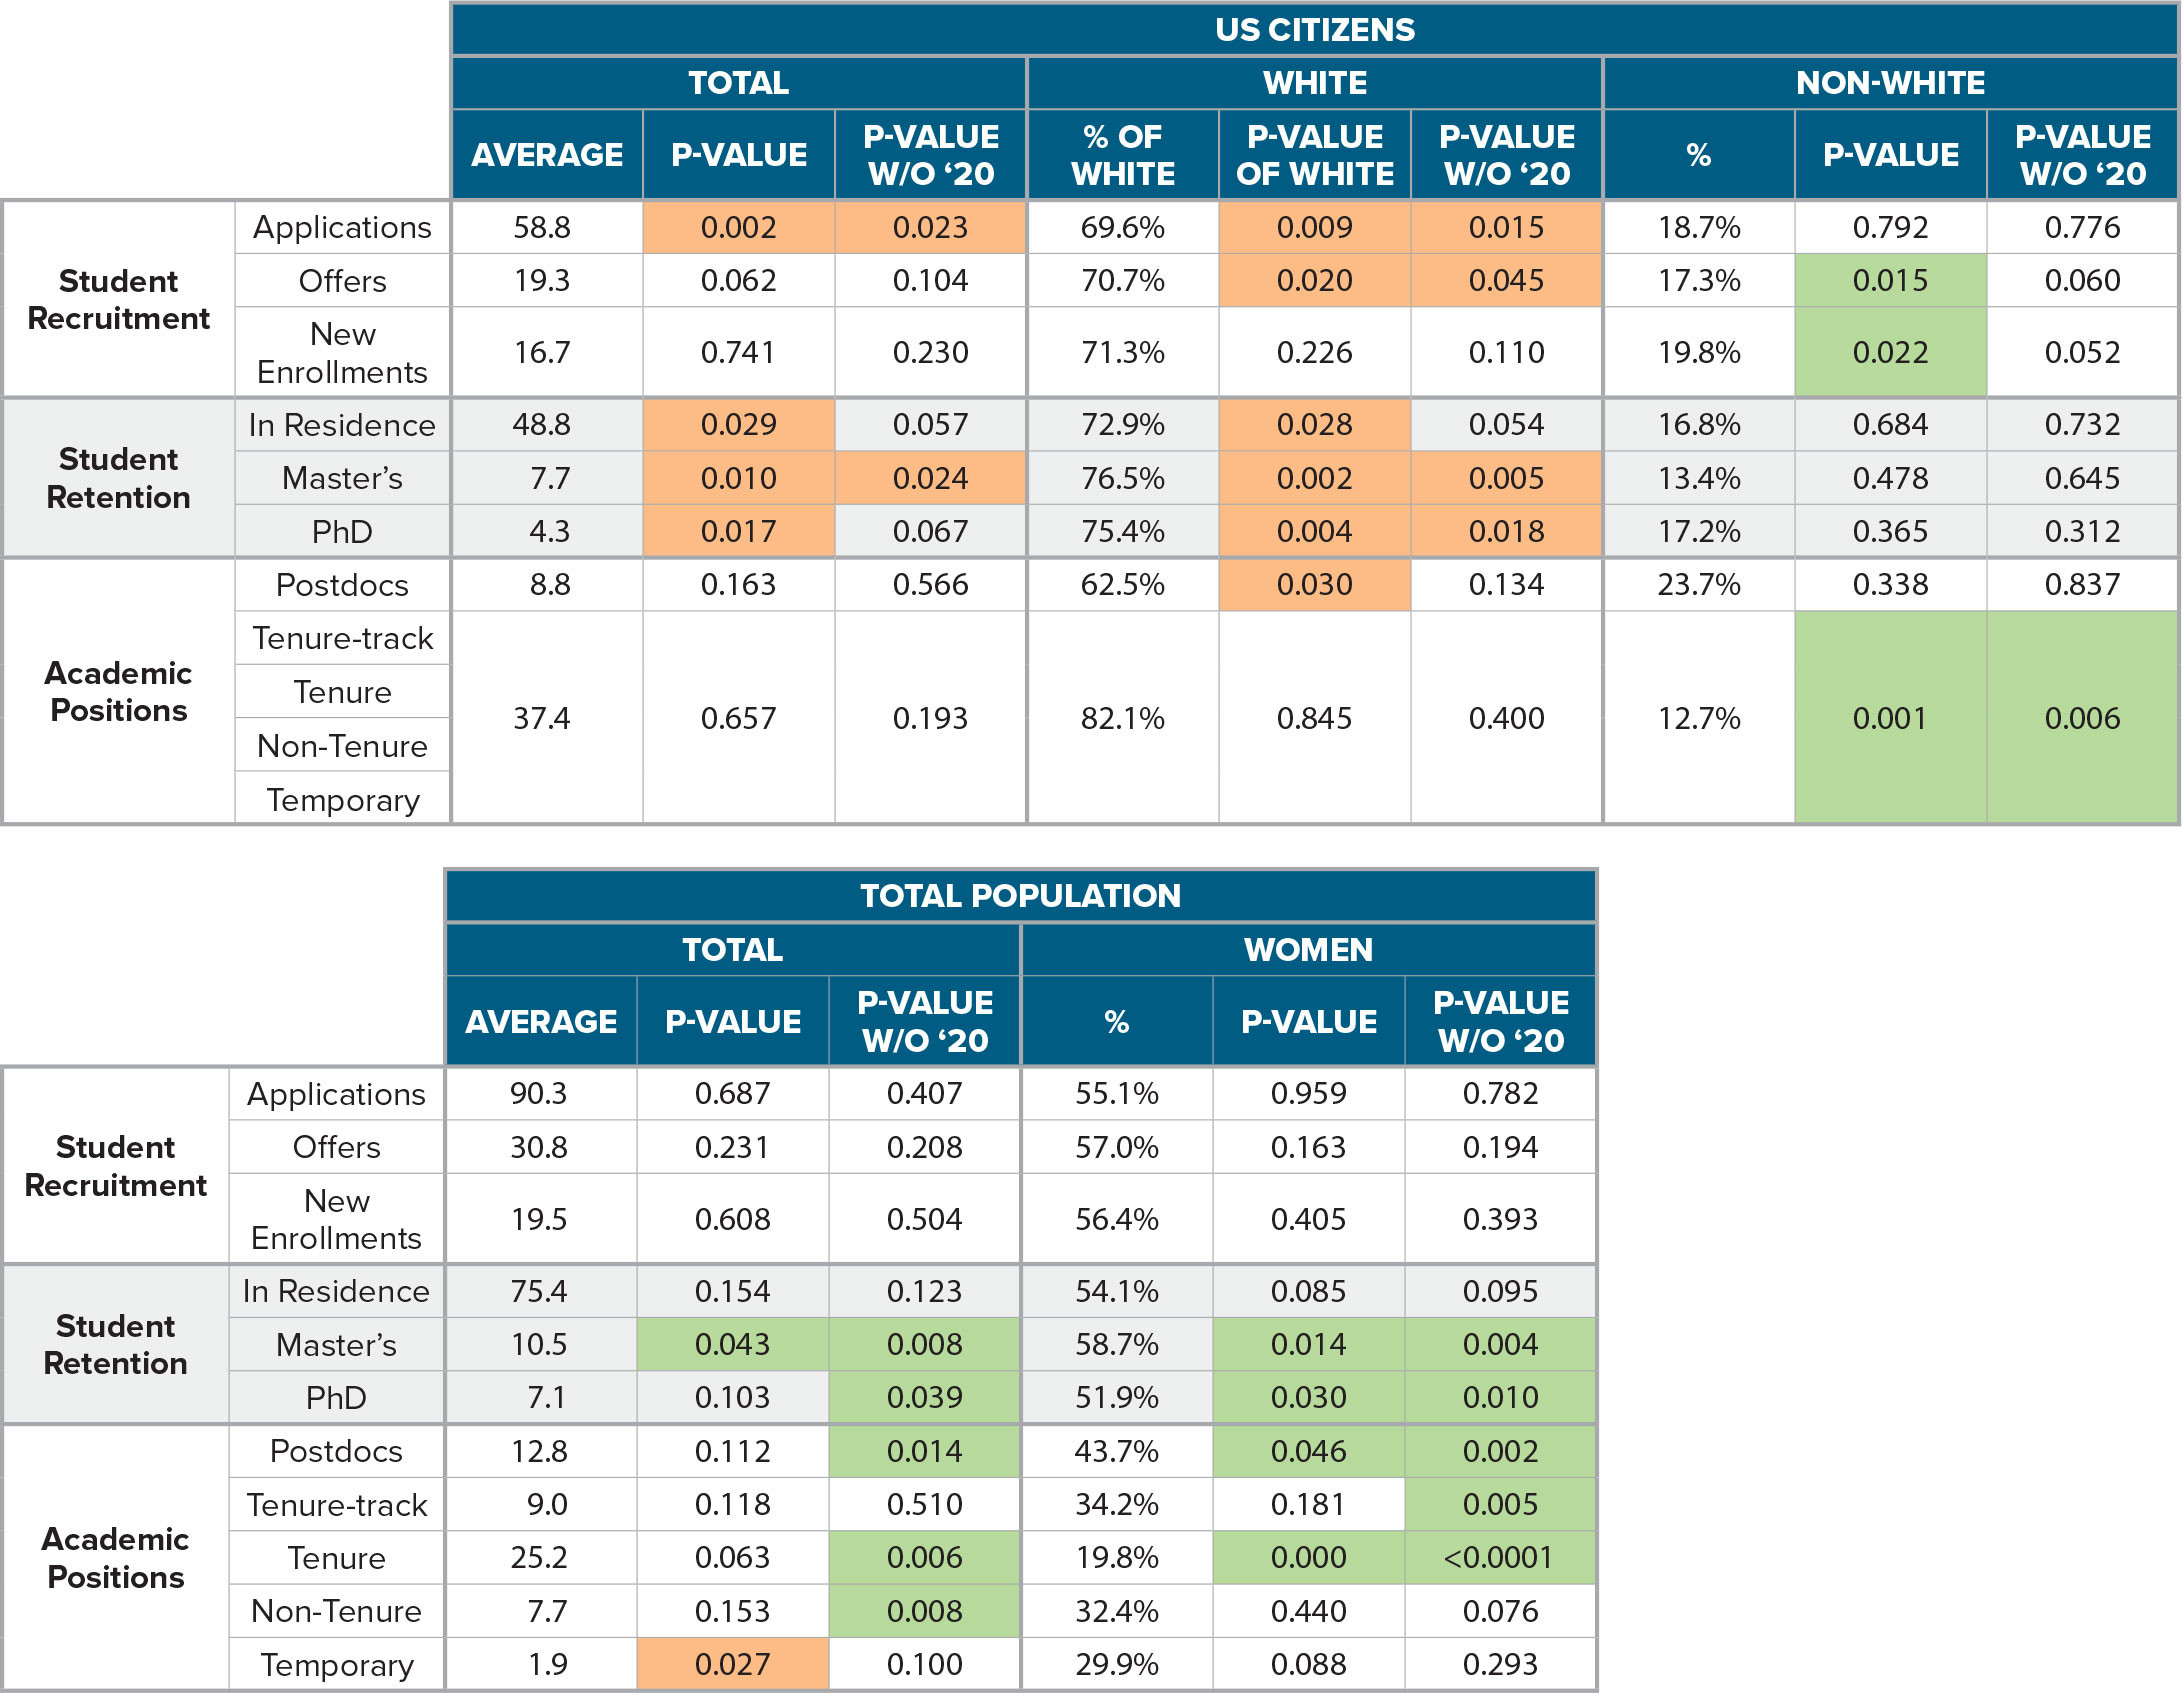
TABLE 1. Graduate student and faculty demographics across racial and gender dimensions for 2007–2021. Total averages, p-values (with and without 2020–2021 data), and percentages for US citizens (total, White, and non-White) and total population (total and women) are shown across the three focal areas. Significant p-values (<0.05) are shaded, with orange indicating a significant downtrend and green indicating uptrend. > High res table
|
NW US citizens made up 18.7% of all student applications (n = 11.0; SD = 1.3), 17.3% of offers sent (n = 3.3; SD = 0.5), and 19.8% of new enrollments (n = 3.3; SD = 1.2) (Tables 1 and S2). Two of the three student recruitment variables had significant uptrends for total NW students: offers (p = 0.015) and new enrollments (p = 0.022) (Table 1, Figures 1a and 2). Neither trend was significant if 2020–2021 data were excluded. The number of White US citizens in student recruitment had a significant downtrend in applications with and without 2020–2021 data (p = 0.009 and p = 0.015) and in offers with and without 2020–2021 data (p = 0.02 and p = 0.045) (Table 1, Figure 1a).
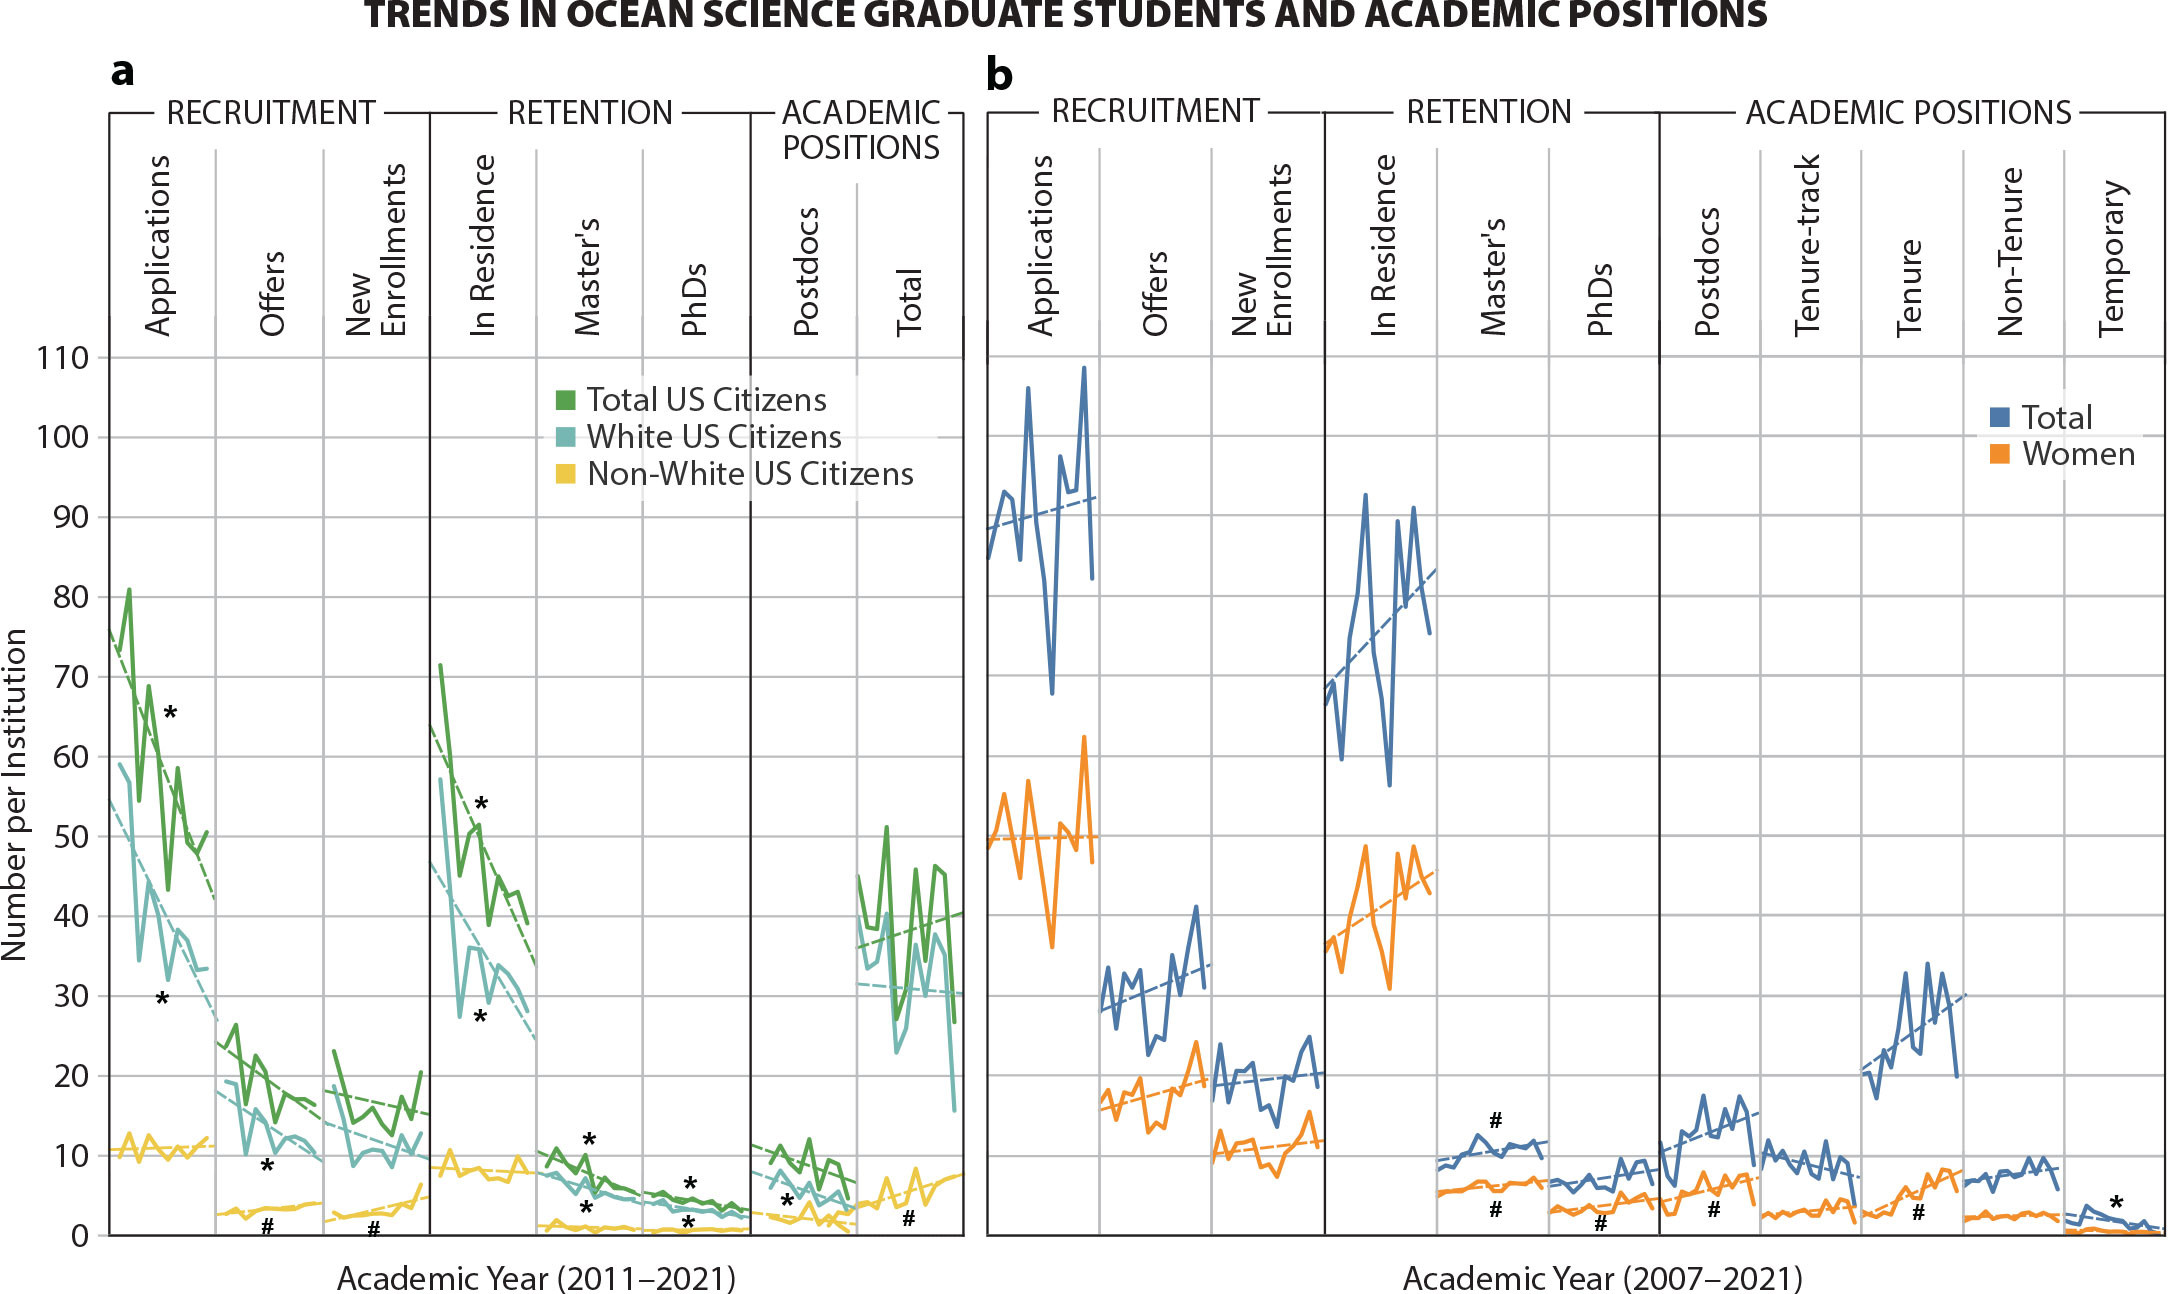
FIGURE 1. Trends are indicated in the three focal areas by (a) total US citizens, White US citizens, and non-White US citizens (2011–2021) and (b) total number and women (2007–2021), with academic positions for total and women divided into five categories. Symbols indicate significant trends: * = downtrend. # = uptrend. > High res figure
|
Asian American and Hispanic/Latino prospective students made up the highest percentages of all racial groups for each category of student recruitment (Figure 2). Of all US citizens, Asian Americans made up 7.2% (n = 4.2) of applicants, and Hispanic/Latino citizens made up 6.4% (n = 3.7) of the total (Figure 2, Table S2). Respectively, these two groups made up 6.0% and 6.1% of offers (n = 1.15 and 1.18, respectively), and 6.4% and 6.3% of new enrollments (n = 1.07 and 1.05, respectively) of US citizens (Figure 2, Table S2). The number of non-Hispanic/Latino (more than one race) students receiving offers (1.9% of total US citizens, n = 0.4) and as new enrollments (2.7%, n = 0.5) were significant uptrends (p = 0.007 and 0.023 without 2020–2021 data; p = 0.017 and <0.0001 without 2020–2021 data; Figure 2, Table S2). Conversely, the number of American Indian/Native Alaskan applicants were a significant downtrend (p = 0.004 and p = 0.016 without 2020–2021 data; Figure 2, Table S2).
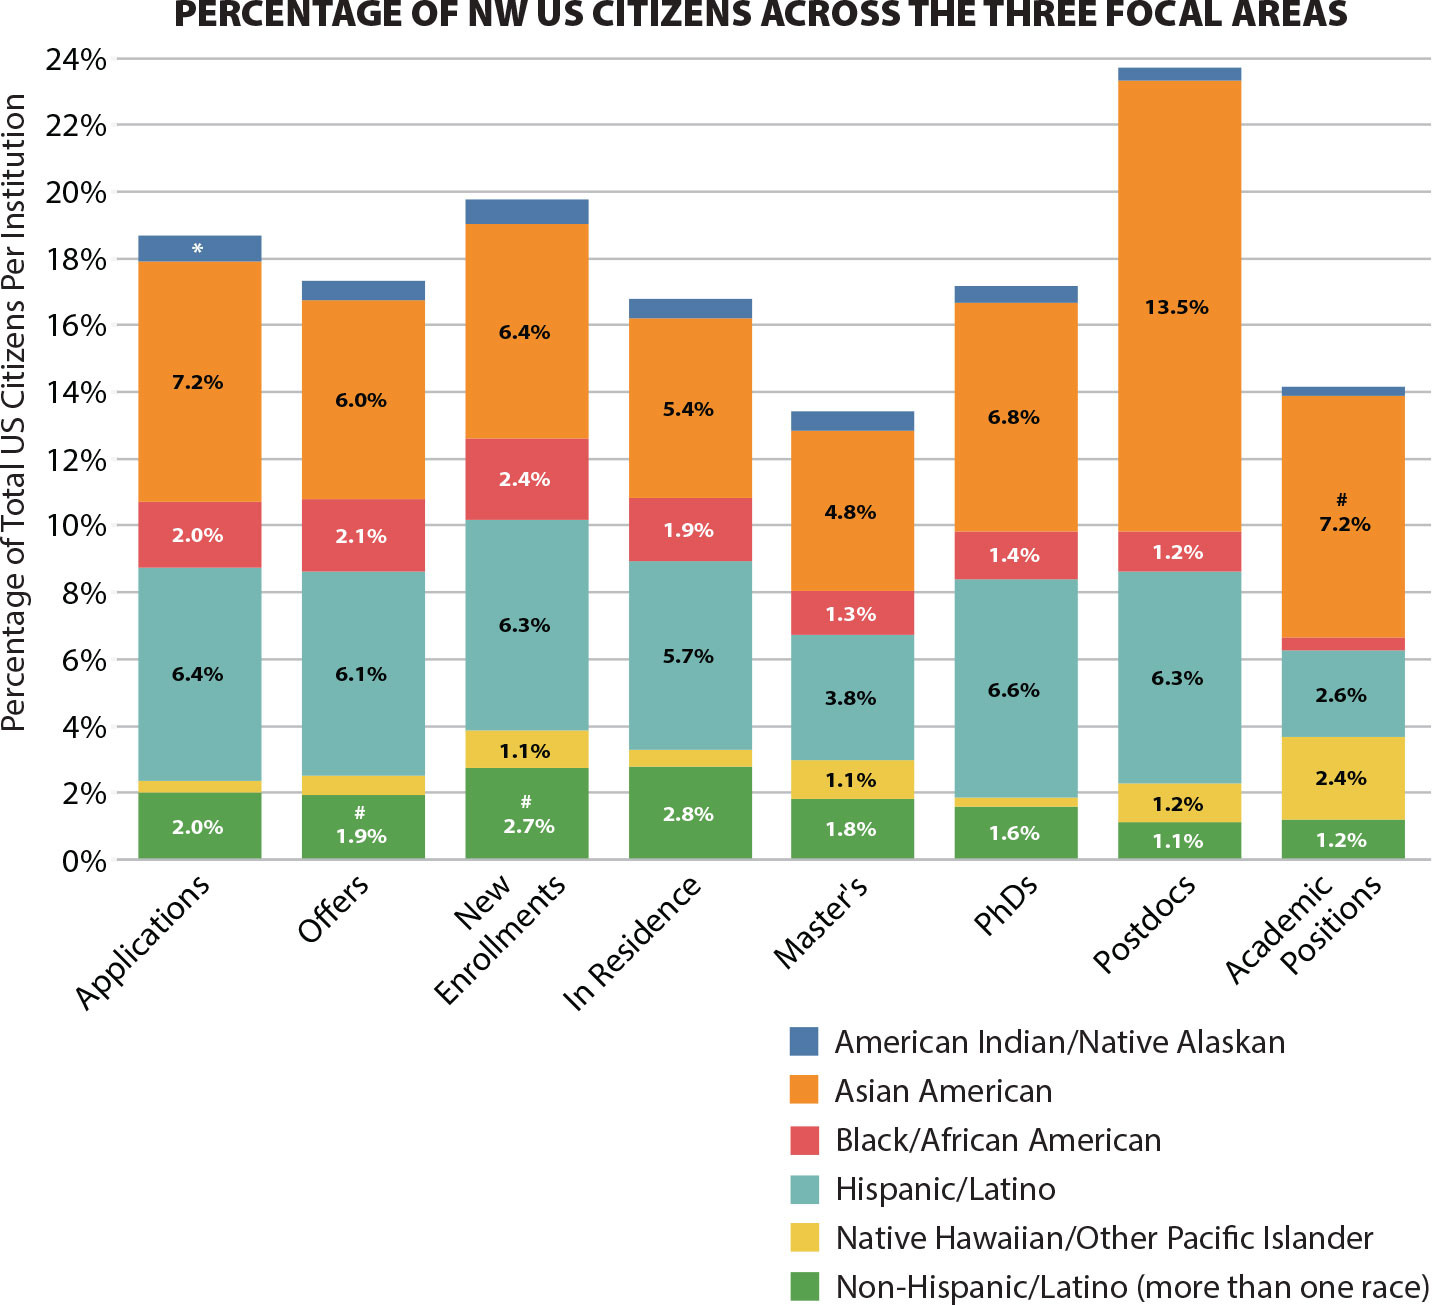
FIGURE 2. Bars show the average percentage of US citizens from the six non-White racial groups across variables of the three focal areas from 2011 to 2021. Symbols indicate significant trends: * = downtrend. # = uptrend. > High res figure
|
Racial Groups by Gender
For student recruitment variables, more NW women than NW men were applicants (n = 13.2 and 6.3), received offers (n = 4.2 and 2.3), and enrolled as new graduate students (n = 3.6 and 2.9) (Figure 3, Table S3). Asian-American women had the highest representation in applications (6.4%, n = 5.1), followed by Hispanic/Latino women (5.3%, n = 4.3) and Hispanic/Latino men (2.8%, n = 2.3) (Figure 3, Table S3). The highest percentage of offers were sent to Hispanic/Latino women (5.6%, n = 1.4), followed by Asian-American women (4.9%, n=1.24) and Hispanic/Latino men (4.7%, n = 1.19) (Figure 3, Table S3). For new enrollments, Non-Hispanic/Latino (more than one race) women and men had the highest percentage (both 5.4%, n = 1.67), followed by Asian-American and Hispanic/Latino women (both 2.5%, n = 0.8) (Figure 3, Table S3).
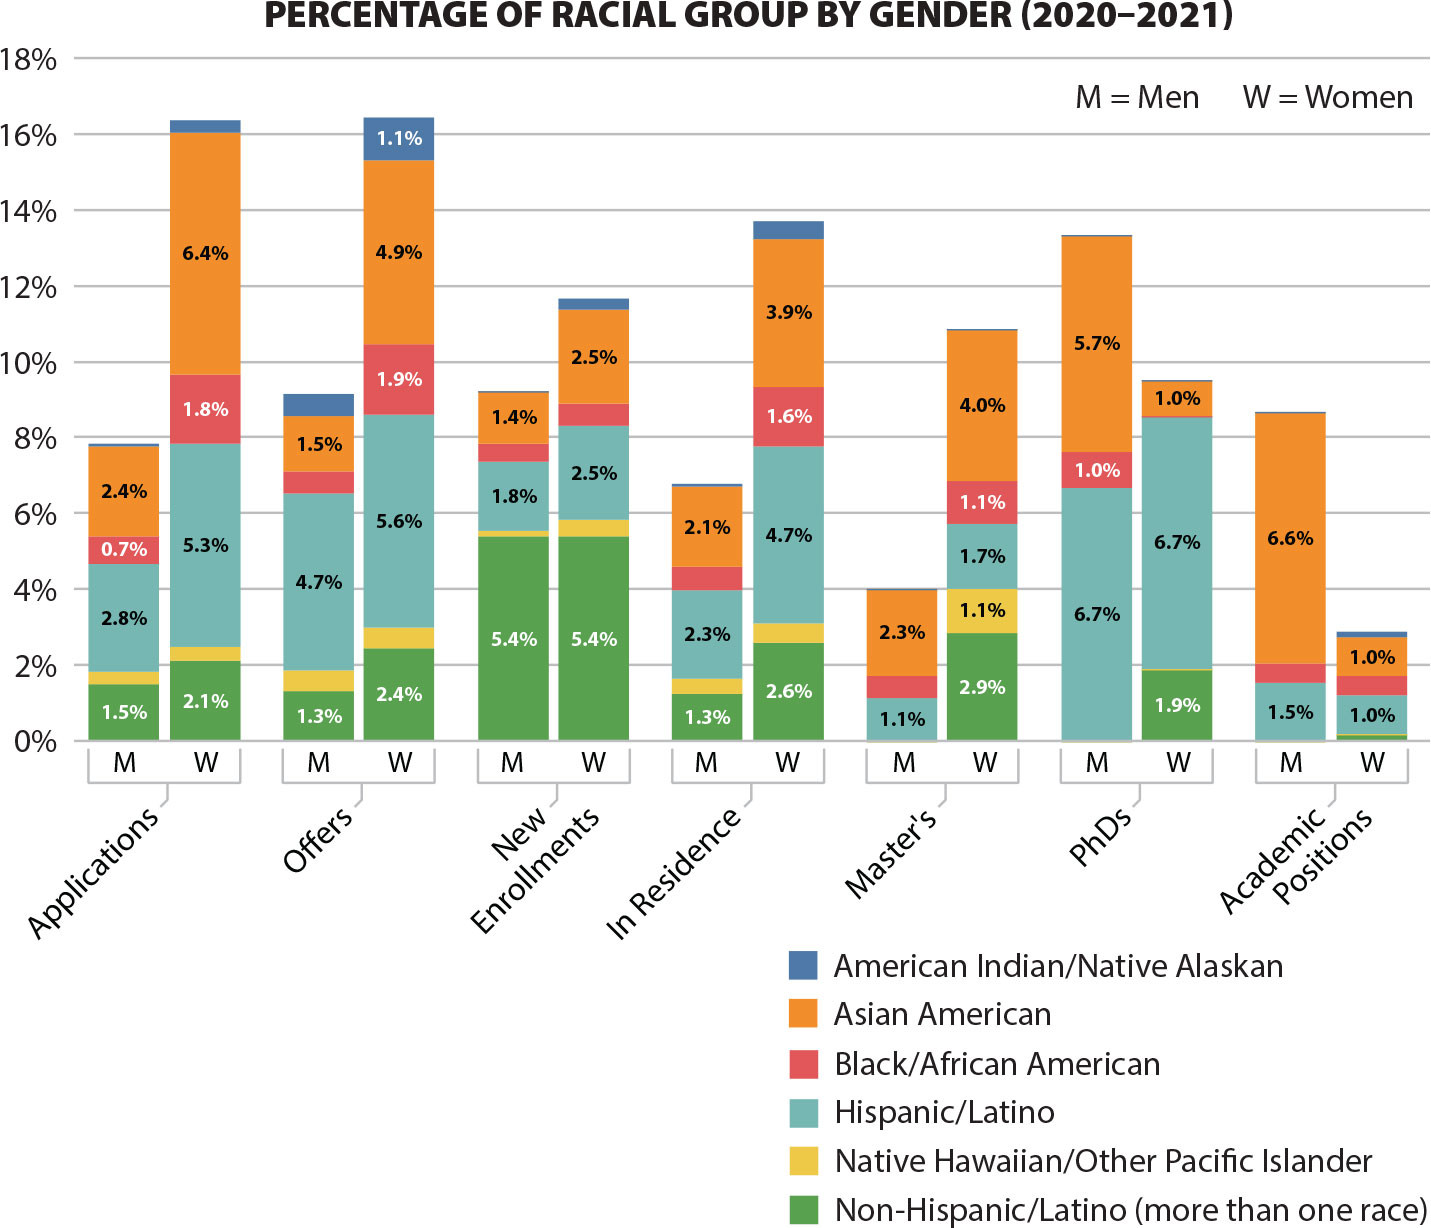
FIGURE 3. The percentage of non-White US citizens are shown by gender across variables of the three focal areas for 2020–2021. > High res figure
|
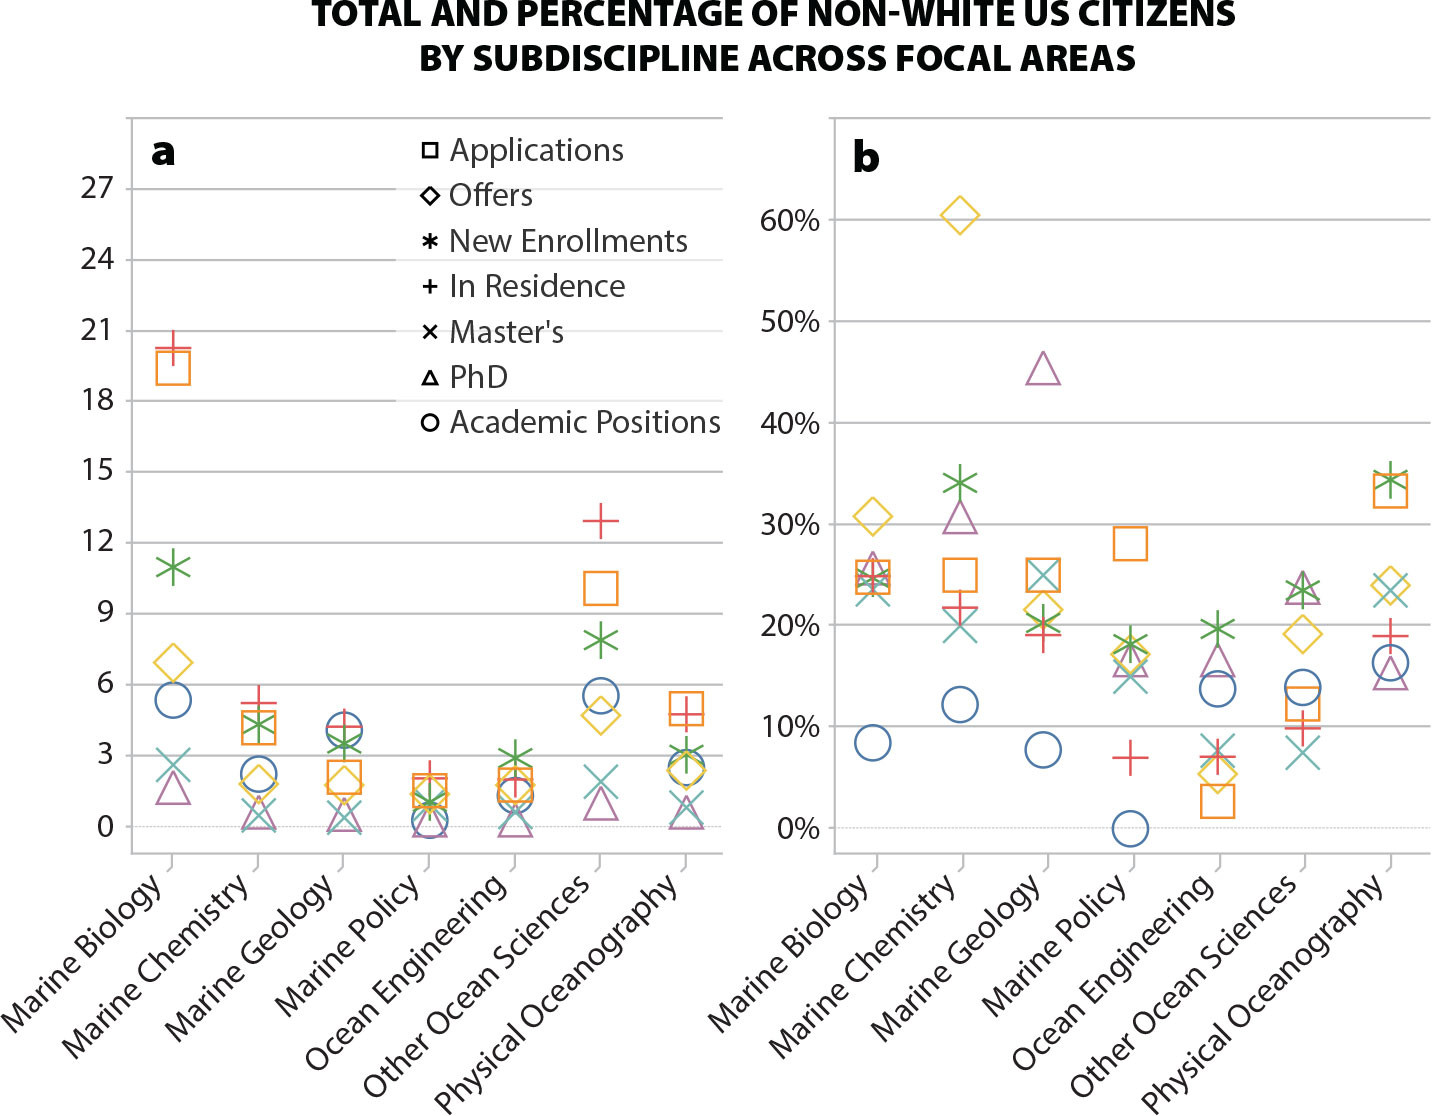
Racial Groups by Subdiscipline
For 2020–2021, marine biology/biological oceanography had the highest number of total US students across applications (n = 19.43), offers (n = 6.95) and new enrollments (n = 11.0), followed by marine policy (28.1%, n = 0.4), and other ocean sciences (n = 10.10, 4.71, and 7.90, respectively) (Figure 4a, Table S4). The highest percentage of NW applicants by subdiscipline was reported for physical oceanography (33.3%, n = 1.7), followed by marine policy (28.1%, n = 0.4), and marine chemistry and marine geology (both 25.0%, n = 1.1 and 0.5) (Figure 4b, Tables S4 and S5). The majority of NW individuals versus White individuals received offers in marine chemistry (60.5%, n = 1.1). The next highest percentage of NW people receiving offers by subdiscipline was in marine biology (30.8%, n = 2.1), physical oceanography (24.0%, n=0.6), and marine geology (21.6%, n = 0.4) (Figure 4b, Tables S4 and S5). Physical oceanography had the highest percentage of new enrollments of NW students by subdiscipline (34.4%, n = 1.1) followed by marine chemistry (34.1%, n = 1.5) and marine biology (24.7%, n = 2.7) (Figure 4b, Tables S4 and S5).
|
Student Retention
For US citizens, from 2011 to 2021, institutions reported an annual average of 48.8 total graduate students (SD = 10.2), 7.7 master’s degrees awarded (SD = 2.0), and 4.3 PhDs awarded (SD = 0.8) (Tables 1 and S6). All three variables had significant downtrends: in residence p = 0.029, master’s p = 0.01, and PhD p = 0.017 (Table 1). The significant downtrend held for master’s (p = 0.024) without 2020–2021 data (Table 1).
Of all US citizens in ocean science graduate programs per institution, 16.7% were of NW races (n = 8.2; SD = 1.3), with 13.4% of master’s degrees (n = 1.0; SD = 0.4) and 17.2% of PhDs awarded (n = 0.7; SD = 0.2) going to students from NW races (Tables 1 and S6). None of the three student retention variables for total NW US students had significant trends (Table 1, Figure 1a). However, the number of White US students had significant downtrends for all three variables (Table 1, Figure 1a): in residence, p = 0.028; master’s degrees, p = 0.002; and PhD degrees, p = 0.004. These downtrends held for master’s degrees (p = 0.005) and PhD degrees (p = 0.018) without 2020–2021 data (Table 1).
When comparing the six NW racial groups, the Asian American and Hispanic/Latino racial groups had the highest representation in all three categories followed by Non-Hispanic/Latino (more than one race) and Black/African American (Figure 2, Table S6). Hispanic/Latino students made up 5.7% (n = 2.8) of total US citizens in residence and Asian Americans were 5.4% (n = 2.6), followed by 2.8% (n = 1.4) Non-Hispanic/Latino (more than one race) students and 1.9% (n = 0.9) Black/African American (Figure 2, Table S6). For master’s degrees awarded, 4.8% (n = 0.4) of total US citizens were Asian American, 3.8% (n = 0.3) were Hispanic/Latino, 1.8% (n = 0.1) were Non-Hispanic/Latino (more than one race), and 1.3% (n = 0.1) were Black/African American (Figure 2, Table S6). Asian Americans and Hispanic/Latino US citizens made up 6.8% and 6.6%, respectively (n = 0.29 and 0.28) of US students receiving PhDs, whereas Non-Hispanic/Latino were 1.6% (n = 0.07) and Black/African American were 1.4% (n = 0.06) (Figure 2, Table S6). None of these trends for student retention by NW groups were significant.
Racial Groups by Gender
When student retention variables were compared by both racial groups and gender, more NW women than NW men were in residence (n = 8.4 and n = 4.2) and received master’s degrees (n = 0.91 and 0.34). More NW men than NW women received PhDs (n = 0.7 and 0.5) (Figure 3, Table S3). Comparing the six NW racial groups of US citizens by gender, the highest representation for in-residence NW students were Hispanic/Latino women (4.7%, n = 2.9), followed by Asian-American women (3.9%, n = 2.4), non-Hispanic women (2.6%, n = 1.6), Hispanic/Latino men (2.3%, n = 1.4), and Asian-American men (2.1%, n = 1.3) (Figure 3, Table S3). For NW master’s degree recipients, Asian-American women had the highest representation (4.0%, n = 0.3), followed by Non-Hispanic/Latino women (2.9%, n = 0.2), Asian-American men (2.3%, n = 0.19), and Hispanic/Latino women (1.7%, n = 0.14) (Figure 3, Table S3). Both women and men identifying as Hispanic/Latino has the highest representation of PhD recipients (6.7%, n = 0.33), followed by Asian-American men (5.7%, n = 0.29) and Non-Hispanic/Latino (more than one race) women (1.9%, n = 1.0) (Figure 3, Table S3).
Racial Groups by Subdiscipline
For 2020–2021, marine biology had the highest number of total US students across in residence (n = 20.3), master’s (n = 2.6), and PhD (n = 1.7), followed by other ocean sciences (n = 13.0, 1.9, and 1.0, respectively) (Figure 4a, Table S4). Marine biology also had the highest percentage of NW graduate students by subdiscipline in residence (24.9%, n = 5.1) (Figure 4b, Tables S4 and S5). Marine chemistry was the subdiscipline with the second highest percentage for in residence (21.8%, n = 1.1) (Figure 4b, Tables S4 and S5). Marine geology had the highest percentage of NW master’s degrees recipients by subdiscipline (25.0%, n = 0.1), followed by marine biology (23.6%, n = 0.6) and physical oceanography (23.5%, n = 0.2) (Figure 4b, Tables S4 and S5). For NW PhD recipients, marine geology had the highest representation by subdiscipline (45.5%, n = 0.24), followed by marine chemistry (30.8%, n = 0.19) and marine biology (25.7%, n = 0.4) (Figure 4b, Tables S4 and S5).
Academic Positions
From 2011 to 2021, an average of 8.8 US citizens held postdoctoral positions (SD = 2.4) and 37.4 were in other academic positions (SD = 9.2), with no significant trends for total US citizens (Tables 1 and S7). For postdoctoral positions, 23.7% of those positions were held by NW US citizens (n = 2.1, SD = 1.0), with Asian-American and Hispanic/Latino citizens having the highest representation (13.5% and 6.3%, respectively) (Tables 1 and S7, Figure 2). There was a significant downtrend in number of White US citizens in postdoctoral positions (p = 0.03), which did not hold if 2020–2021 data were excluded (Table 1, Figure 1a).
On average, 12.7% of academic positions were held by NW US citizens, with a significant uptrend with and without 2020–2021 data (p = 0.001 and 0.006) (Table 1, Figure 1a). Comparing across the NW races, Asian Americans had the highest representation (7.2%, n = 2.7) with a significant uptrend with and without 2020–2021 data (p = 0.033 and 0.007) (Figure 2, Table S7). Hispanic/Latino citizens had the second highest percentage (2.6%, n = 0.98), followed by Native Hawaiians/Other Pacific Islanders at 2.4% (n = 0.92) of total US citizens (Figure 2, Table S7). The number of Non-Hispanic/Latino (more than one race) in academic positions had a significant uptrend without 2020–2021 data (p = 0.027; Table S7).
Racial Groups by Gender
When comparing representation of NW racial groups by gender in 2020–2021, a higher number of men (n = 2.3) held academic positions over women (n = 0.8) (Table S3). Asian American men had the highest representation in academic positions (6.6%, n = 1.8), followed by Hispanic/Latino men (1.5%, n=0.4). Asian American and Hispanic/Latino women had the third highest representation (1.0%, n = 0.3) (Figure 3, Table S3). The same number of Black/African American faculty members were male and female (0.5%, n=0.14) (Figure 3, Table S3).
Racial Groups by Subdiscipline
For 2020–2021, other ocean sciences had the highest total number of academic positions held by US citizens per institution (n = 5.5), with the second highest percentage of NW citizens by subdiscipline in those positions (13.9%, n = 0.8; Figure 4a,b, Tables S4 and S5). Marine biology had the second highest number of total citizens per institution (n = 5.4; Figure 4a, Table S4). Physical oceanography had the highest representation of NW citizens by subdiscipline (16.4%, n=0.4), with ocean engineering having the third highest representation of NW citizens by subdiscipline (13.8%, n = 0.18; Figure 4a,b, Tables S4 and S5).
Gender Trends of Total Population
Student Recruitment
From 2007 to 2021, an average of 90.3 graduate applications were received (SD = 10.3), 30.8 offers were sent (SD = 5.1), and 19.5 new graduate students enrolled (SD = 3.3) per institution per year (Tables 1 and S8). None of these variables had significant trends with and without 2020–2021 data.
Overall, women made up more than 55% of the prospective students in all three categories of student recruitment from 2007 to 2021. Specifically, on average, women made up 55.1% of all graduate school applicants (n = 49.7; SD = 6.3), 57.0% of all graduate school offers (n = 17.5; SD = 3.0), and 56.4% of all new graduate student enrollments (n = 11.0; SD = 2.1) per institution (Tables 1 and S8, Figure 1b). None of these variables had significant trends with and without 2020–2021 data.
Student Retention
From 2007 to 2021, institutions reported an annual average of 75.4 total graduate students (SD=11.1), 10.5 master’s degrees awarded (SD = 1.3), and 7.1 PhDs awarded (SD = 1.4) (Tables 1 and S9). The trend in master’s degrees awarded had a significant uptrend with and without 2020–2021 data (p = 0.043 and p = 0.008) (Table 1, Figure 1b). The trend in PhDs awarded has a significant uptrend when 2020–2021 data were excluded (p = 0.039) (Table 1, Figure 1b).
On average, women represented 54.1% of in-resident graduate students (n = 40.7; SD = 5.9), 58.7% of master’s degree recipients (n = 6.2; SD = 0.7), and 51.9% of PhDs awarded (n = 3.7; SD = 0.9) (Tables 1 and S9). The number of women receiving master’s and PhD degrees had significant uptrends with and without 2020–2021 data (master’s: p = 0.014 and 0.004; PhD: p = 0.03 and 0.01) (Table 1).
Academic Positions
The average number of academic positions per institution were as follows: 25.2 tenured faculty positions (SD = 5.4), 9.0 tenure-track positions (SD = 2.2), 7.7 non-tenure-track positions (SD = 1.3), 1.9 temporary positions (SD = 1.0), and 12.8 postdoctoral positions (SD = 3.4) (Tables 1 and S10). Temporary positions had a significant downward trend (p = 0.027) (Figure 1, Table 1). However, if 2020–2021 data were excluded in the analysis, tenure, non-tenure-track, and postdoctoral positions had significant uptrends (p = 0.006; 0.008; 0.014, respectively) and the downtrend for temporary positions was no longer significant (Tables 1 and S10).
The average number of new positions per year per institution (2012–2021) was as follows: 0.83 new tenured positions (SD =1.5), 1.3 new tenure-track positions (SD = 0.33), 0.61 non-tenure-track positions (SD = 0.70), and 0.30 temporary positions (SD = 0.36) (Tables S10 and S11). New tenure-track positions had a significant uptrend when 2020–2021 data were excluded (p = 0.0001) (Table S11).
The percentage of women in academic positions are as follows: 19.8% of tenure positions; 34.2% of tenure-track positions; 32.4% of non-tenure; 29.9% of temporary positions; and 43.7% of postdoctoral positions (Table 1). Women in tenured positions and in postdoctoral positions had significant uptrends (p = 0.0001 and 0.046, respectively) (Table 1, Figure 1b). These trends held without 2020–2021 data. Women in tenure-track positions had a significant uptrend if the 2020–2021 data were excluded (p = 0.046) (Table 1). Regarding new hires, women made up 52.6% of all new tenure positions, 45.9% of tenure-track positions, 40.7% of non-tenure positions, and 27.5% of temporary positions (Tables S10 and S11). New tenure-track hires for women had a significant uptrend with and without 2020–2021 data (p = 0.046 and 0.008) (Tables S10 and S11).
DEI Initiatives Across Institutions
A majority (69%) of the 18 institutions responding to the 2020–2021 survey had already established DEI programs, action plans, or committees, with 93% anticipating having an established DEI program by the end of the academic year.
The most common activity included in institutions’ DEI programs was student recruitment (91%). New faculty hires were the second most common activity (58%), followed by providing student funding (50%), and providing faculty funding (25%). Over half (58%) of institutions reported “other” DEI policies that were not listed in the survey, such as “develop[ing] rubrics for application review to ensure more equitable, holistic review process” and “increas[ing] communication and promotion with minority serving institutions and through targeted groups, professional organizations, and social media channels.”
Discussion
Trends for Racially Underrepresented Groups
For racially underrepresented groups overall (NW US citizens), there were significant uptrends for both offers and new enrollments (Table 1, Figure 1). However, these positive trends do not hold without 2020–2021 data so that year was significant in this regard, perhaps due to efforts to encourage reporting from more schools and departments within an institution or because extra attention was placed on recruiting from underrepresented groups that year, for example, due to the strength of the Black Lives Matter movement and national attention to social justice. The pandemic also forced virtual recruiting, which has been shown to be beneficial for reaching students, particularly those juggling multiple life responsibilities (RNL & PLEXUSS, 2021). The number of applications from NW US students does not show an increase, which supports intentional focus on offers and enrollment. There is a decline in the numbers of applications from White US individuals, as well as offers. Future data collection and analysis can illuminate whether these racial trends continue.
There continues to be a downtrend for White US students in all three categories of retention (in residence, master’s, and PhD degrees) (Table 1). There are no significant trends in retention for NW US students (Table 1, Figure 1), which indicates that, despite increases in offers and enrollments, we are not graduating more NW US citizens. Most programs aimed at increasing diversity focus on recruitment rather than on retention and support of students (Behl et al., 2021; Moore, 2022), and this was the case, based on responses to the 2020–2021 questions about DEI programs, at OSER institutions. These results support the need for greater attention to providing a welcoming and inclusive culture for students of color in ocean science (Amon et al., 2022). Because overall graduate degrees are increasing, the decreases in White students receiving degrees paired with a lack of trend in NW graduate degree recipients suggests overall fewer US citizens are receiving ocean science graduate degrees (racial data are only reported for US citizens). This will require further monitoring and, if true, the community should prioritize reversing this trend.
Looking at all academic positions together, there is an upward trend for NW faculty (US citizens; Table 1, Figure 1). The OSER data do not have the granularity to assess what this looks like at each position type nor for new hires, so it is difficult to draw conclusions about how this finding pairs with the lack of any increase in NW student retention. Future studies should consider this question.
Asian Americans make up the largest percentage of applications (7.2%), enrollments (6.4%), master’s degrees (4.8%), PhDs (6.8%), and postdoctoral positions (13.5%) and the second largest percentage of offers (6.0%) and in-residence graduate students (5.4%) (Figure 2). This is relatively well aligned with their representation in the US population (5.9%; 2020 Decennial Census Data), though notably their representation in postdoctoral (13.5%) and academic positions (7.2%) are disproportionately high and trending upward for academic positions (Figure 2, Table S7). Hispanic/Latino individuals represent the second largest group by percentage of applications (6.4%), enrollments (6.3%), master’s degrees (3.8%), PhDs (6.6%), and academic positions (2.6%) and make up the largest percentage of offers (6.1%) and in-residence graduate students (5.7%) (Figure 2). This is not aligned with their representation in the US population (18.7%; 2020 Decennial Census Data). On average across all three recruitment categories, Black/African American students represent between 2.0% and 2.4% (Figure 2), compared with 12.1% of the US population (2020 Decennial Census Data). Notably, representation of Black/African American individuals in academic positions drops to 0.4% (Figure 2). American Indian/Alaska Native and Native Hawaiian/Pacific Islander students each make up ~1% across most recruitment and retention variables (Figure 2), which is similar to their representation in the US population (0.7 and 0.2, respectively; 2020 Decennial Census Data). However, Native Hawaiians/Pacific Islanders represent 2.4% of academic positions, significantly above their relative US representation. There appears to be an uptrend in offers and enrollments for students of more than one race (non-Hispanic/Latino), and there appears to be a downtrend in applications from American Indian/Native Alaskan students (Figure 2). It should be noted, though, that the numbers reported across most NW racial groups are small, making meaningful statistical analysis challenging. Future studies should examine whether these trends are real.
While there are some positive indicators (recruitment, faculty) for increasing diversity in the ocean sciences, including that 23.7% of postdoctoral positions are held by NW citizens, the average percentage of NW students at any of these levels does not exceed 20%, though 2020–2021 saw the highest percentage (not necessarily indicating a significant trend) of NW individuals for applications (24.3%), offers (25.0%), enrollment (31.5%), PhD degrees (23.6%), and academic positions (27.9%) (Table S14). Racially underrepresented groups (NW, including more than one race) comprise 42.2% of the US population (2020 Decennial Census Data); therefore, they remain underrepresented in ocean science overall. Some groups (Hispanic/Latino and Black/African American) are significantly underrepresented, while the representation of others (Asian, American Indian/Native Alaskan, Native Hawaiian/Pacific Islander) is more closely aligned with their relative representation in the US population and, for Native Hawaiian/Pacific Islanders, in some cases (PhDs, academic positions) have even higher representation, based on these data.
Trends for Total Population in Ocean Science
Overall, for ocean science, no growth was found in student recruitment for total and women populations (Table 1). It is disappointing that interest in the field as a whole appears not to have grown over the last 10–15 years, given the pressing global needs (e.g., climate change, food security, sustainable development) that ocean science supports and the efforts that have been made to increase diversity. For retention variables, master’s degrees awarded showed the only significant trend (upward; Table 1). However, we do see an uptrend in PhDs awarded when excluding the 2020–2021 data. Because the 2020–2021 academic year may be generally anomalous given the global pandemic, future studies should look at whether an upward trend in PhD awards continues.
Excluding 2020–2021 data also resulted in upward trends for some academic positions, including postdoctoral, tenure, and non-tenure-track positions (Table 1). We see a downtrend in temporary positions, except when excluding 2020–2021, which could indicate temporary positions being used to fill vacancies in permanent positions during that year. Assuming anomalous data due to the pandemic, the uptrends at the faculty level could be promising signals of job growth for permanent positions following reports of low academic job availability earlier last decade (O’Connell, 2014), though we do not see upward trends in new hires, except for tenure-track when excluding 2020–2021 (Table S4). While we may not be recruiting more students into the field, it appears we are graduating more students and placing them in academic positions.
Women
Women represent the majority (>55%) across student recruitment variables (Table 1). The percentage of women receiving offers (57.0%) and enrolling (56.4%) are both higher than the percentage of women applying (55.1%), suggesting that a greater number of women applicants are accepted than men (Table 1). None of these variables show any significant trend, however, indicating this has been the case since 2007. Women maintain this majority through receiving their degrees; they made up 54.1% of in-residence graduate students, 58.7% of master’s recipients, and 51.9% of PhD recipients (Table 1). Degrees awarded to women (both master’s and PhD) show a positive trend. Beyond degree, however, looking at faculty levels we continue to see a decline with seniority reported by earlier publications (e.g., O’Connell, 2014; Orcutt and Cetinić, 2014). On average over 2007–2021, women held 43.7% of postdoctoral positions, 34.2% of tenure-track positions, and only 19.8% of tenure positions (Table 1). However, all three of these categories show uptrends (for tenure-track only when excluding 2020–2021 data), and the recent percentages are much higher (44.7% postdocs, 45.2% tenure-track, and 28.3% tenure in 2020–2021). New tenure-track hires of women are also increasing (Table S11), and the percentages of new female hires for both tenure (52.6%) and tenure-track positions (45.9%) are higher than the percentage of women already in those positions (Table S11). If trends continue, this is promising for eventually reaching parity in ocean science leadership; we are close to reaching parity at postdoc and tenure-track levels.
Intersectionality
As data for US citizens combining gender and race was collected only for 2020–2021, we can only establish a baseline for monitoring trends. The initial data reported for retention of NW women across career stages follows a similar trend to the retention of all women across career stages—the numbers of NW women applying, receiving offers, enrolling, and in residence are greater than those of NW men; however, there are a greater number of NW men than NW women holding academic positions.
Subdisciplines
With one year of data collection on subdiscipline data for US citizens, no significant trends can be assessed. However, it is worth noting that the highest percentages of NW citizens across the focal areas (marine biology, other ocean sciences) are mostly in the same subdisciplines with the highest representation of women (Tables S4 and S12), suggesting these subdisciplines may be developing more diverse cohorts of students and faculty than other subdisciplines.
COVID-19 and Other Potential Anomalies in the 2020–2021 Data
The pandemic had wide-ranging impacts on individuals and universities, and the data may show a signal of this given that 2020–2021 represented the lowest—and largest single year drop in—numbers of faculty positions (excluding temporary) (Figure 1). Without the 2020–2021 data, there were significant upward trends for tenure, non-tenure-track, and postdoctoral positions (Table 1), so it will be interesting for future studies to examine whether an upward trend holds or recovers. The downtrend in temporary positions does not hold when removing 2020–2021 data, but this may be more easily explained by the increased numbers of reporting schools/departments than a COVID-19 impact. Excluding 2020–2021 data, there is an upward trend in tenure-track hires, which may indicate a pause during the pandemic but we do not see the same signal in new hires of other positions.
We see an uptrend in overall PhD awards when excluding 2020–2021 data (Table 1). This may indicate tenure-clock stops or other delays in completion timelines due to restricted access to labs, fieldwork, and university space during the pandemic. There is no longer an in-residence downtrend for White graduate students when excluding 2020–2021, which may support that disproportionately more White students were able to delay completion. The uptrends for NW offers and enrollment disappear without 2020–2021 data (Table 1). Within the racially underrepresented group section, we discuss the potential reason for offers being high enough in 2020–2021 to impact the trend, and this may also therefore result in relatively high enrollments. However, we might expect to see the opposite given the pandemic was shown to disproportionately impact individuals of color (NASEM, 2021).
We cannot draw conclusions about whether these apparent anomalies are just that or are more disruptive to overall trends. These data provide a baseline for comparison with future studies to answer these questions.
Next Steps and the Future of OSER Data
Based on our findings and the gaps in OSER data, we make the following recommendations to the community for future demographic study:
- Greater granularity is needed in the racial data, which should always be disaggregated to analyze data for each NW racial group. Note that the OSER survey evolved over time to collect very granular data related to the participation of women, including at individual subdisciplinary and academic position types, as well as new hires at each position.
- Specific data on non-US citizens should be collected to track trends as they relate to total population trends and the extent to which these individuals trained within the United States are retained by US institutions.
- Data collection and analysis should be continued in order to understand intersectionality. For the first time in OSER history, the 2020–2021 survey collected intersectionality data, which provides a one-year snapshot against which to assess change or trends.
- Continue collecting institutional information:
- Information about DEI initiatives at ocean science programs and institutions can support comparison against future changes in demographic trends.
- OSER data reflected somewhat inconsistent reporting by individual institutions, and the presence or absence of one or more large programs can impact the annual data. Consistent reporting and information about the size of programs reporting will improve analysis.
- Future studies should consider the potential COVID-19 signals in the 2020–2021 OSER data and monitor for short- and long-term impacts of the pandemic on academic ocean sciences.
- The next iteration of OSER should engage ocean-focused social scientists throughout the process to continue and bolster this work. OSER surveys, while valuable, were an unfunded activity, which limited what we were able to do in terms of survey design and analysis; an ocean-focused social scientist joined the efforts only in the last year of survey design.
- An ocean science community leader should be identified to continue community-wide demographic data collection with these recommendations in mind.
Conclusion
Overall representation of NW individuals in ocean science is low compared to the US population, and this is particularly true for Black/African American and Hispanic/Latino citizens. Furthermore, uptrends in offers and new enrollments for NW US citizens means more diverse graduate student cohorts, but the lack of similar uptrends in graduating NW students suggests more efforts are needed to support these students as they complete their degrees. An additional concern related to US citizen data is the possible decline in US citizens receiving ocean sciences graduate degrees, which will require further monitoring. There is an upward trend in total academic positions being held by NW individuals, but more granularity in racial data by position is needed.
The representation of women in academic positions is increasing, though fewer than 50% of all categories of academic positions are held by women as of the 2020–2021 year. Women make up more than 50% across recruitment areas with no notable trends; however, the percentage of women receiving both master’s and PhD degrees (both already above 50%) is increasing. These are promising findings with respect to increasing participation of women at senior academic career levels, but efforts to support and retain women moving into permanent academic positions must continue.
Since COL’s dissolution in 2022, the OSER data collection has stopped, and the continuity of this valuable data set is at risk. As former employees of the Consortium for Ocean Leadership, the coauthors are temporary custodians of the data set, and a new “archival home” needs to be identified. Furthermore, we encourage the community to continue collecting these important data toward sustaining and supporting a diverse ocean science research and education enterprise in the United States.
Acknowledgments
We would like to thank the members of the former Consortium for Ocean Leadership who completed the annual OSER surveys over many years and made this data collection possible. We also thank the participants of the 2020 OSER workshop who informed our most recent OSER survey changes and data collection. The workshop and development of this publication were supported by the National Science Foundation Division of Ocean Sciences award 1941407.