INTRODUCTION
Western boundary currents (WBCs) are crucial components of the global ocean circulation, responsible for transporting water (momentum), heat, and nutrients from the tropics to higher latitudes. They play a vital role in regulating regional weather and global climate patterns. The world’s five major WBCs: the Gulf Stream (GS), the Kuroshio Current (KC), the East Australian Current (EAC), the Brazil Current (BC), and the Agulhas Current (AC) exhibit distinct characteristics influenced by a variety of processes, including large velocity and temperature gradients, variable wind stress, topographic steering, high oceanic heat content, intrinsic variability, and large-scale climate variability. These ocean regions are also undergoing rapid environmental change, for example, warming at above-average rates. Combined, these elements make it essential to measure, observe, and predict WBCs. Therefore, understanding their short-term and long-term variability and their drivers is fundamental. However, observation and prediction in these regions is challenging, and efforts internationally are not coherent. Here, we provide an overview of some of the main WBC characteristics and pose dynamically driven suggestions for observation priorities.
MEAN STATE AND DRIVERS OF FIVE MAJOR WBCs IN THE GLOBAL OCEAN
Velocities and volume transport vary considerably across the five WBCs, ranging from approximately 1.3 to 150 Sv (1 Sv = 106 m3 s−1; Imawaki et al., 2013; Table 1). The GS, one of the most extensively studied WBCs, has a maximum surface velocity of 2.5 m s–1 (Wei et al., 2008) and a volume transport of 18.9–150 Sv (Imawaki et al., 2013). The KC in the North Pacific shows similar strength, with maximum velocities reaching 2 m s–1 (Nagai et al., 2019) and a volume transport of 21.5–130 Sv from a lowered acoustic Doppler current profiler survey conducted across the Kuroshio Extension southeast of Japan (Imawaki et al., 2013). The AC in the Indian Ocean is slightly weaker, with peak velocities of 1.5–2 m s–1 and a mean transport of 84 ± 24 Sv (Beal and Elipot, 2016) based on a three-year time series of moored observations. Its mean transport is 70 Sv at 32°S, making it the strongest WBC in either hemisphere at this latitude (Imawaki et al., 2013). The BC in the South Atlantic is comparatively weaker, with maximum velocities of 1.1 m s–1 (Biló et al., 2014) and a transport of 1.3–30.9 Sv (Schmid et al., 2018). The EAC, while less powerful than its northern counterparts, still exhibits significant flow, with surface velocities up to 2 m s–1. From a ~10-year moored time series, Sloyan et al. (2024) found a maximum southward transport of approximately 60 Sv, with periods of net northward transport (maximum of 20 Sv) and a calculated mean of 18 Sv (from 0–1,500 m depth at 28°S). Chandler et al. (2022) made estimates of transport across three of the WBCs (AC, KC, and EAC) using a consistent methodology that combined several observation types, allowing direct comparison of the transports in the systems; however, the latitudes of the observations were not consistent, and estimates were not made for the BC or the GS.
TABLE 1. Characteristics of the five major subtropical western boundary currents in the global ocean (where negative transport is southward). > High res table
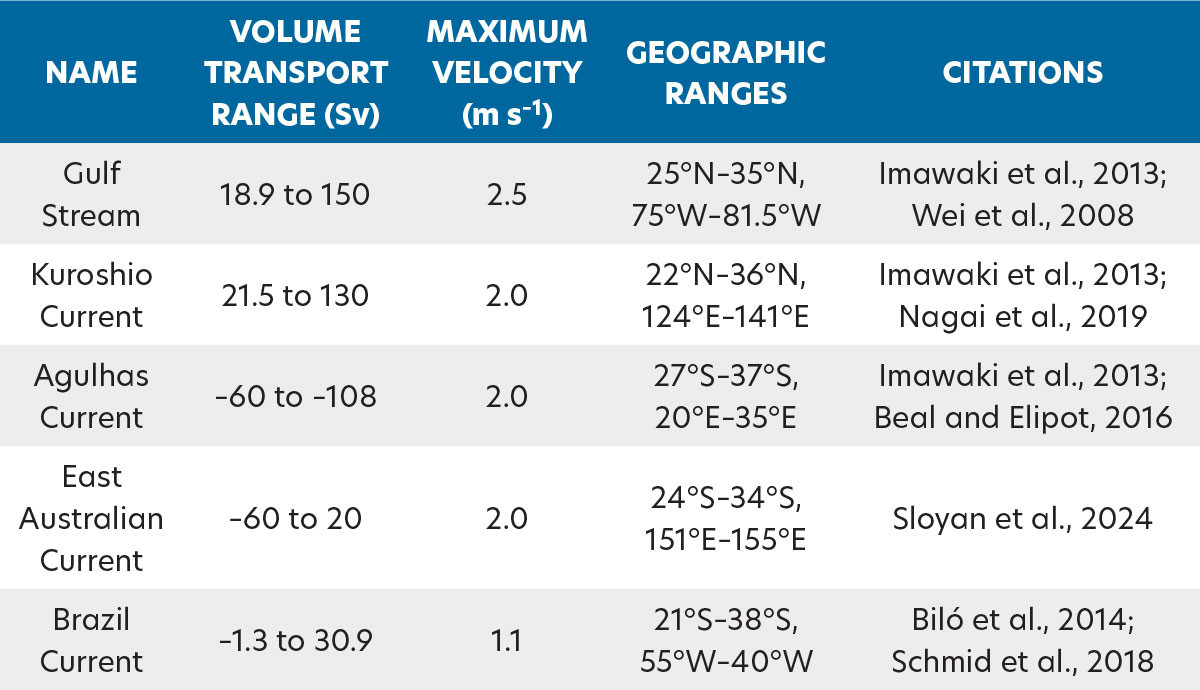
|
These currents are also highly variable. Fluctuations driven by meandering of the currents, the formation and shedding of mesoscale eddies, and variability in local and remote wind forcing result in changes in transport of up to 20%–30% over short periods. On longer timescales, they are driven by seasonally driven shifts and decadal oscillations often influenced by large-scale climate patterns and wind stress variations over their respective ocean basins.
The KC and the GS are deep reaching, with strong velocities (0.3 m s–1) down to at least 1,000 m depth. The EAC is generally considered the shallowest of the WBCs, extending to about 1,200 m depth at 28°S, with a core at ~400 m. The BC is also generally shallower than its Northern Hemisphere counterparts, typically extending to depths of 500–1,000 m. The AC extends to depths of 1,500 m and has a more complex vertical structure with a distinct undercurrent (Imawaki et al., 2013). Vertical and horizontal velocity shear is greatest on the coastal (cyclonic) side of the jets, which are the core of the WBCs, accompanying a strong sea surface temperature (SST) gradient. These strong, variable, and deep currents make them inherently difficult to observe.
Temperature gradients (Figure 1b–f) are largest in the WBC extension regions, but they are weak within the jets themselves. Temperature gradients reach a maximum of up to 0.1°C per km in the GS extension region (north of the GS proper) and in the AC extension region (south of the AC).
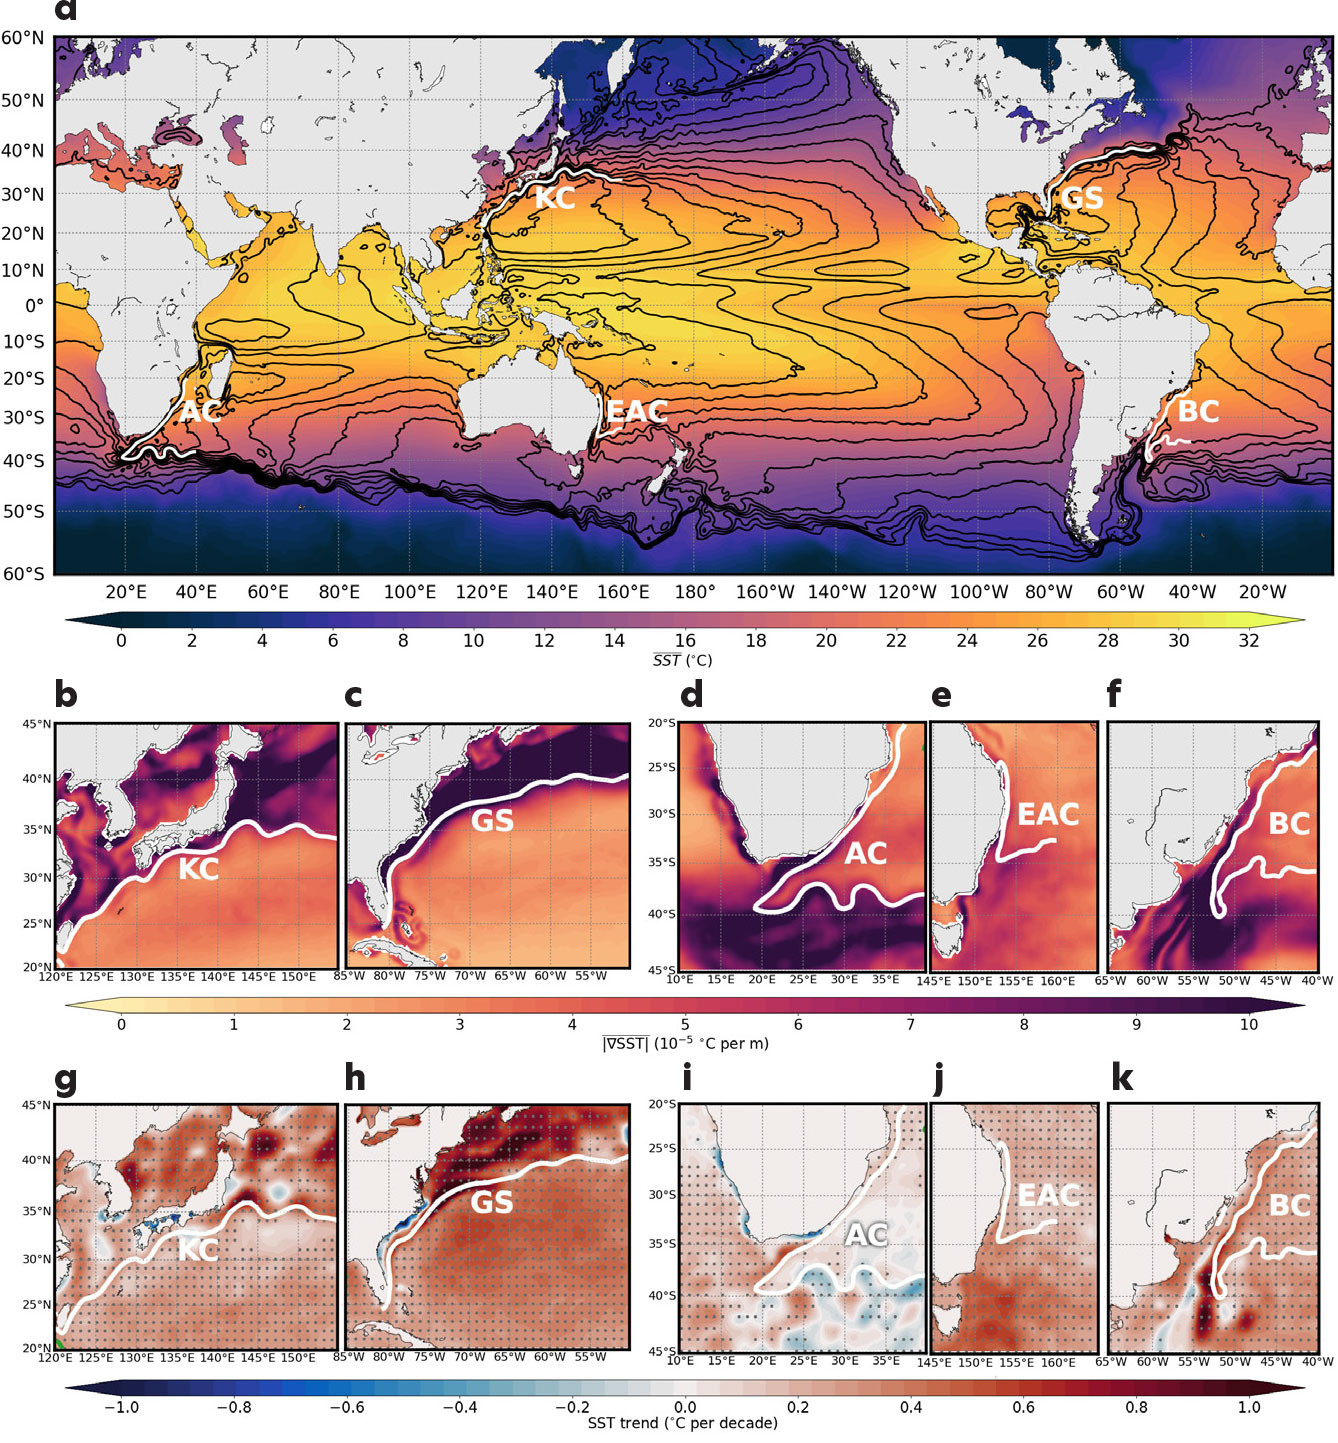
FIGURE 1. Spatial distributions of (a) mean sea surface temperature (SST), (b–f) mean SST gradients, and (g–k) SST trends from Optimum Interpolation Sea Surface Temperature (OISST) observations from satellites, ships, buoys, and Argo floats between 1993 and 2020. The black contours in (a) indicate the climatological mean sea surface height from AVISO satellite observations between 1993 and 2020. The white lines in (a–k) illustrate the paths of the global ocean’s five major western boundary currents. The gray stippling in (g–k) indicates that the trends are statistically significant above the 95% confidence level. KC = Kuroshio Current. GS = Gulf Stream. AC = Agulhas Current. EAC = East Australian Current. BC = Brazil Current. > High res figure
|
Broader climatic patterns such as the Pacific Decadal Oscillation, the North Atlantic Oscillation, and the El Niño-Southern Oscillation influence long-term variability in the Northern Hemisphere WBCs. Additionally, recent observations indicate that for some WBCs, like the AC, there have been increases in width (eddying) without significant strengthening (Beal and Elipot, 2016) or shifting (Li et al., 2022), while others, such as the EAC and the BC, have shown a poleward shift and intensification in response to global climate change (Yang et al., 2016). The Global eXpendable BathyThermograph (XBT) program has observed the northward shift of the GS since the early 1990s (Andres et al., 2025, in this issue) and the BC’s structure and variability over the period of 2004–2023 (Ferreira et al., 2025, in this issue). The dynamic variations documented highlight the complex interplay among these powerful currents and the evolving climate system.
OCEAN HEAT TRANSPORT, TEMPERATURE VARIABILITY, AND TRENDS
WBCs transport warm tropical water poleward along the western boundaries of each ocean basin. Warm mesoscale eddies shed from the WBCs also advect heat as the eddies propagate. WBCs are easily observed from space in satellite SST data, and their poleward extensions are readily monitored by observations of warm water intrusions. Temperatures vary seasonally due to warming at the upstream (equatorward) origins of WBCs (Figure 1a) and cooling through loss of heat to the atmosphere along their poleward transits. Temperature gradients across WBC fronts can be large (Figure 1b–f) and contribute to the generation of instabilities as the WBCs extend poleward. In the EAC, temperature gradients can be up to 0.07°C per km, with much larger temperature gradients (>0.1°C per km) in the other WBC extension regions (Figure 1b–f).
Marine heatwaves (extremely high temperatures) are readily calculated and quantified using satellite data due to the 30-year record and broad spatial coverage; however, satellite observations do not provide the subsurface structures of marine heatwaves in WBC regions, which are often related to the advection of heat in eddies. Recent mooring observations in the KC and Mindanao Current region (Hu et al., 2020) and the EAC (Sloyan et al., 2016) indicate the complexity of vertical structures of the currents. Additionally, models driven by sparse observations tend to poorly represent the subsurface structures of the WBCs and mesoscale and submesoscale eddies. Hence, it is essential that we measure vertical temperature structure throughout the water column, including the mixed layer depth, the thermocline, and the full-depth structure in WBC regions. This also has implications for estimates of upper ocean heat content, which are fundamental for both short- and long-term weather and climate prediction.
WBC extension regions are global ocean warming hotspots (Figure 1g–k), with the surface ocean warming over the paths of WBCs and their extension regions two to three times faster than the global mean (Wu et al., 2012), along with increased poleward penetration of heat in the EAC, BC, KC, and GS. This is further motivation to measure and monitor heat content in WBCs below the surface.
Additionally, due to global warming, the major subtropical ocean gyres have consistently shifted poleward over recent decades. The WBCs (except the GS) are not only shifting poleward but are also intensifying (Yang et al., 2016), with more warm waters being transported into the WBC extension regions. The barotropic and baroclinic instabilities that generate eddies (see below) in the WBC regions are also increasing (Li et al., 2022), and eddy-rich regions are forming even more eddies and getting warmer (Martínez-Moreno et al., 2021). Hence, it is essential that we monitor and observe effectively below the surface in these eddy-rich regions to understand the full extent of the impacts of ocean warming and environmental change.
EDDY FIELDS IN THE FIVE WBCs
Mesoscale eddies (large rotating bodies of water, with diameters ranging from tens to hundreds of kilometers) are important features in all the WBCs and play a crucial role in their dynamics by influencing heat transport, nutrient distribution, and mixing processes. The eddy fields associated with WBCs are characterized by high variability and are influenced by factors such as ocean topography, local and remote wind patterns, and large-scale ocean circulation.
Eddies can form through WBC meanders that pinch off from the WBCs themselves (also known as warm core rings) but also from instabilities that propagate across the ocean basins. Eddies are essential for the transport of heat and nutrients and play a key role in modulating the strength and variability of the WBC jets themselves, as well as having an influence on regional climate and marine ecosystems.
Compared to short-lived eddies, long-lived eddies have larger diameters and higher impacts on the ocean’s dynamical processes, biological productivity, and marine ecosystems. The AC rings are notably larger (200–400 km diameter) and longer-lived (6–18 months) compared to eddies in the other WBCs, while the BC eddies tend to be smaller (50–150 km) and shorter-lived (1–3 months). The GS, KC, and EAC eddies share similar characteristics (100–300 km diameter) and last 3–6 months.
Although kinetic energy in WBCs is high in the main core of the jets (Figure 2a), mesoscale eddies account for around 90% of the total surface kinetic energy in the global ocean. In the eddy-rich areas, such as the WBC extension regions, the eddy kinetic energy is much larger than the global mean (Figure 2b) and shows a significant increase of 2%–5% per decade (Martínez-Moreno et al., 2021).
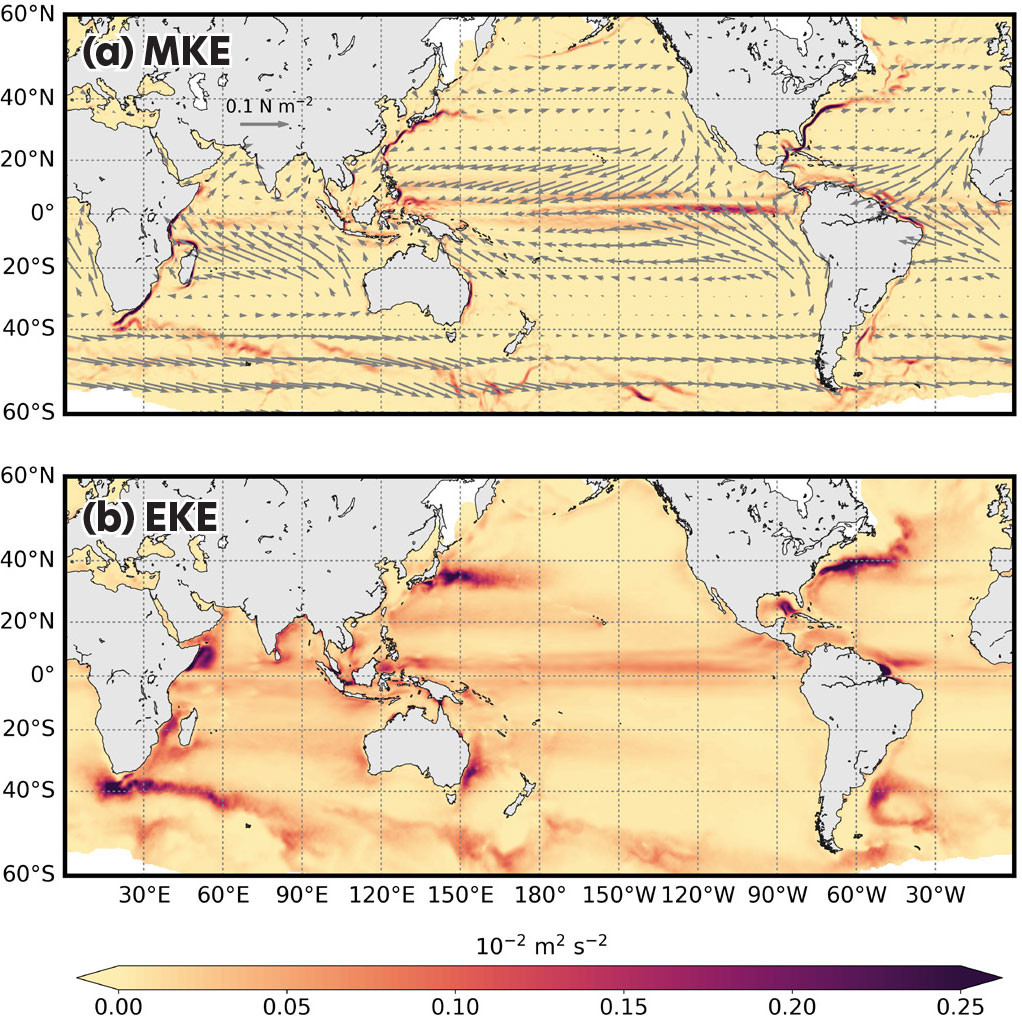
FIGURE 2. Spatial distributions of (a) mean kinetic energy (MKE), and (b) eddy kinetic energy (EKE) from AVISO observations between 1993 and 2020. The gray vectors in (a) indicate the wind stress from ERA5 reanalysis between 1993 and 2020. > High res figure
|
Due to their dynamic nature, eddies are difficult to measure, model, and predict; hence, observational strategies are challenging. Recent work shows that the subsurface structures of WBC eddies are not well represented in ocean models (Gwyther et al., 2022, 2023a, 2023b). For example, eddy-permitting models typically have eddies that are too barotropic and extend too deep through the water column (Gwyther et al., 2023a). Thus, temperature stratification, mixed layer depth, and thermocline and eddy-driven vertical processes are not well represented, resulting in poor estimates of ocean heat content. This observational gap needs to be addressed to improve eddy prediction (Gwyther et al., 2022, 2023a, 2023b).
CROSS-SHELF EXCHANGE AND COASTAL UPWELLING
Cross-shelf exchange and coastal upwelling are key processes associated with WBCs that influence the distribution of heat, nutrients, and biota in coastal regions. These processes are driven by interaction between the strong WBCs and the coastal topography, as well as by local wind patterns. Additionally, the width of the continental shelf plays a role. For example, the EAC, AC, and KC flow within close proximity to the coast along narrow shelves (ranging from 15 km to 30 km) compared to the GS and BC where the shelf ranges from 20 km to 100 km wide and the WBC core can be well offshore. In the EAC (Roughan and Middleton, 2002) and BC (Calado et al., 2010) regions, where the strong jets can flow close to the coast, current-driven upwelling plays a key role in bringing nutrient-rich waters to the coast. Similarly, the interaction between the KC and the continental shelf plays a critical role in cross-shelf exchange and coastal upwelling. WBC-induced coastal upwelling also strongly impacts chlorophyll and oxygen concentrations, vertical migrations of zooplankton, and primary production. Across the broad GS shelf, river outflow and buoyancy forcing play roles in driving the shelf circulation. Cyclonic (cold core) eddies also form on the inside edges of WBCs (as frontal eddies) and can spin up and grow. They are important ecological features that can drive the retention, advection, and connectivity of coastal species. These cross-shelf exchange processes are essential for sustaining the productivity of coastal ecosystems.
The broadening of the AC has implications for cross-shelf exchange processes, potentially enhancing the transport of warm, nutrient-poor waters onto the continental shelf (Beal and Elipot, 2016). Intensified warming of the Southern Hemisphere WBCs (Li et al., 2022) could lead to changes in cross-shelf exchange and coastal upwelling patterns and a reduction in upwelling intensity. This could have significant impacts on local marine ecosystems, particularly in terms of nutrient availability and primary productivity. Thus, as cross-shelf exchange processes are sensitive to changes in the strength and variability of the WBCs, with potential consequences for coastal ecosystems and fisheries.
PRESENT AND FUTURE OBSERVATIONS
Understanding the dynamics of WBCs and their responses to climate change requires continuous and comprehensive observations. Advances in satellite technology, oceanographic measurements, and numerical modeling have provided valuable insights into the behavior of WBCs, but challenges remain in capturing their full complexity and predicting future changes. Their deep extents and strong currents make them an observational challenge.
Expendable BathyThermographs (XBTs) have provided some of the longest and most sustained repeat observations of WBC regions, starting in the 1960s (Goni et al., 2019). Due to their simple and robust nature, they provide an excellent means with which to get widespread observations along routine shipping routes. However, they typically only measure temperature in the top 700–900 m of the water column, leaving much of the depth structures of the WBCs and their eddies unobserved. Additionally, as the observations are reliant on repeat shipping routes, the latitude at which the vessels cross the WBC core varies in each system (Chandler et al., 2022). This means that analogous repeat observations of WBC jets do not yet exist. Having analogous observations across similar dynamical regimes (e.g., Archer et al., 2018) would allow for robust comparison between the WBCs and help to eliminate uncertainty in the comparisons of estimates of volume transport and heat content.
The increasing intensity of eddy activity in WBCs observed over the satellite altimetry record (Martínez-Moreno et al., 2021; Li et al., 2022) highlights the importance of continued monitoring to understand the drivers and impacts of these changes. Data from new satellites such as Surface Water and Ocean Topography (SWOT) that fully resolve mesoscale and some submesoscale processes will play an important role in resolving the structure and variability of WBCs and their mesoscale eddies, particularly when their data is combined with in situ observations (e.g., Beal and Elipot, 2016, extended a three-year moored time series in combination with satellite altimetry).
In the EAC and GS, efforts have been made to use repeat glider missions along the length of the currents (as opposed to endurance lines in eastern boundary currents) for sustained monitoring of heat content (and in the GS also velocities) (Todd et al., 2019). These efforts provide broad-scale but sporadic observations below the surface, but with enough repetition, they are valuable for observing mean and extreme hydrographic states (e.g., Schaeffer and Roughan, 2015).
Argo floats (Wijffels et al., 2024) and surface drifters (Lumpkin et al., 2017; Matisons et al., in press) provide Lagrangian estimates of the WBCs; however, they are readily advected out of the swift currents, and ejected from eddies; hence, regular seeding of floats into WBCs is important to maintain coverage of the jet and eddy regions. Modified Argo float sampling strategies have shown that daily profiles are useful not only for resolving eddy structure but also for retaining the floats within eddies (e.g., by changing park depths to 300–500 m), and this deserves further exploration.
The importance of long-term moored observational data was highlighted in Beal and Elipot (2016) for understanding changes in AC structure and variability below the surface. They emphasize combining satellite altimetry and in situ measurements in calculating variability and change, and their results underscore the need for sustained in situ observations to monitor these changes and their impacts on WBC circulation. While long-term moored observations are essential for obtaining full-depth structure, they are costly and challenging to maintain long term; for example, see Sloyan et al. (2016 and 2024) for a description of ~10 years of full-depth observations in the EAC.
New methods to observe broadly at low cost include the use of ships of opportunity, for example, the emerging Fishing Vessel Observation Network (FVON; Jakoboski et al., 2024), that allows broad-scale coverage. These ships offer opportunistic observations largely in shelf seas, where fishing occurs, to complement existing observation methods (e.g., the high temporal resolution but single point moored observations and broad scale, but sporadic glider missions). The use of fishing vessel observations to explore marine heatwaves and high-resolution subsurface ocean structure has been demonstrated successfully in the EAC (Lago et al., 2025, in this issue), and this low-cost technology should be considered an essential part of a WBC observing system, particularly in data poor regions.
There is increasing use of uncrewed surface vehicles to measure ocean-atmosphere exchanges. The usefulness of these vehicles in exploring the role of WBCs on short-term weather and longer-term seasonal and climatic dynamics is also noteworthy. Like glider missions, these observations are autonomous (with piloting and technical teams located ashore) and play a crucial role in understanding fluxes and cross-shelf exchanges (Cronin et al., 2023).
There is no clear and consistent guidance for observations in WBCs, which makes comparisons between them difficult. Archer et al. (2018) showed the value of using similar observational datasets for direct comparisons between systems (they used high-resolution high-frequency radar to compare upstream circulation in the EAC and the GS at similar latitudes). While the global XBT program comes close to meeting this objective, the observation lines are determined by shipping routes, not ocean dynamics, which makes direct comparisons more difficult (Chandler et al., 2022).
In order to make direct comparisons among systems (e.g., like those in Table 1), there is a pressing need for analogous observations in dynamically similar locations in each of the WBC systems. This would enable accurate comparisons among the systems, for example, of upstream transport and heat content, or eddy variability and retention. Similarly, consistent methodologies for analysis of the analogous datasets allow for direct comparisons of WBC variability (Archer et al., 2018; Chandler et al., 2022). A readily accessible suite of tools to interrogate ocean models and WBC datasets in similar ways would also be welcome.
Continuous and comprehensive in situ surface and subsurface observations in the upstream areas of WBCs and their extension regions are critical for us to better understand the dynamics, changes, and drivers of WBCs. Additionally, the full integration of satellite observations and in situ real-time measurements with high-resolution models is essential in order to improve state estimates and predictions of future changes in WBCs and to better understand the drivers of ocean warming and their impacts on regional and global climates.
Acknowledgments
This research is supported by an Australian Research Council Discovery Project (DP230100505), the Fundamental Research Funds for the Central Universities, China (B240201133), the Open Fund Project of Key Laboratory of Marine Environmental Information Technology, Ministry of Natural Resources of the People’s Republic of China (523060012), and the Jiangsu Specially-Appointed Professor (B1203524).