BACKGROUND
Sea ice is the dominant feature structuring Antarctic coastal marine ecosystems. Fast ice (i.e., annual sea ice attached to the shore) can support some of the most productive marine habitats on Earth, contributing approximately 55%–68% of the total primary production in coastal areas (McMinn et al., 2010). Other contributors include phytoplankton as well as benthic microalgae and macroalgae. As coastal sea ice extent and stability shift, the balance of primary production between phytoplankton, sea ice algae, and benthic microalgae may change significantly, with cascading impacts on tightly linked seafloor biodiversity and overall ecosystem functioning (Norkko et al., 2007; Wing et al., 2018).
Seasonal changes in fast ice thickness, extent, and snow cover regulate light transmission, strongly influencing under-ice primary production. The presence or absence of sea ice alters aquatic photosynthesis by modifying light intensity and spectral quality (Soja-Woźniak et al., 2025). The shallow depths typical of ice-covered coastal zones further promote efficient export of ice algae and other particulate matter to the seafloor via both primary and secondary production, resulting in tight cryo-pelagic-benthic coupling. The resulting quantity and quality of phytodetritus through the seasons play a role in shaping the diversity and abundance of benthic microbial, algal, and invertebrate communities (Rossi et al., 2019).
Historically, we have struggled to capture the high spatio-temporal variability at which sea ice biogeochemical processes occur (from 1 µm to 10–1,000 m, from seconds to decades). Shifts in the sources and fluxes of organic matter from the ice to benthic food webs may serve as early indicators of broader ecological responses to physical environmental changes driven by climate change in Antarctica (Clark et al., 2017). Looking directly below the surface, the complexity of the Antarctic seafloor speaks for itself. Shallow benthic ecosystems display remarkable structural, functional, and biological diversity, shaped by dense assemblages of sessile epifaunal and infaunal invertebrates, fishes and algae, patchy habitat mosaics, and tightly coupled trophic interactions that persist despite extreme conditions (Gutt et al., 2015). The scales and intensity of this coupling vary considerably with depth and connectivity with primary food sources (from meters to kilometers).
Because nearshore productivity and biodiversity are closely linked to sea ice dynamics, there is a pressing need for monitoring methods that can efficiently and simultaneously track changes in light levels, changes in cryo-benthic communities, and food pulses. These techniques must also be practical for use in extremely remote and challenging environments—such as under two meters of thick Antarctic fast ice. Historically, this has been done using diver-based surveys, which are necessarily restricted in spatial and temporal extent and in maximum depth. Recently, the availability of small remotely operated vehicles (ROVs) has enabled the expansion of coastal under-ice sampling areas at reduced logistical complexity. Incorporating hyperspectral imaging into these platforms can expand their utility beyond mapping the under-ice seascape and associated biodiversity, enabling the spatial and temporal quantification of ecosystem function through measurements of biomass and accessory pigment estimates that can serve as indicators of organismal health.
UNDERWATER HYPERSPECTRAL IMAGING
The devil, of course, is in the detail. Process studies should strive to take observations at the spatial resolution over which the process operates (Levin, 1992). Analogous to the rapid rise of close-range terrestrial hyperspectral imaging using drones over the past decade, in situ underwater hyperspectral imaging (UHI) has emerged as a powerful tool for generating high-resolution biogeochemical maps of seafloor properties. First introduced as a dedicated subdiscipline of marine remote sensing by Johnsen et al. (2013), proximity-based hyperspectral sensing in marine environments is an emerging methodology; to date, only a handful of documented systems have been deployed on diver-operated platforms, ROVs, or under-ice sleds across diverse habitats from tropical reefs to the deep sea (Montes-Herrera et al., 2021; Summers et al., 2022; Lange et al., 2024; Anhaus et al., 2025). Its repeatable, non-invasive capabilities make UHI especially suited for tracing and quantifying fine-scale biogeochemical processes in remote and sensitive environments.
UNDER-ICE MAPPING WITH HIcyBot
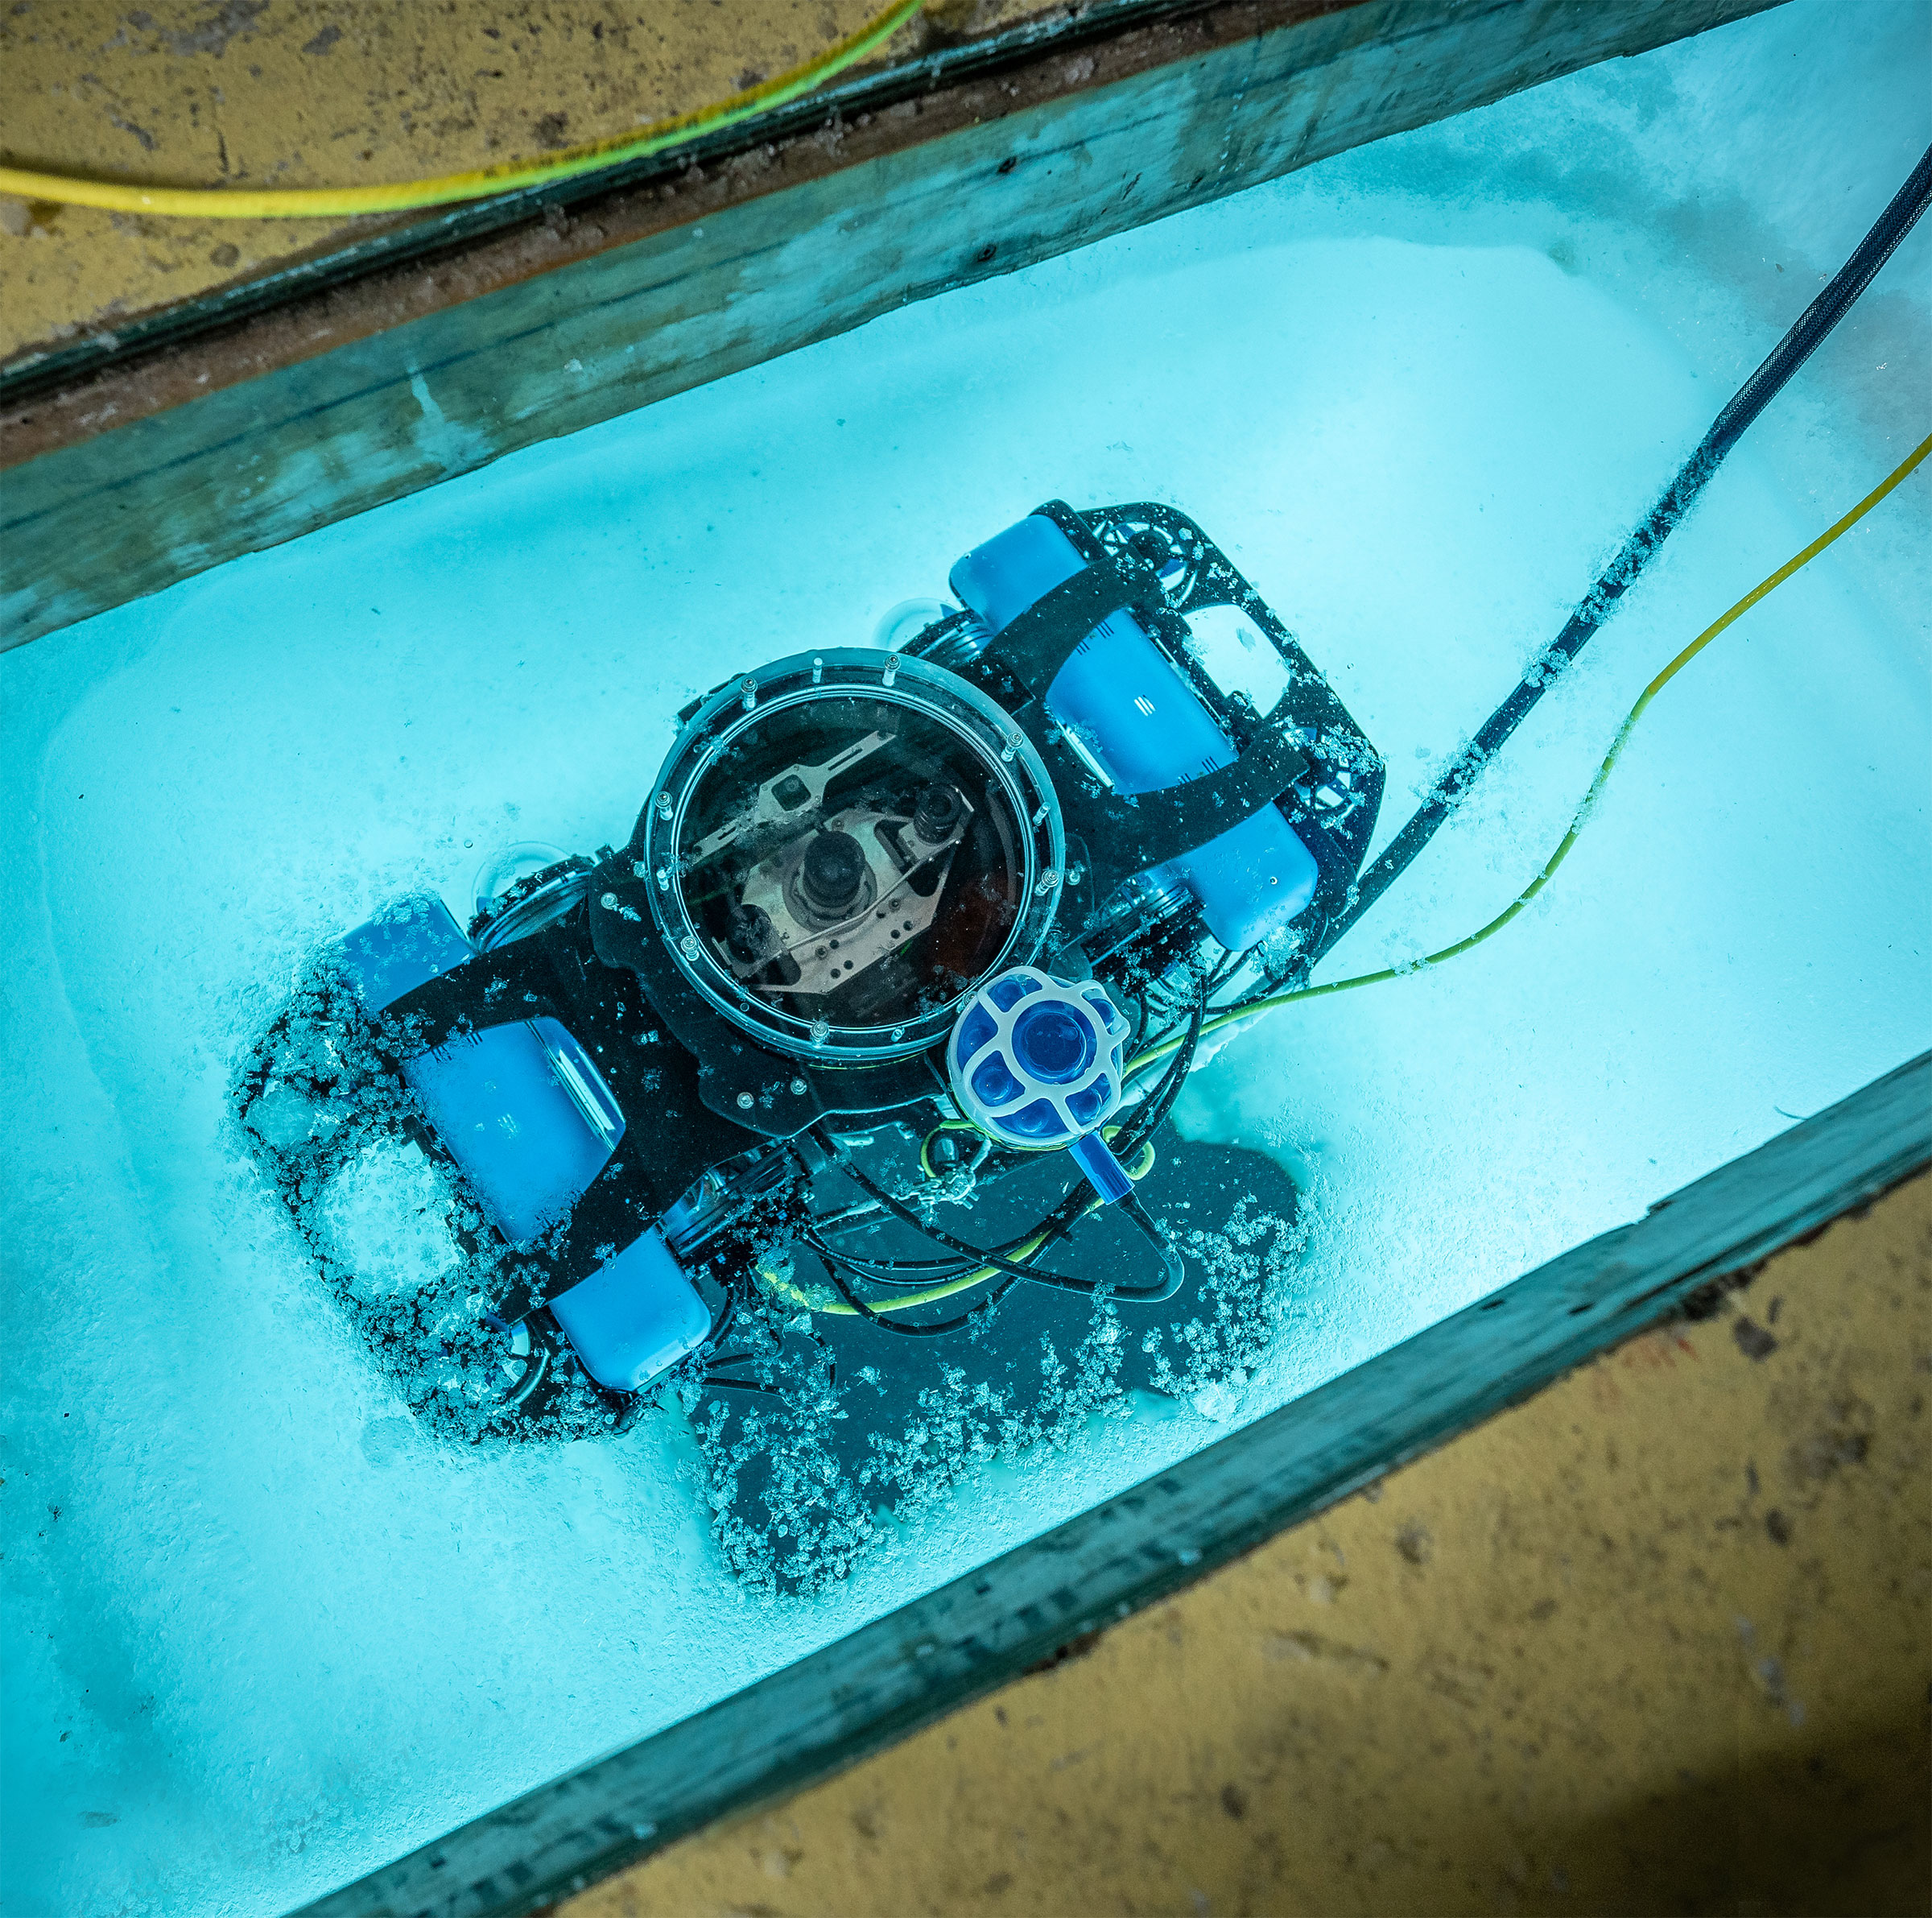
The HIcyBot system aims to produce co-georeferenced UHI and three-dimensional (3D) structural data of the seafloor and overlying fast ice based on several surveys conducted within hours of one another (Figure 1). The optical components include three primary subsystems: a central hyperspectral imager, a stereophotogrammetric dual-camera system, and a USB live-stream reference camera contained within a tethered underwater enclosure (Figure 2).
An eight-hydrophone-array ultra-short baseline (USBL) sensor was integrated to enable geolocation of pushbroom hyperspectral frames with synchronized, timestamped Global Navigation Satellite System (GNSS) and inertial navigation data. The co-mounted dual-vision cameras leverage stereophotogrammetry techniques to derive camera positions and orientations from overlapping stereo images, providing independent vehicle pose estimates that support local motion compensation for the UHI in conditions where USBL signal quality is degraded beneath the ice (Figure 1). The payload enclosure was incorporated into a customized BlueROV2 heavy-configuration kit. A key design feature was the addition of bottom ballast to create a pendulum-like configuration, enabling passive, stable vertical alignment for nadir-facing imaging without active control. Technical specifications, image pre-processing, and georeferencing challenges for UHI are provided in the online Supplementary Materials.
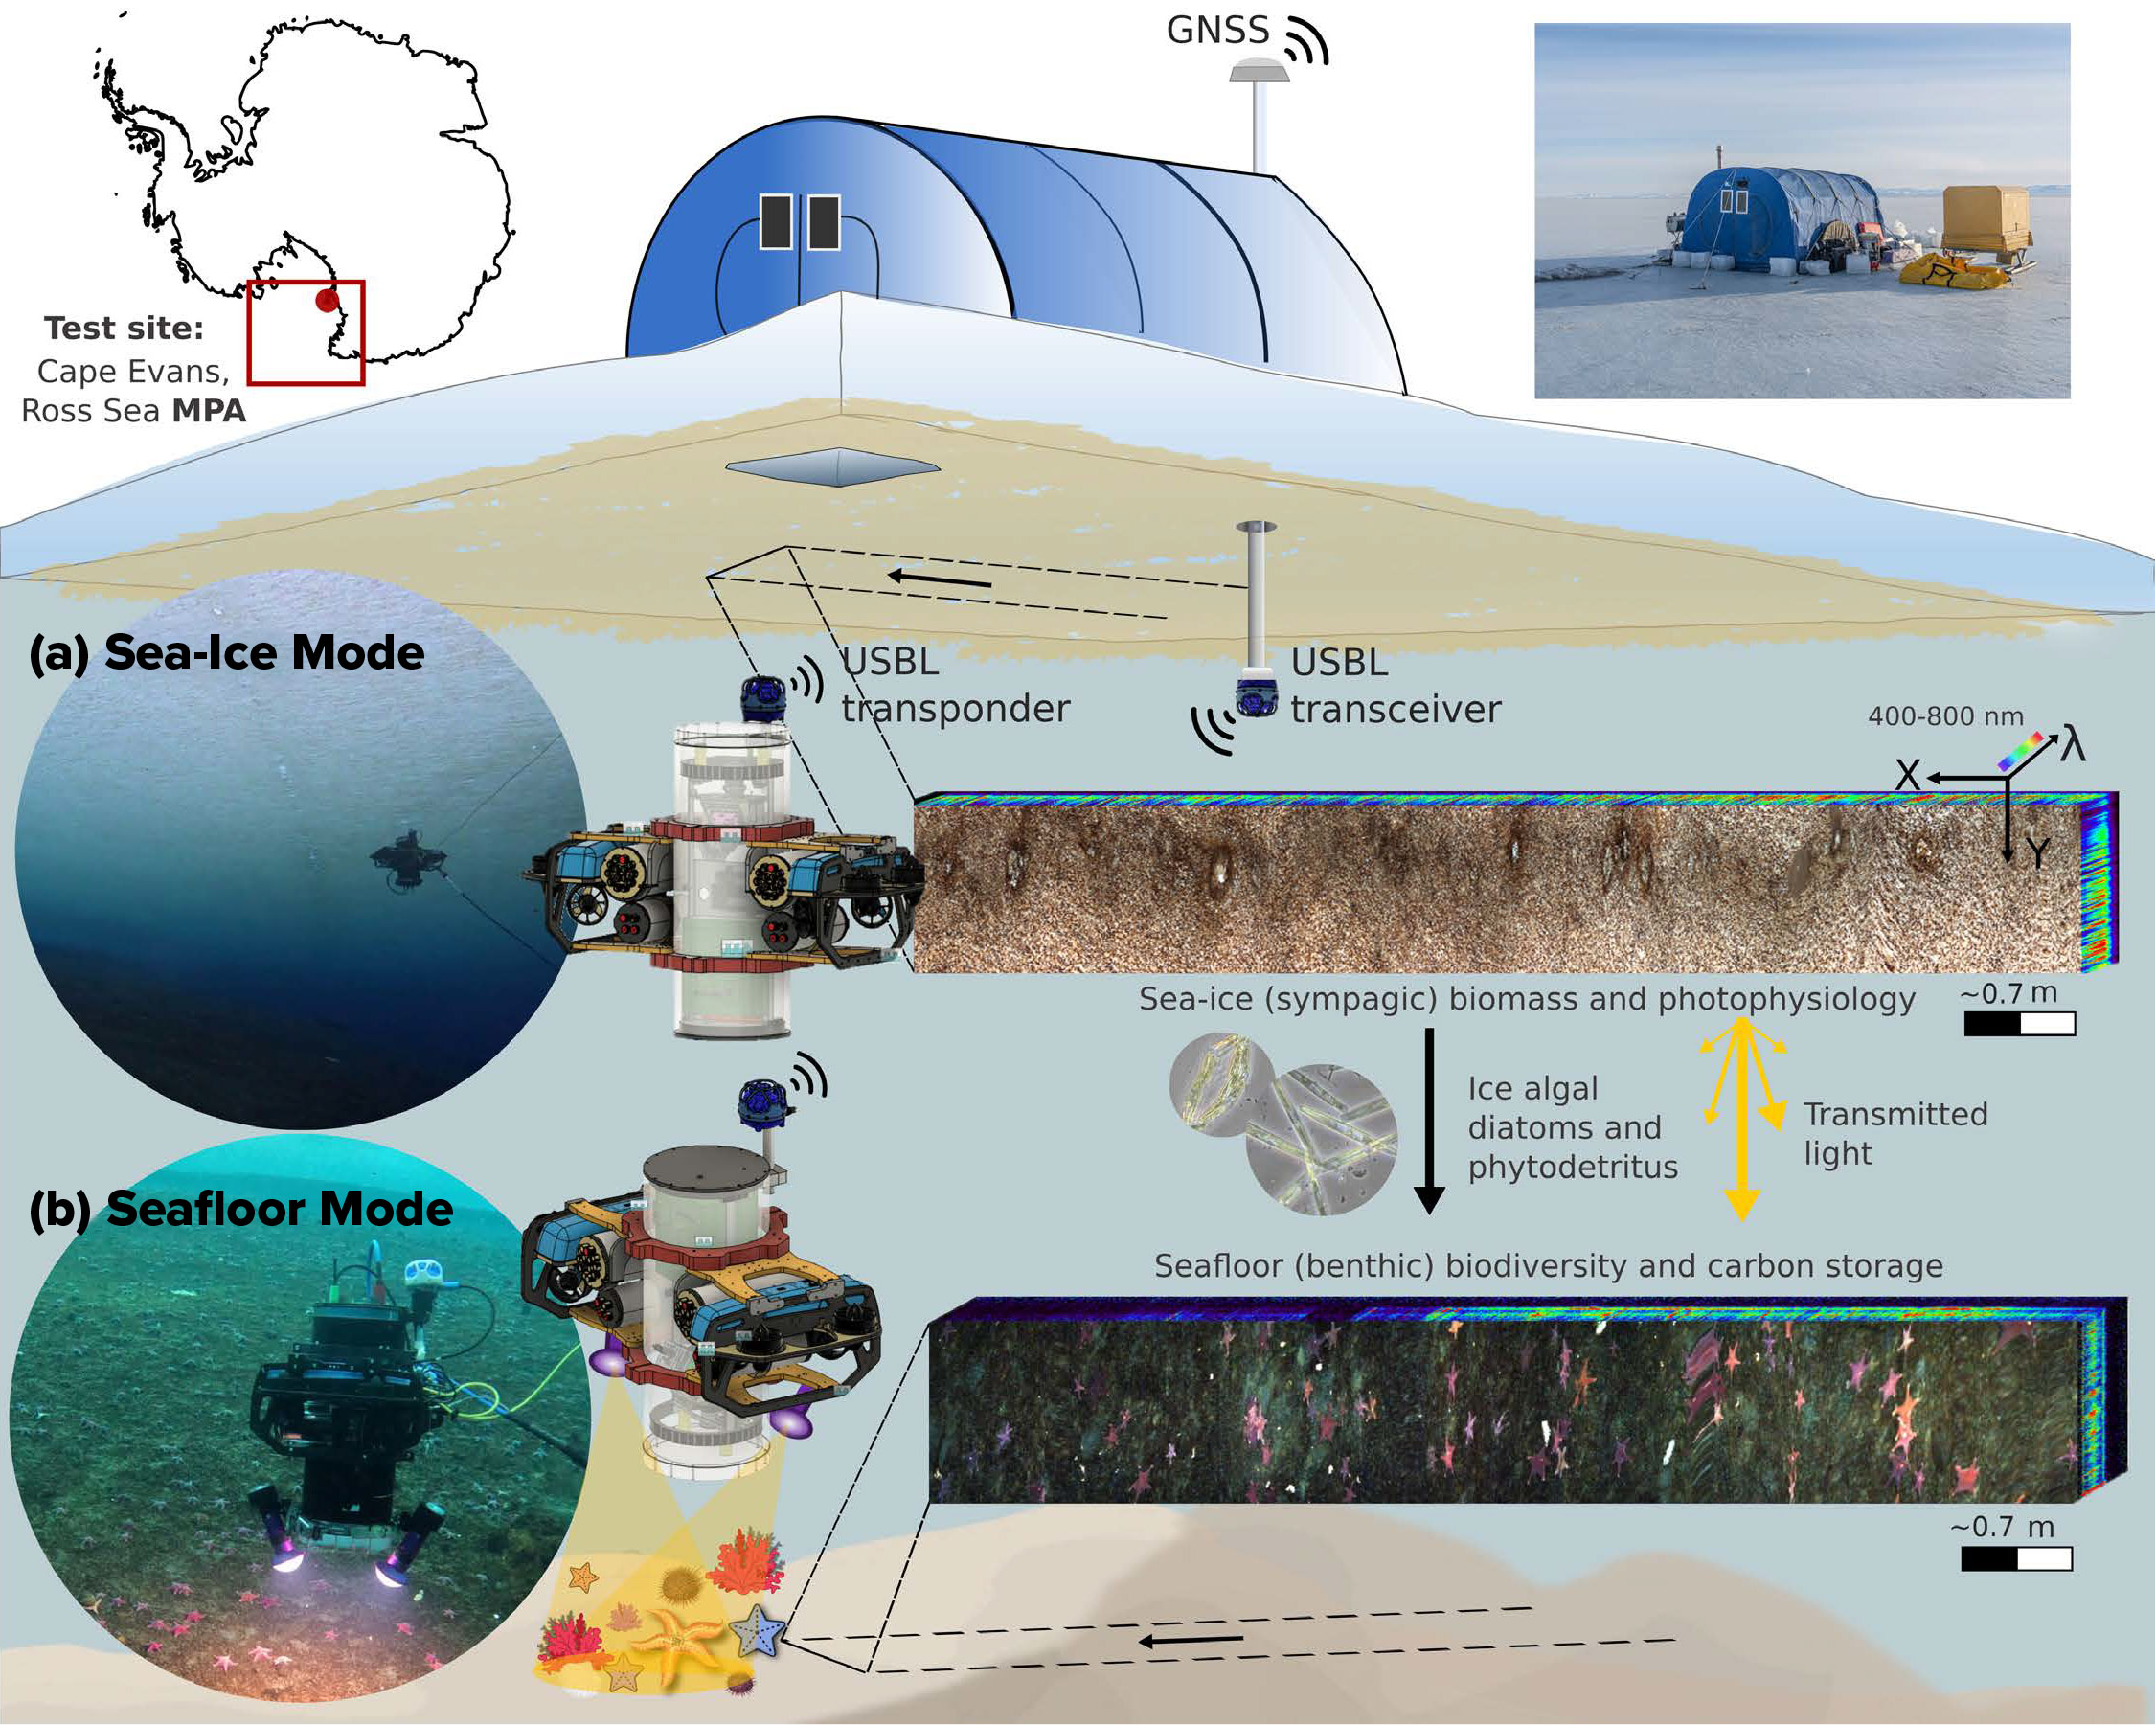
FIGURE 1. HIcyBot is a proof-of-concept under-ice remotely operated vehicle (ROV) with hyperspectral imaging capability, designed for concomitant mapping of (a) sympagic (ice-associated) habitats, and (b) benthic, seafloor-associated habitats that remain largely inaccessible to other marine sensing and survey techniques. Pushbroom sensors record one spatial line per frame as the platform moves, forming a 3D hyperspectral cube (X, Y, λ) linking spatial and spectral domains. GNSS = Global Navigation Satellite System. USBL = ultra-short baseline. MPA = Marine Protected Area. See the flipbook version of this article to view videos of the HIcyBot in (a) sea ice, and (b) seafloor modes.
> High res figure
|
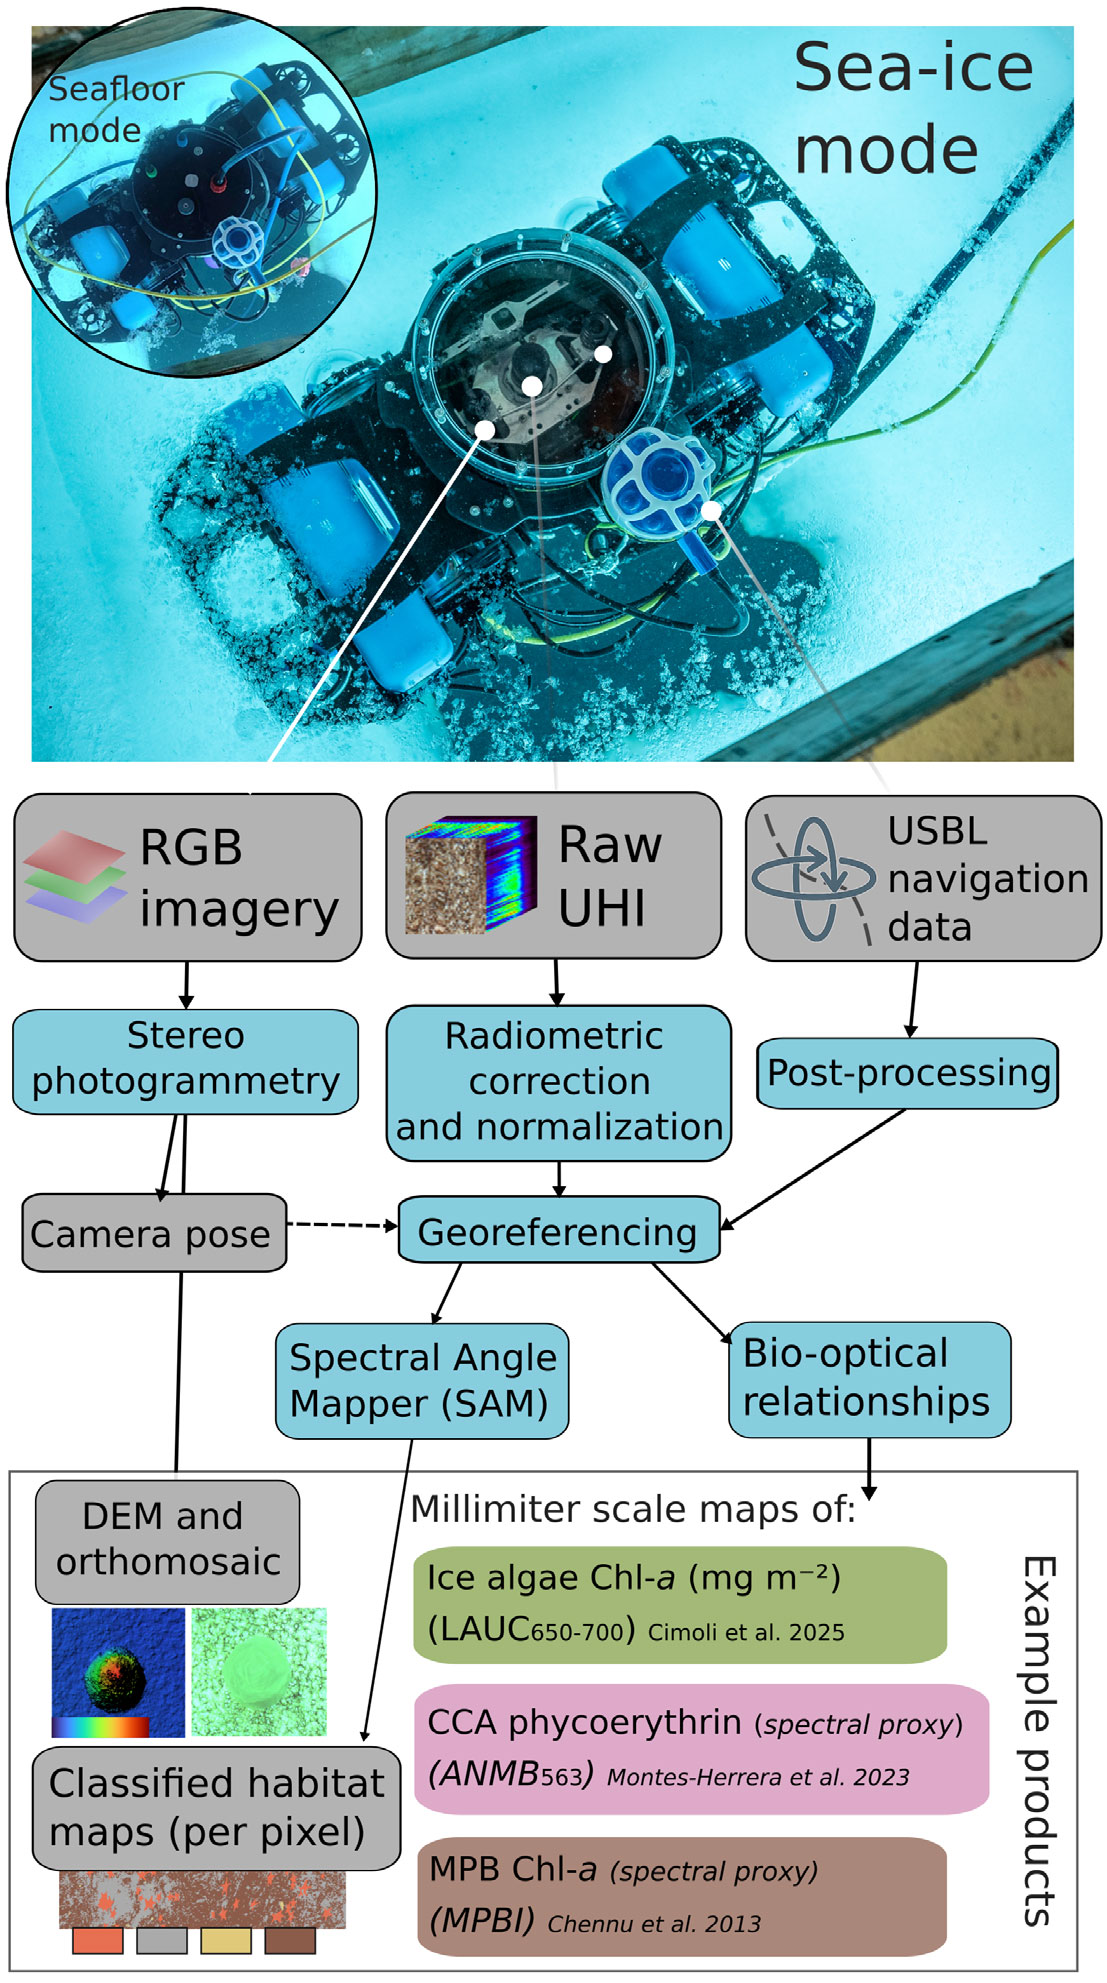
FIGURE 2. The data processing workflow for both sea-ice and seafloor HIcyBot operating modes (upward- and downward-looking) includes optical and acoustic data streams and subsequent processing steps that lead to example data products, with both modes sharing the same general pre-processing pipeline. RGB = red, green, blue. UHI = underwater hyperspectral imaging. USBL = ultra-short baseline. DEM = digital elevation model. CCA = crustose coralline algae. MPB = microphytobenthos.
> High res figure
|
FIELD TEST IN THE ROSS SEA MPA
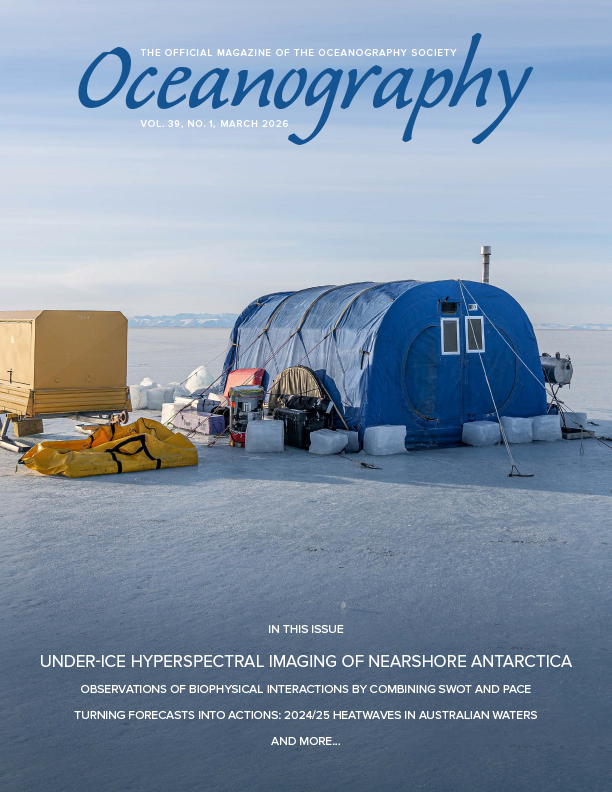
The system was first deployed from November 7 to 22, 2023, under land-fast sea ice at Cape Evans, within the Ross Sea Marine Protected Area (MPA), Antarctica, the world’s largest MPA. This region currently represents one of the least human-impacted environments, yet one of the most challenging to study due to extreme Antarctic conditions, remoteness, and extensive sea ice cover. It is considered a benthic biodiversity hotspot fueled by overlying under-ice algae of the highest concentrations on record. The primary objective was to generate preliminary products showing ice-associated (sympagic) algal biomass or chlorophyll a (Chl-a) concomitant with seafloor biodiversity, including class-level maps incorporating photosynthetic and accessory pigments of selected organism groups, all resolved along the hyperspectral transects at millimeter scales.
Looking Above: An Ice Algal Community Product Example
Quantifying sympagic biomass was previously only achievable with labor-intensive ice coring techniques and laboratory processing. UHI offers a significantly improved way to monitor the biophysical process in sea ice at varying spatial and temporal scales. Building on emerging work to develop bio-optical models for under-ice hyperspectral imaging in Antarctic land-fast sea ice, a “spectra to biomass” correlation was applied at a pixel level to the “x, y, λ hypercube” to fundamentally enhance the estimation of under-ice algal biomass and their microscale distribution patterns remotely and quantitatively (e.g., LAUC650–700 from Cimoli et al., 2025; see Figure 1 workflow).
Figure 3a provides an example of a quantitative high-resolution estimation of sympagic Chl-a from an ROV. It shows an ice algal biomass map derived from optimized bio-optical algorithms with fine-scale variability associated with features such as brinicles. Brinicles, often referred as “ice stalactites,” are complex physical structures that form as dense, saline brine is excluded from seawater as it freezes and drains downward into the ocean, freezing the surrounding seawater and creating hollow, downward-growing ice tubes (Testón-Martínez et al., 2024). Brinicles appear to support up to twice the amount of algal biomass around their edges compared with surrounding flat areas (Figure 3a), potentially providing important habitat for under‑ice grazers through both enhanced food availability and their sheltering role. With HIcyBot, we can scale up efforts to quantify and characterize ice algal biomass through larger spatial swaths, achieving millimeter‑scale resolution while extending coverage to survey‑grid scales (e.g., 100 × 100 m), and potentially providing pigment proxies of algal photoacclimation state and health (Cimoli et al., 2025).
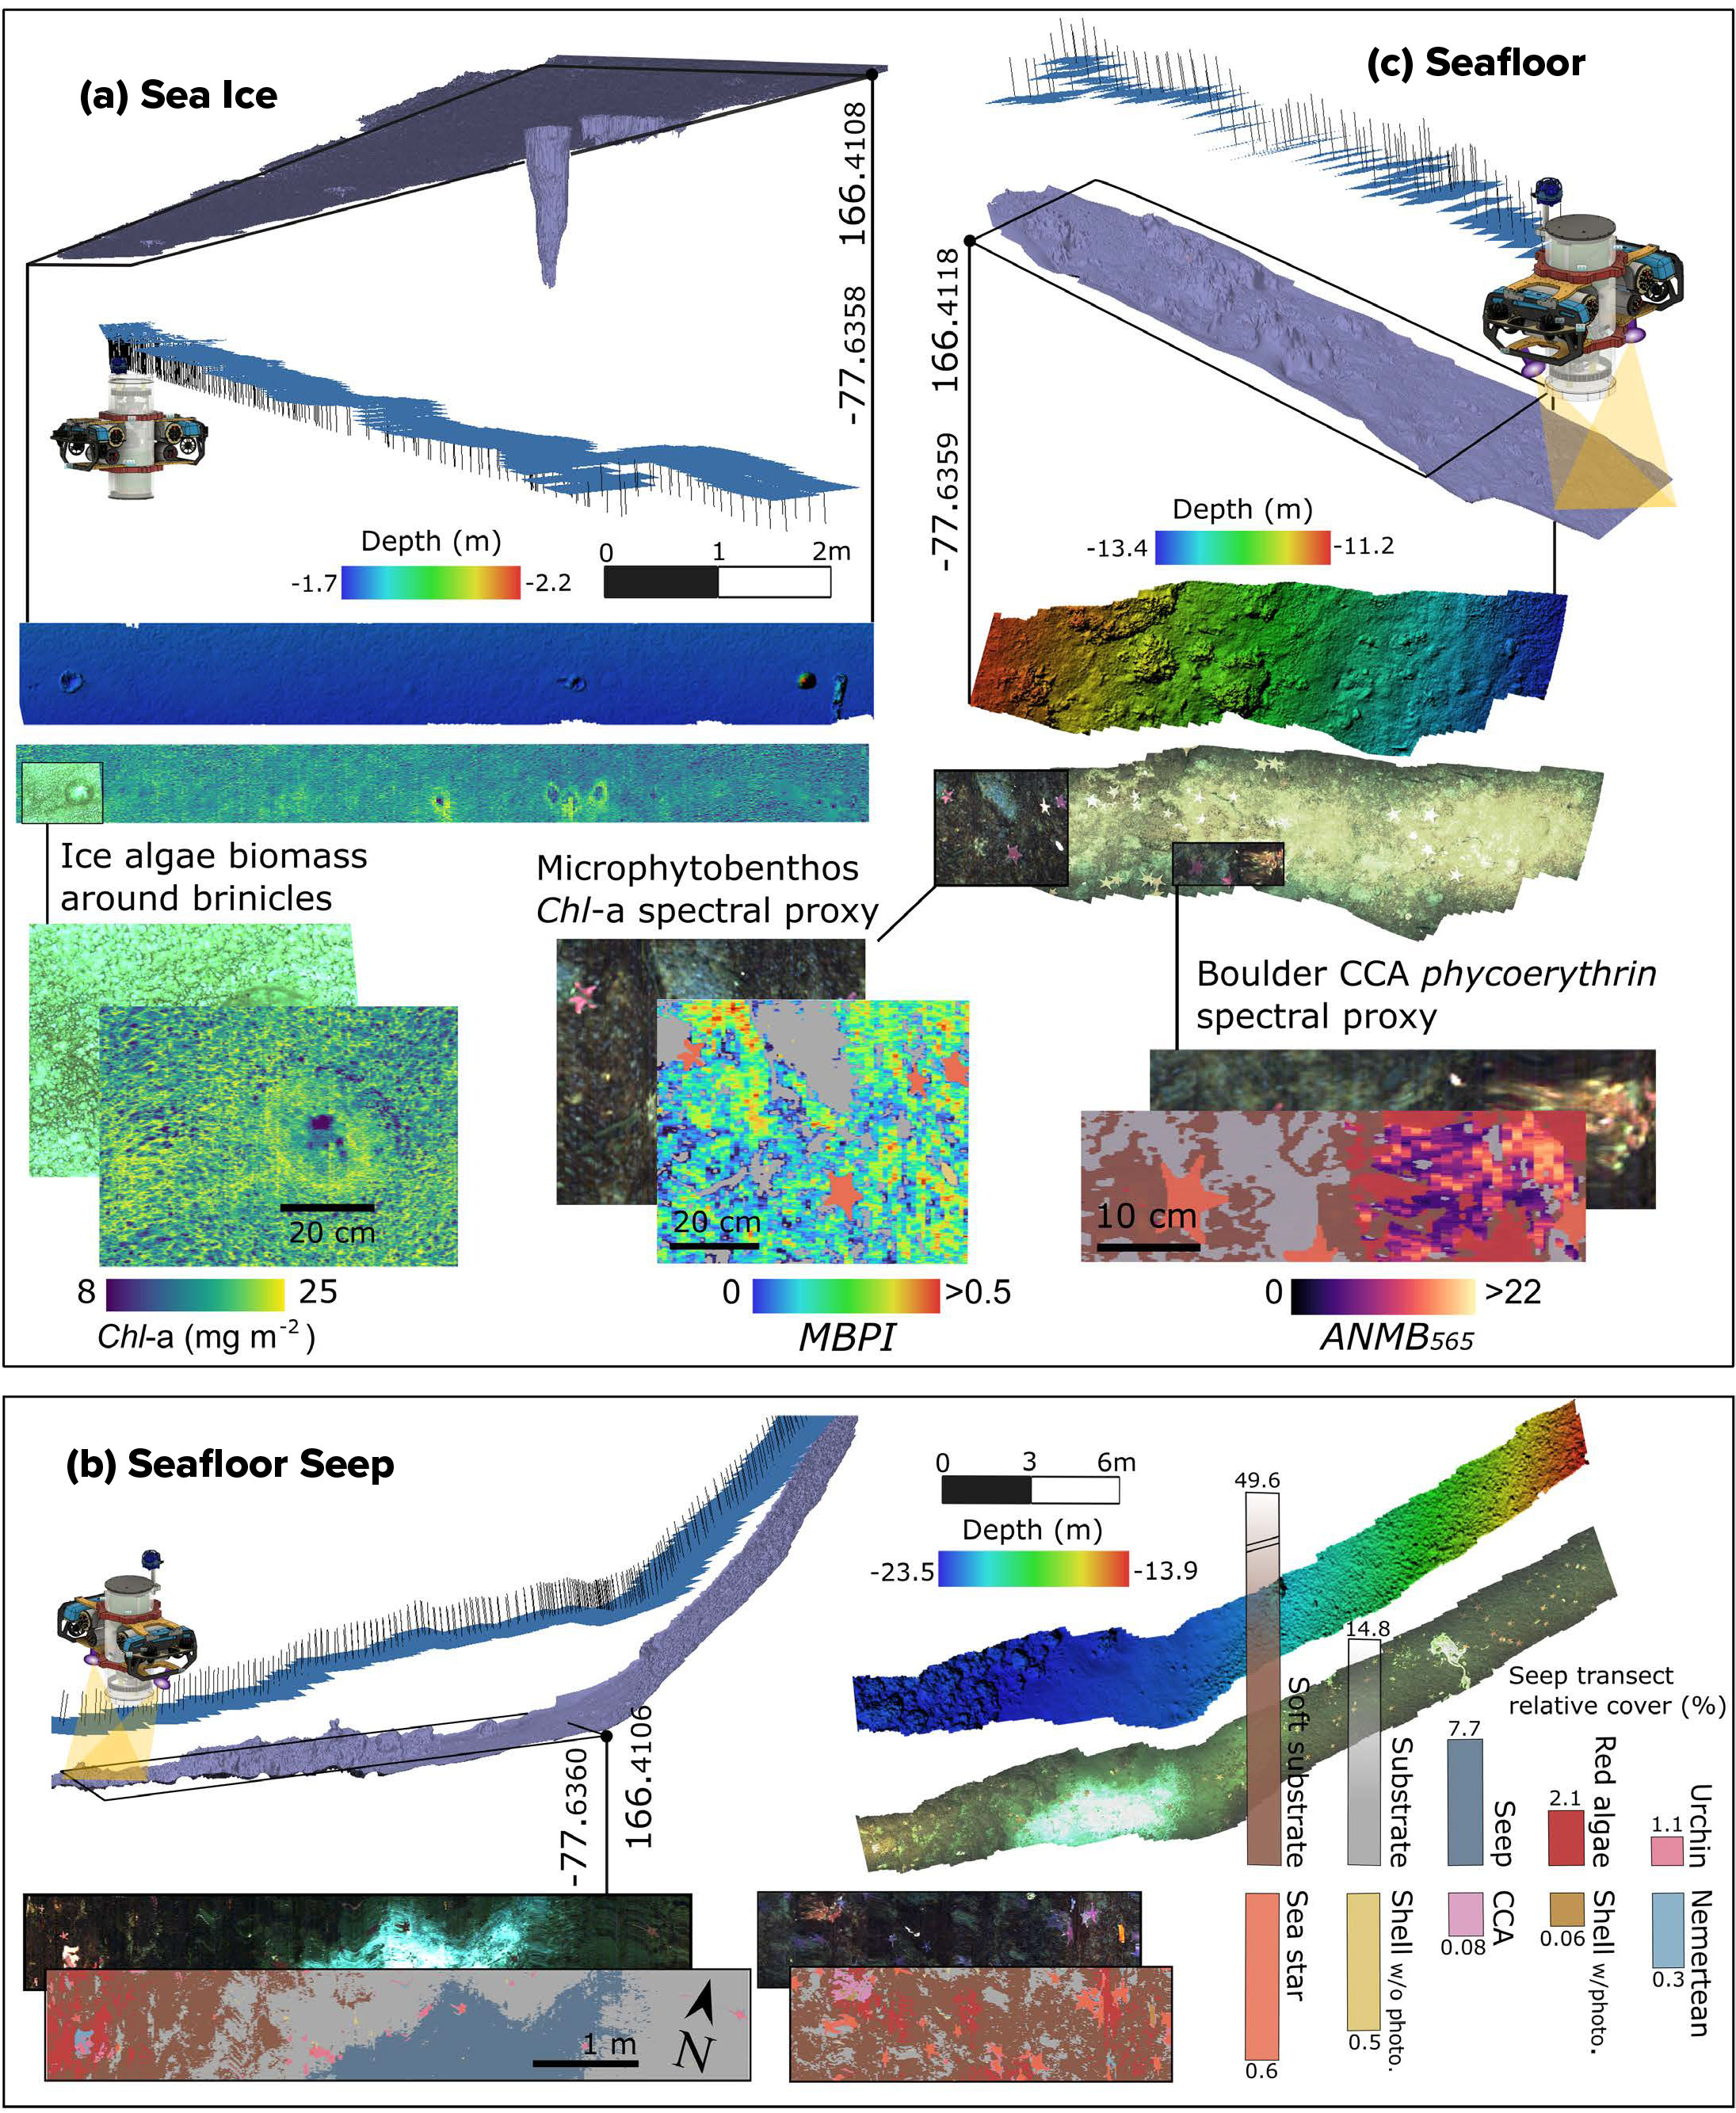
FIGURE 3. Stereophotogrammetry enabled 3D reconstructions of the (a) sea-ice underside and (b,c) seafloor. Georeferenced models provided camera pose data (pitch, roll, yaw) that, combined with USBL positioning, aided hyperspectral image geolocation. (a) Under-ice algal biomass map derived from bio-optical algorithms showing fine-scale variability associated with brinicles (“ice stalactites”). (b) and (c) Spectral Angle Mapper-based seafloor classification outputs identify major benthic classes, including a methane seep, millimeter-scale spectral proxies maps of Chl-a (MPBI), and phycoerythrin in crustose coralline algae (ANMB).
> High res figure
|
Looking Below: A Benthic Biodiversity Product Example
HIcyBot’s internal enclosure can quickly be physically inverted within the customized BlueROV2 frame between deployments, enabling a downward-facing configuration for seafloor surveys. Operating roughly half a meter above the dark benthos at depths of 10–40 m with active illumination, this setup preserves vehicle nadir stability and allows detailed imaging of benthic habitats located beneath previously scanned ice surfaces.
Following reflectance conversion, we used the Spectral Angle Mapper (SAM) algorithm as an example of UHI classification. SAM compares the angle between the spectral signature of each pixel and known target reference spectra, essentially measuring how similar two spectral “color patterns” are, regardless of brightness. Because of the close distance to the target and use of artificial lighting, even small changes in distance from the sensor to the seafloor can cause large intensity variations (Dumke et al., 2018).
Automated hyperspectral classification of the seafloor at Cape Evans enabled generation of high-resolution maps showing benthic biodiversity, habitat composition, and the area covered by each class instantly and independent of the shape or illumination of the targets (Figure 3b). Substrate was distinguished between pebble/gravel and fine sand, aligning well with the known geomorphology of the site. A diffuse surface layer, likely composed of microalgae and/or diatoms, was observed across these sediment types. This “fluff layer” may be epipsammic, living on sand grains, or epipelic, occurring on finer sediments like mud or silt (Sutherland, 2008). Its origin remains uncertain and could either reflect in situ microphytobenthic growth or settled material from the water column or the ice-algae above.
The red macroalgae, Phyllophora antarctica, dominated the benthic assemblages, often attached to the sea urchin Sterechinus neumayeri via their tube feet or overgrown by brown microalgal assemblages. The urchins camouflage themselves with algal fronds and debris, forming a mutualism in which the algae avoid deep displacement while the urchins gain protection, a known interaction reinforced by Phyllophora’s chemical defenses against herbivory. Crustose coralline algae, considered important ecosystem engineers, were found encrusting many of the exposed rocks. Automated image classification further revealed a diversity of invertebrates, including Abatus spp. (burrowing echinoids with five radial grooves), and shells of the bivalve Laternula elliptica. The cod icefish (Trematomus bernacchii) can be seen swimming above a “starry” seafloor populated by the sea star Odontaster spp., whose colors range from pink to orange-yellow. Nemerteans (Parborlasia corrugatus), conspicuous worm-like scavengers and predators, were found traversing the seafloor or curled. We also captured and spectrally classified imagery of a newly emerged methane seep at Cape Evans (Figure 3b) adding to recent observations along the Ross Sea coast (Seabrook et al., 2025).
Following classification, the true potential of UHI lies in targeted millimeter-scale mapping of benthic organisms’ biochemical traits in situ. For example, here we applied algorithms developed under controlled laboratory conditions to estimate spectral proxies of R-phycoerythrin, an indicator of environmental state and health in coralline algae (using ANMB565 from Montes-Herrera et al., 2024), and Chl-a in epipelic communities, using models derived from comparable biological systems such as microphytobenthos (using MPBI from Chennu et al., 2013; Figure 3c). While these are realistic proxies, consistent quantitative field calibrations remain limited due to the need for species- and site-specific validation, robust calibration datasets, and standardized protocols.
OPTICAL MONITORING OF CRYO-BENTHIC LINKAGES IN A CHANGING ICESCAPE
Projected shifts in seasonal sea ice dynamics underscore the growing need to assess how well existing tools can capture the immediate responses of shallow, ice-covered marine habitats across different spatio-temporal scales. While traditional ice coring and seafloor surveys provide valuable ecological insights, new high-resolution optical systems offer non-invasive methods for capturing the spectral fingerprints of different sympagic and benthic organisms and substrates that allow their classification and quantification based on their spectral features (Figure 4a–c).
Spatially explicit UHI data open a new frontier for exploring and quantifying the dynamic exchange between sea ice and the seafloor, offering a “spectral breadcrumb trail” that links the ice canopy to the life below. For example, can spectral fingerprints help quantitatively track biogeochemical linkages between sea ice and the seafloor? Do sea ice algae retain pigment-specific signatures, and/or remain detectable after seafloor deposition, and can they be distinguished from native benthic phototrophs? Understanding how light transmission, algal productivity, and “slough-off” affect benthic biodiversity (both phylogenetic and functional) demands an integrated approach combining hyperspectral imaging with process-based measurements (e.g., ice-hanging sediment traps). Figure 4 highlights spectral characteristics of the coupled ice-benthic system, enabling quantification of light-driven impacts on benthic communities and associated biogeochemical processes. The system’s ability to capture both structural and compositional complexity, including organism volume, habitat architecture, and phototrophic biomass per unit area, provides a solid basis for developing indicators of the emerging Antarctic blue carbon potential. It may also help in differentiation of the relative contributions of sympagic, pelagic, and authigenic carbon sources, which is important for guiding conservation priorities and climate mitigation strategies in polar regions (Sands et al., 2023).
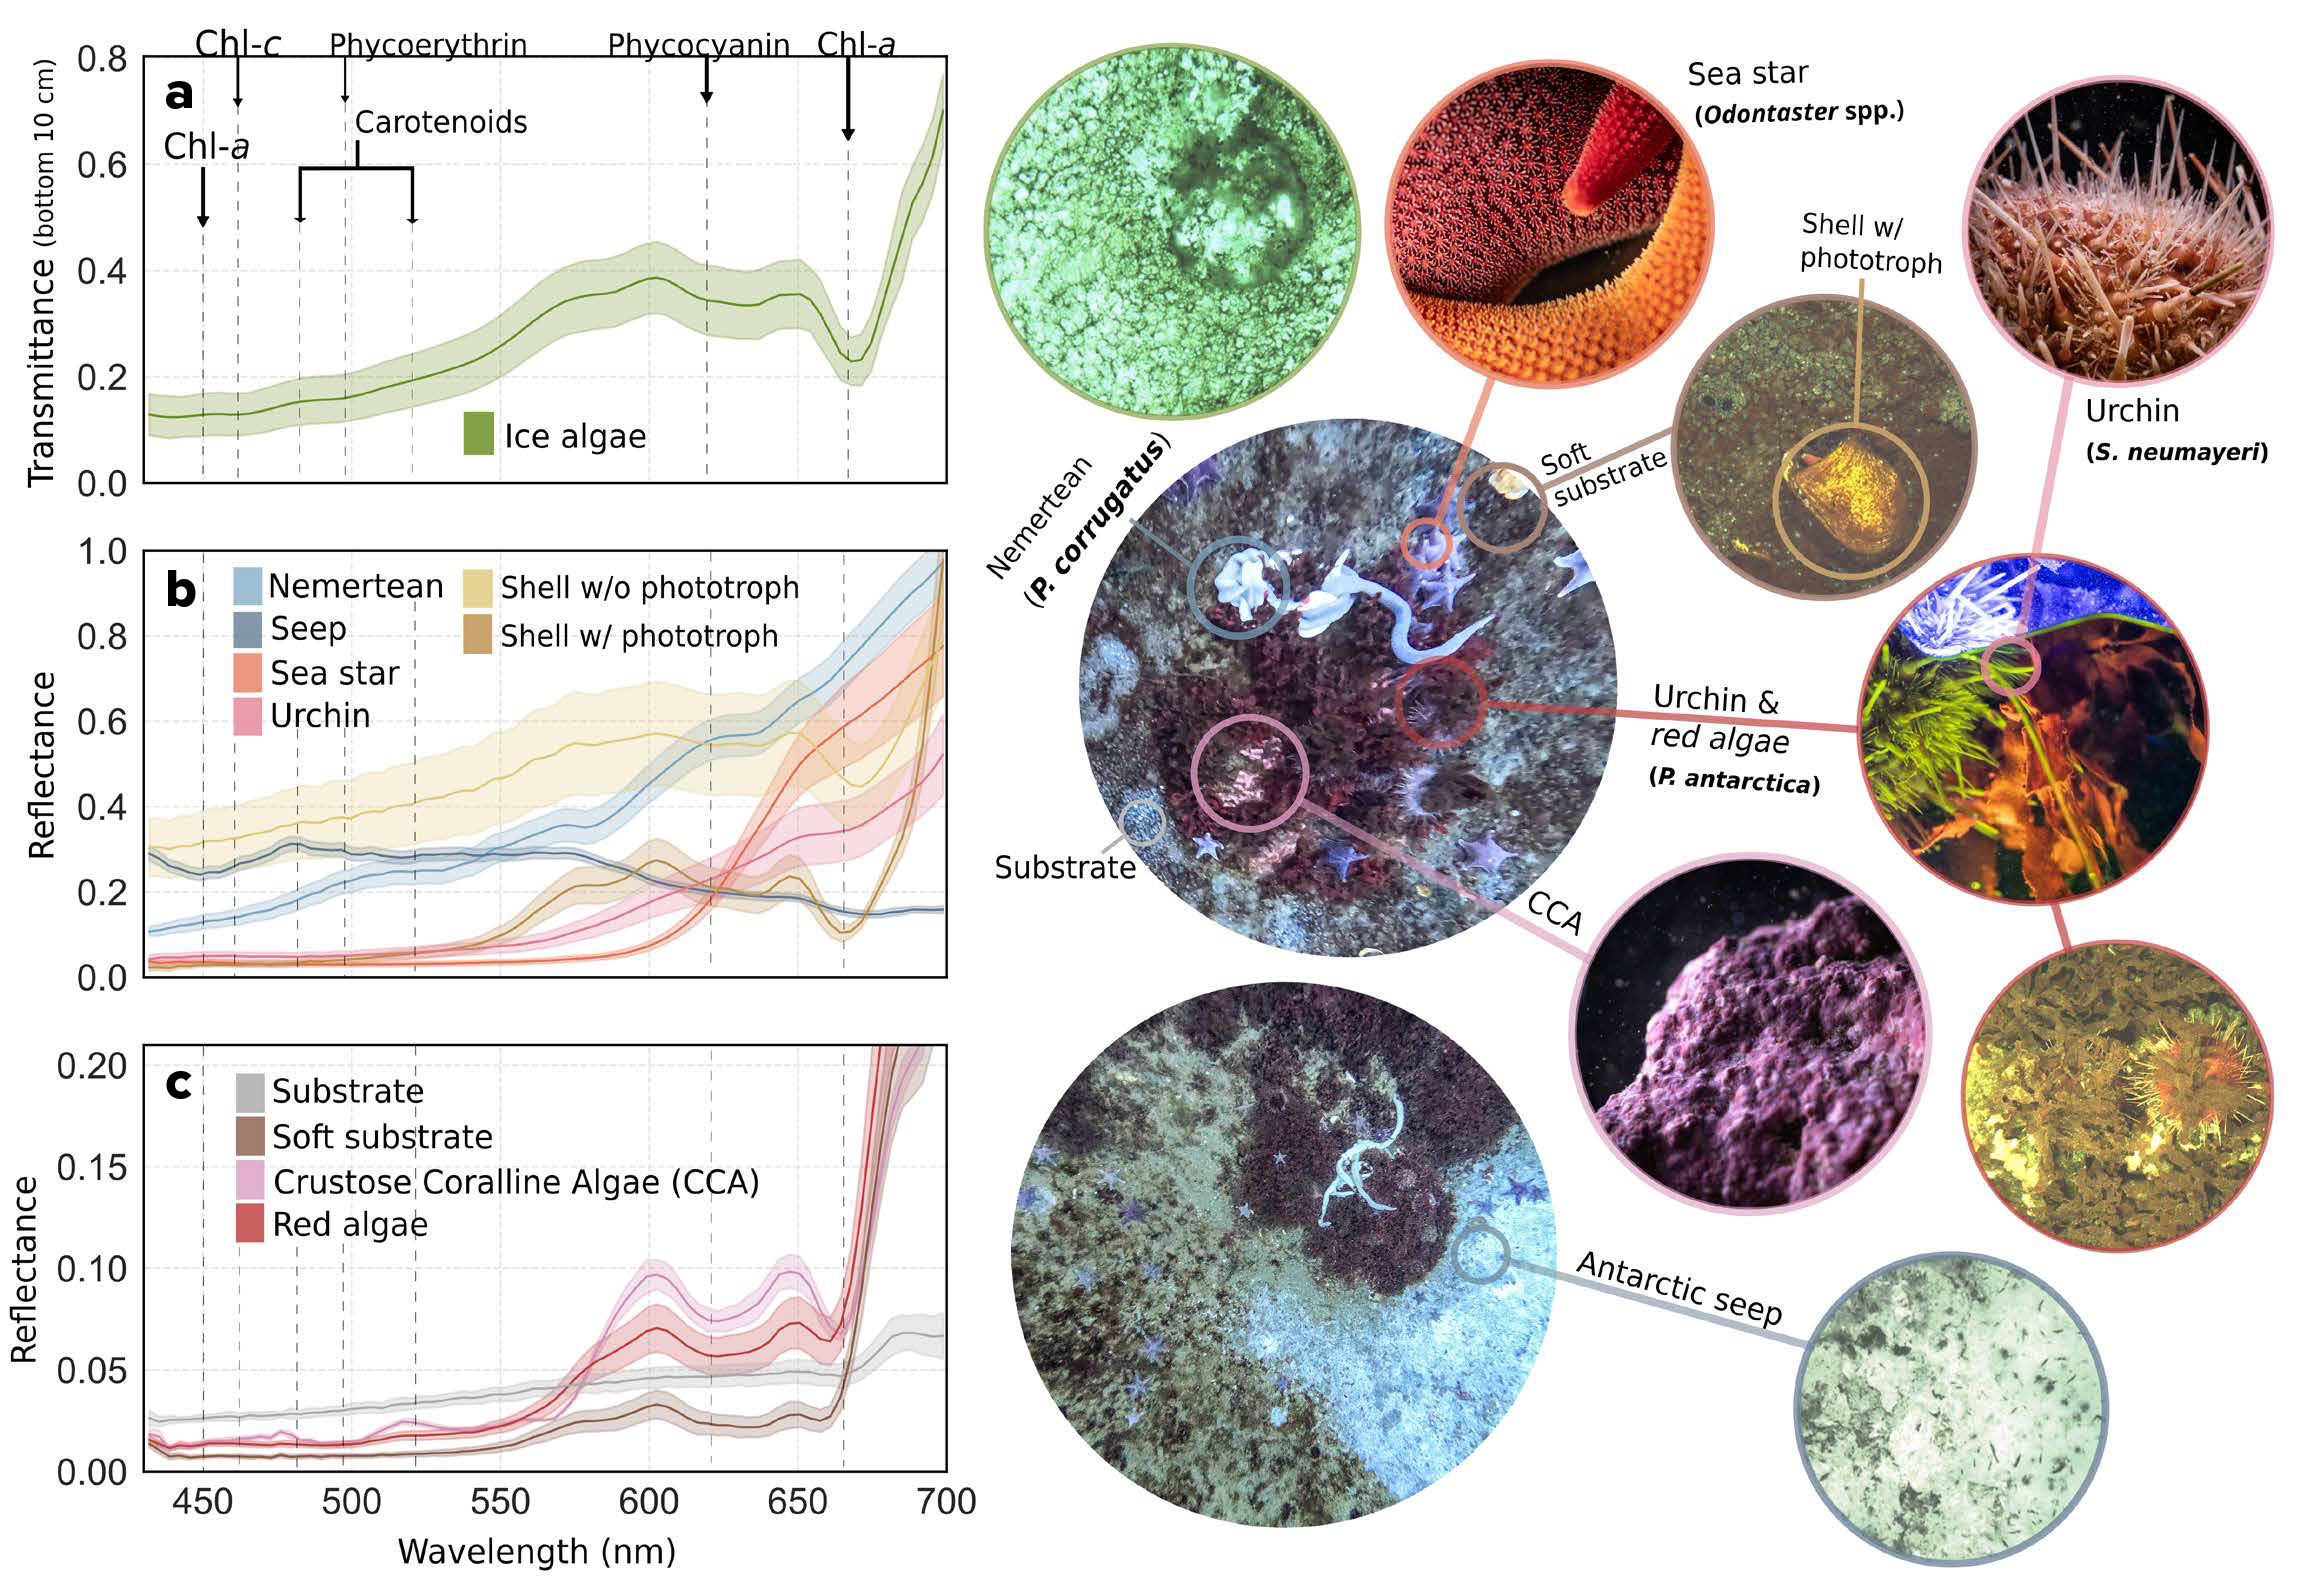
FIGURE 4. Comparison of pixel-derived spectral signatures from sea-ice and seafloor features. (a) Sea-ice spectra represent transmitted light through ice-algal layers, while seafloor spectra (b) and (c) indicate reflectance from benthic surfaces. These distinct spectral “fingerprints” reveal substrate contrasts and highlight biological phototrophic pigment absorbance (e.g., Chl-a, carotenoids, phycoerythrin) that characterize photophysiology. Observed organism structural complexity, illumination, and imaging conditions can, however, influence these signatures, underscoring the need for further empirical calibration to develop targeted bio-optical models. > High res figure
|
FUTURE DEVELOPMENTS
The HIcyBot system is transitioning from a proof-of-concept to a functional monitoring toolkit, with the potential to enable remote observations of under-ice ecological and biogeochemical processes that are otherwise too difficult to sustain. Such efforts aim to be integrated within broader, standardized long-term observation programs at representative sites like those coordinated by the Antarctic Nearshore and Terrestrial Observing System (ANTOS) Expert Group, and may ultimately evolve into fixed, station-like robotic observatories with edge artificial intelligence capabilities, forming part of integrated coastal monitoring networks.
The UHI community now faces a pressing need for developing standardized protocols in georectification, radiometric correction, and reflectance calibration to fully unlock the technique’s potential. Encouragingly, efforts are already underway to establish greater consistency and rigor to this emerging research field (Løvås et al., 2022; Liu et al., 2024).
Broader implementation also depends on both technology and accessibility. Given the high costs and logistical complexity of UHI and Antarctic work, maximizing data cost performance remains critical. Identifying the most informative narrow spectral bands will support the creation of simpler, lower-cost multispectral systems and help to democratize underwater spectral imaging applications.
Acknowledgments
This research was supported by the Australian Research Council Special Research Initiative, Australian Centre for Excellence in Antarctic Science (project number SR200100008), and the New Zealand Antarctic Science Platform (K882-2324-A RSRED – Benthic Sentinel Sites; Ministry of Business, Innovation, and Employment Grant/Award Number MBIE ANTA1801). We are grateful to staff at Antarctica New Zealand for their field-based operational and logistical support. Mechatronics support was provided by Adept Turnkey Ltd. and the UTAS Central Science Laboratory, with special thanks to Sean Sarikas and Philip Hortin. This work contributes to BEPSII Task Group 2: New Technologies.