Background
Water level monitoring, involving the collection of in situ free surface elevation measurements, is critical for understanding environmental exposure and flood risk, especially in populated coastal areas (Merrifield et al., 2009). In particular, water level records are needed to understand the combination of processes (e.g., tides, storm surge, wave events) that dictate local and regional variability, particularly during extreme conditions (Smith et al., 2019; Sweet et al., 2022). Given projected increases in coastal flooding and inundation associated with sea level rise (IPCC, 2021), water level monitoring will be increasingly important for risk assessment and adaptive planning (Ablain et al., 2017; Cipollini et al., 2017; IPCC, 2021).
A recent report (Sweet et al., 2022) suggests that sea level is expected to rise along US coastlines on average 25–30 cm between 2020 and 2050 (measured as additional sea level rise above what was already observed from 1920 to 2020). The report also predicts marked increases in high tide flooding (also known as “sunny day flooding”)—that is, the events where astronomical high tides disrupt or damage communities even in the absence of storms. However, despite its societal value, water level monitoring is typically the domain of specialists with experience in deploying expensive instruments with measurements referenced to established datums. Specifically, Sweet et al. (2022) note that “the NOAA tide-gauge network is relatively sparse compared to the density of coastal communities.” There is a need for an open-source and low-cost water level monitoring instrument that can be easily assembled, programmed, and deployed by a wider range of practitioners in order to increase the density of water level observations, validate projections and forecasts (Loftis et al., 2019), and educate the public. As one specific example, the American Geophysical Union’s Thriving Earth Exchange—the AGU’s active community science network—has ongoing projects geared toward water level data collection and flood mitigation efforts (https://thrivingearthexchange.org/project/coastal-communities-us/) that could potentially benefit from lower cost instrumentation.
In addition to its scientific and societal value, water level monitoring is a strong fit for ocean and environmental science and engineering educational applications for several reasons: devices can be easily deployed and maintained without the need for more sophisticated and expensive diving or research vessel-based deployments—they can be located in comparatively accessible areas, including on waterfronts and in flood-prone areas on land; the sensor principles of operation are well described and accessible (Mohammad, 2009; Kelemen et al., 2015); the utility of water level monitoring extends far beyond basic research and into everyday societal need and can be connected to a wide array of lessons in multiple subjects. Especially in coastal communities where sea level rise is a looming concern, building and deploying a water level sensor provides an excellent opportunity to engage students and their communities in the significance and importance of monitoring water level in their own backyards.
The sensor package described here was originally created in the Scripps Institution of Oceanography Sandbox Makerspace in collaboration with the Birch Aquarium at Scripps and the San Diego Unified School District. The goal of the project was to develop a sensor that high school students could assemble, calibrate, and test in classroom settings, and then deploy during field trips to the Seaport Learning Center in San Diego, California. These field trips were unfortunately postponed due to the Covid-19 pandemic; however, the sensor design was completed.
A second set of designs and lessons was developed for the University of Hawai‘i (UH) at Mānoa’s undergraduate Surf Science and Culture Lab class offered by the Department of Ocean and Resources Engineering (ORE 203L). For the ORE203L class, there were four components to the “Do It Yourself” (DIY) water level sensor lab exercise: (1) holding a data analysis lab where the students learned about tides, sea level rise, sampling strategies, and sensing technologies in the field of oceanography; (2) building the DIY water level sensor; (3) calibrating and deploying the sensors at the UH Marine Center in Kakaako, Hawai‘i; (4) recovering the sensors, processing the data, and comparing them to the local tide station (see Supplemental Materials for more details). The updated version, described here, was refined by a US National Science Foundation (NSF) Research Experiences for Undergraduates (REU) student researcher at the University of North Carolina Wilmington. Sensors have been constructed and deployed by students (including many with little-to-no prior sensor development experience) in California, Hawai‘i, and North Carolina, including an 18-day deployment at the Center for Marine Science, Wilmington, North Carolina.
Design of the Distance Sensors
Design constraints included that the sensor must be (1) comparatively low cost (a couple hundred dollars or less for all necessary components), (2) constructed of entirely off-the-shelf parts (no custom printed circuit boards), with widely adopted form factors for future-proofing (e.g., following the Feather specification: https://learn.adafruit.com/adafruit-feather/feather-specification), and (3) programmable using the Arduino integrated development environment and Arduino’s wiring language so that students with varying backgrounds could quickly learn the skills to build and program devices themselves. The parts list, assembly procedure, and code are open source so that this instrument could be an accessible DIY project either within or outside of class settings. In this section, we outline the technical details of the sensor components and provide a high-level overview of the assembly, deployment, and data analysis routines. For more step-by-step details, including firmware, enclosure designs, an assembly guide, and data analysis examples, please visit https://github.com/SUPScientist/Seaport_Tide-SLR.
Materials and Costs
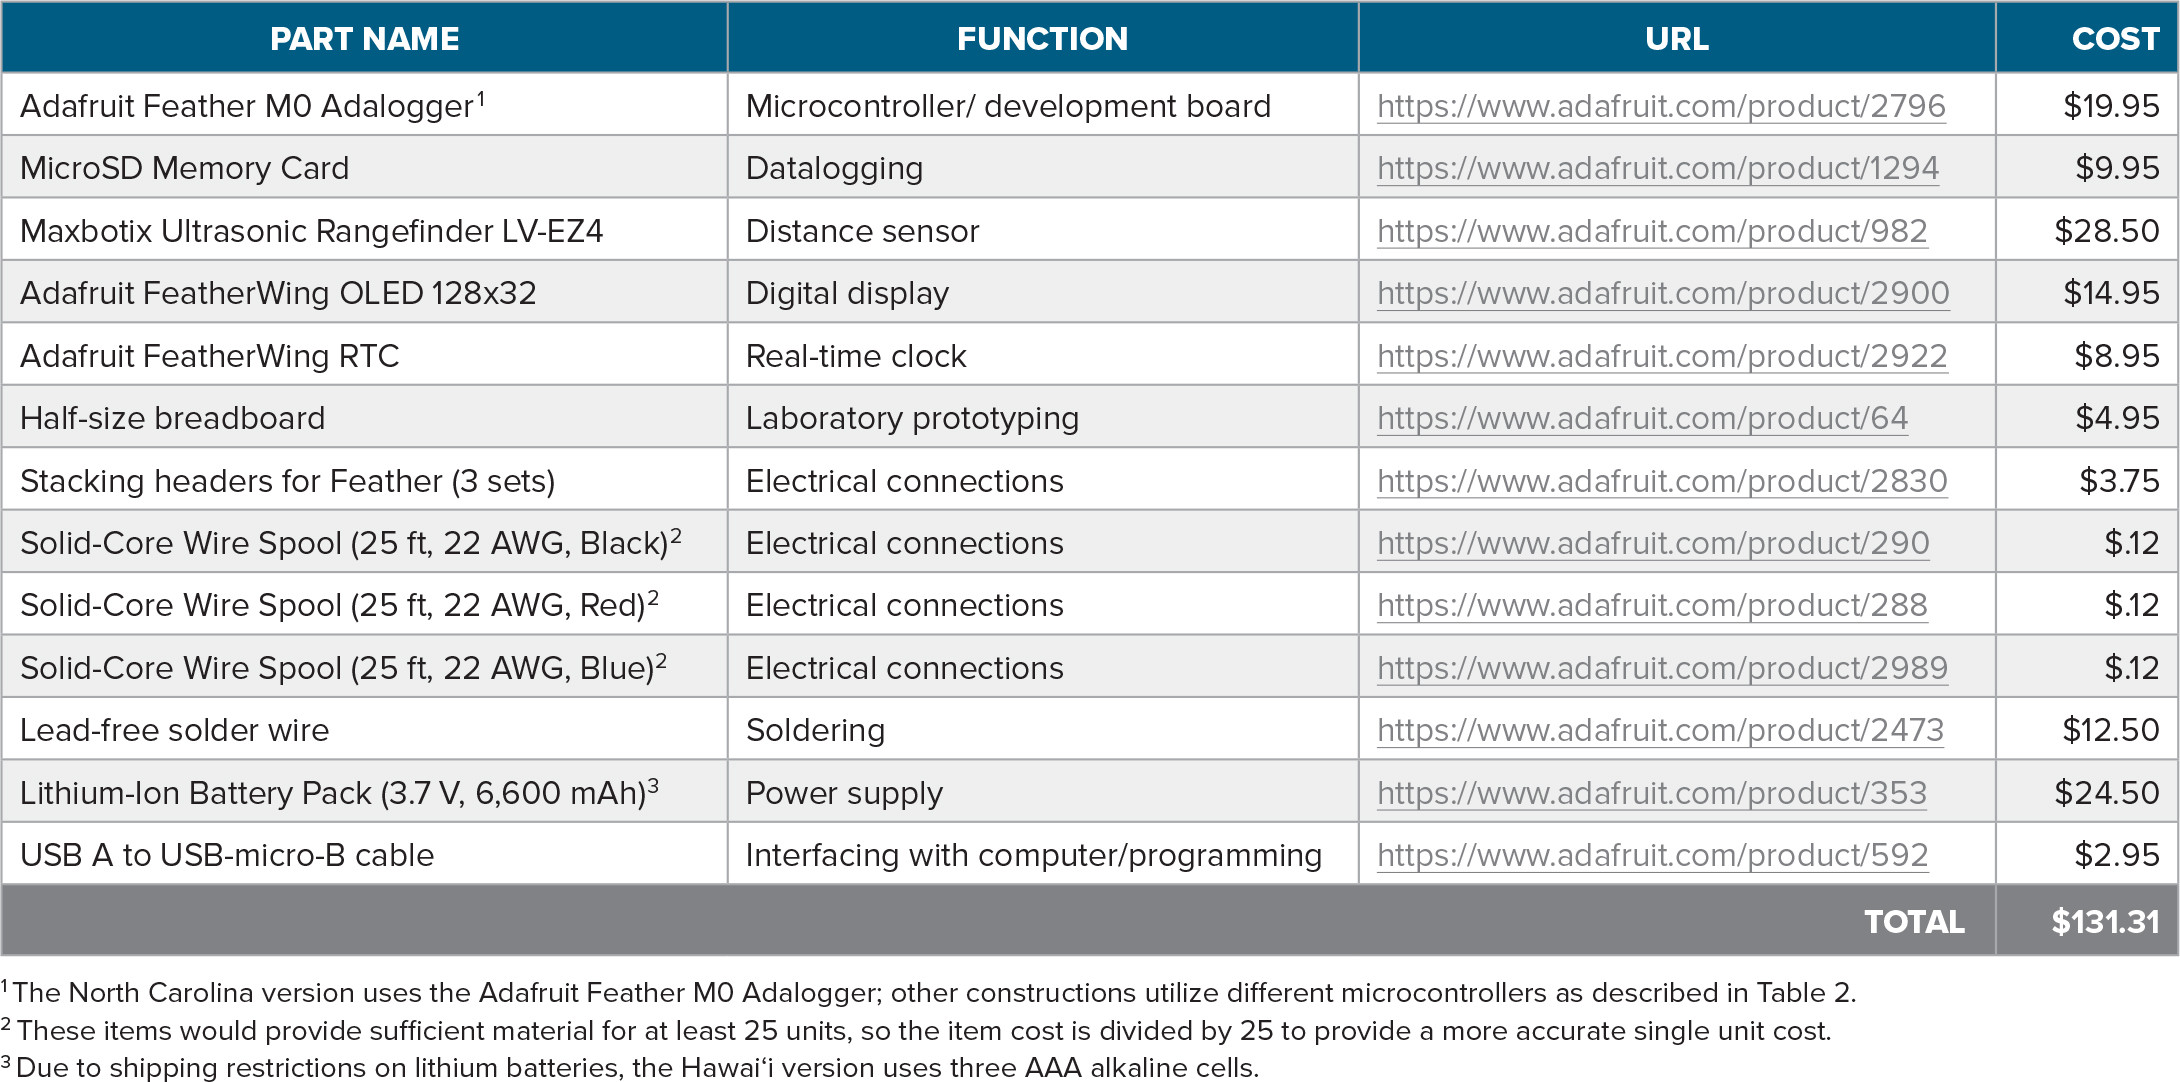
Table 1 and Figures 1 and 2 list and illustrate sensor design and assembly. The electronics comprise a battery, a microcontroller with microSD logging capabilities or a microcontroller and microSD logging add-on board, a microSD card, a display, a real-time clock (RTC), and an ultrasonic distance sensor (Figure 1). Note that there is no need for two microSD peripherals (as shown here on both the M0 Adalogger Feather and the Adalogger FeatherWing RTC + SD; the latter is used solely for its RTC capabilities). The first versions of the sensor/datalogger did not include an RTC, but we observed marked improvements in timing and power consumption after its addition due to the ability to use lower-power sleep states in between samples. Average current consumption is 5.5 mA, which provides for 76 days of operation with the 10 amp-hr battery. Every day, 5.6 KB of data are recorded (or only 2 MB per year).
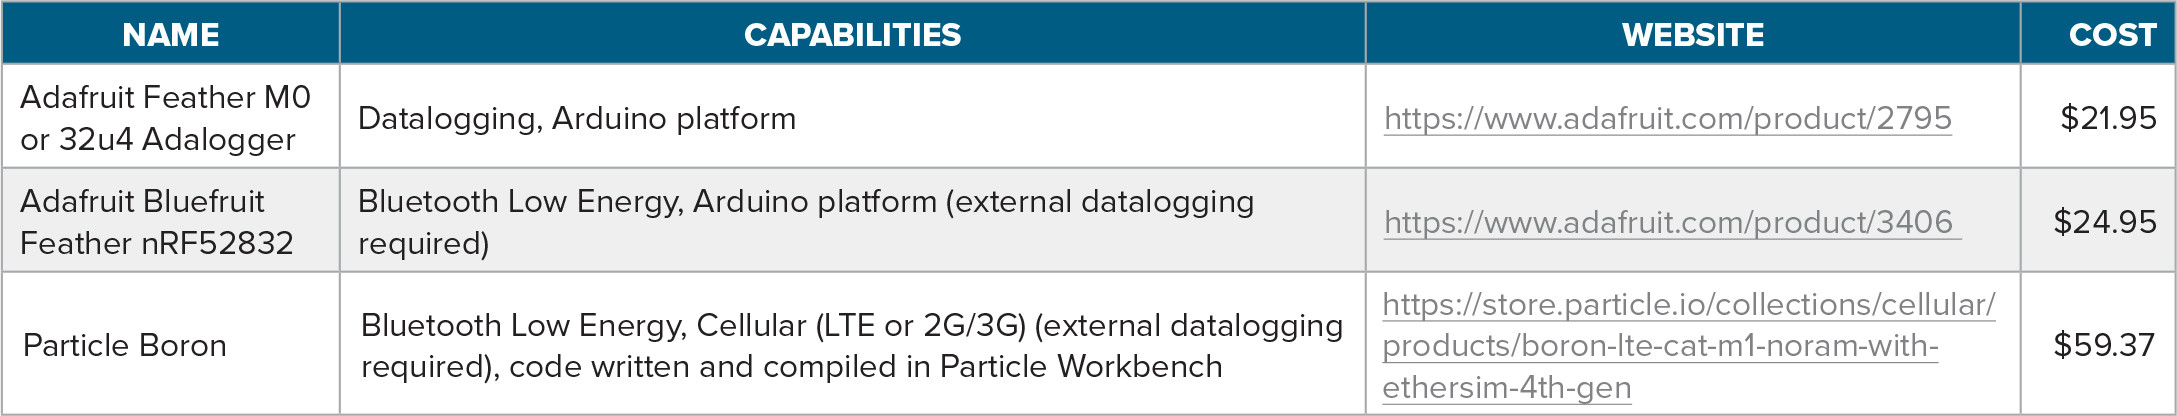
TABLE 1. Bill of materials, including links to parts from Adafruit for ease of sourcing. All parts are also available elsewhere or have comparable replacements. Prices listed were those available at the time of publication. A microSD card reader is also helpful but is not listed below in the bill of materials for the sensor itself. > High res table
|
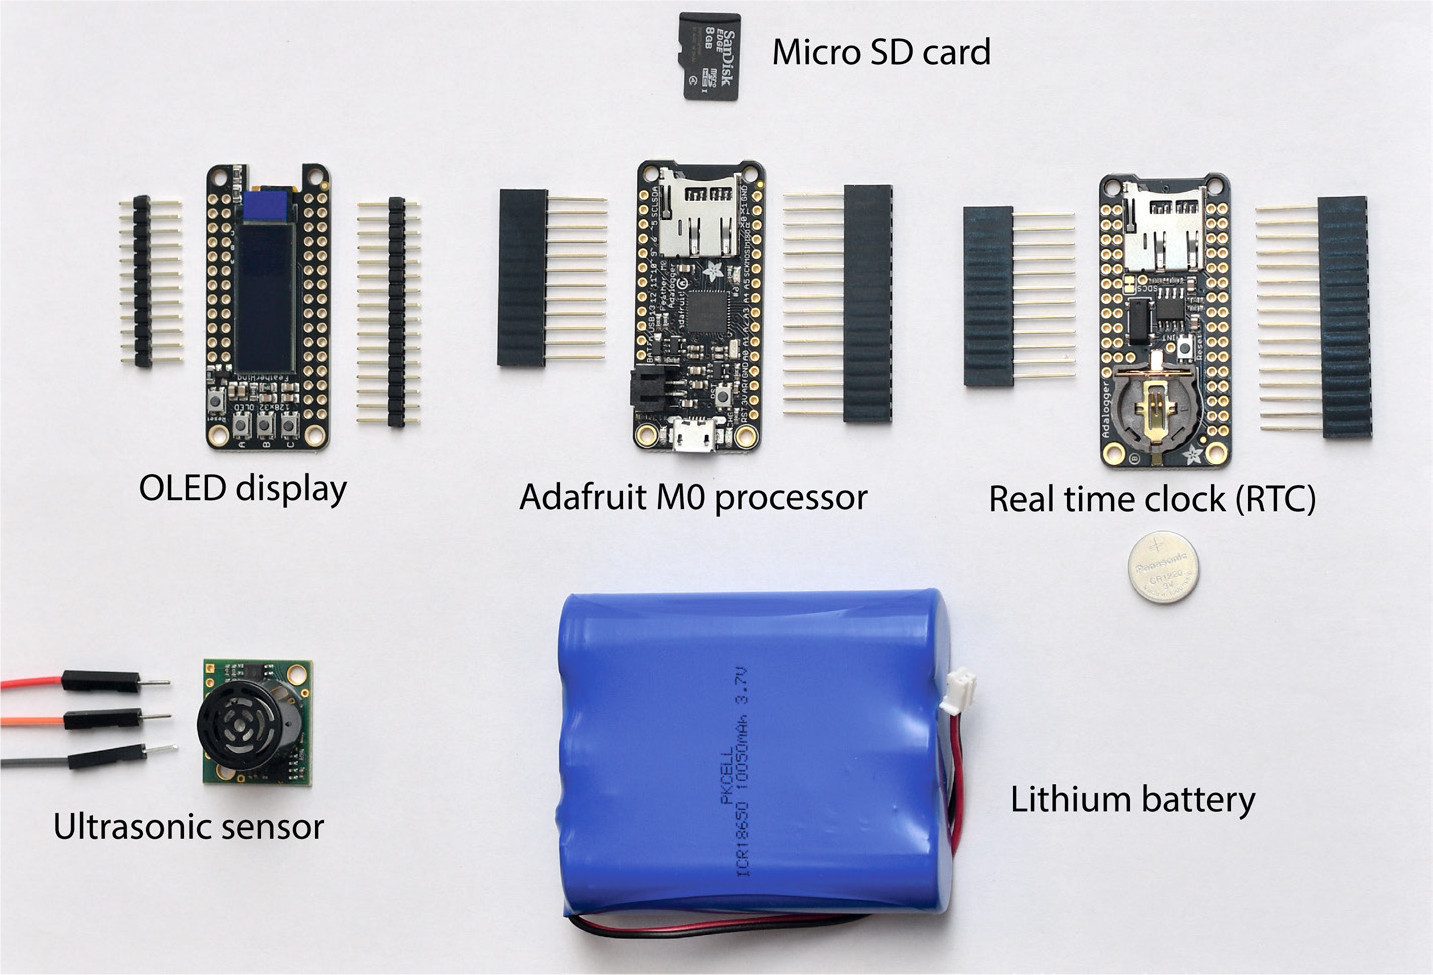
FIGURE 1. Electronic components of the water level sensor, described in the text and in Tables 1 and 2. Note that the rechargeable lithium battery shown here can be swapped out for alkaline batteries if desired. Assemblies are shown in Figure 2. > High res figure
|
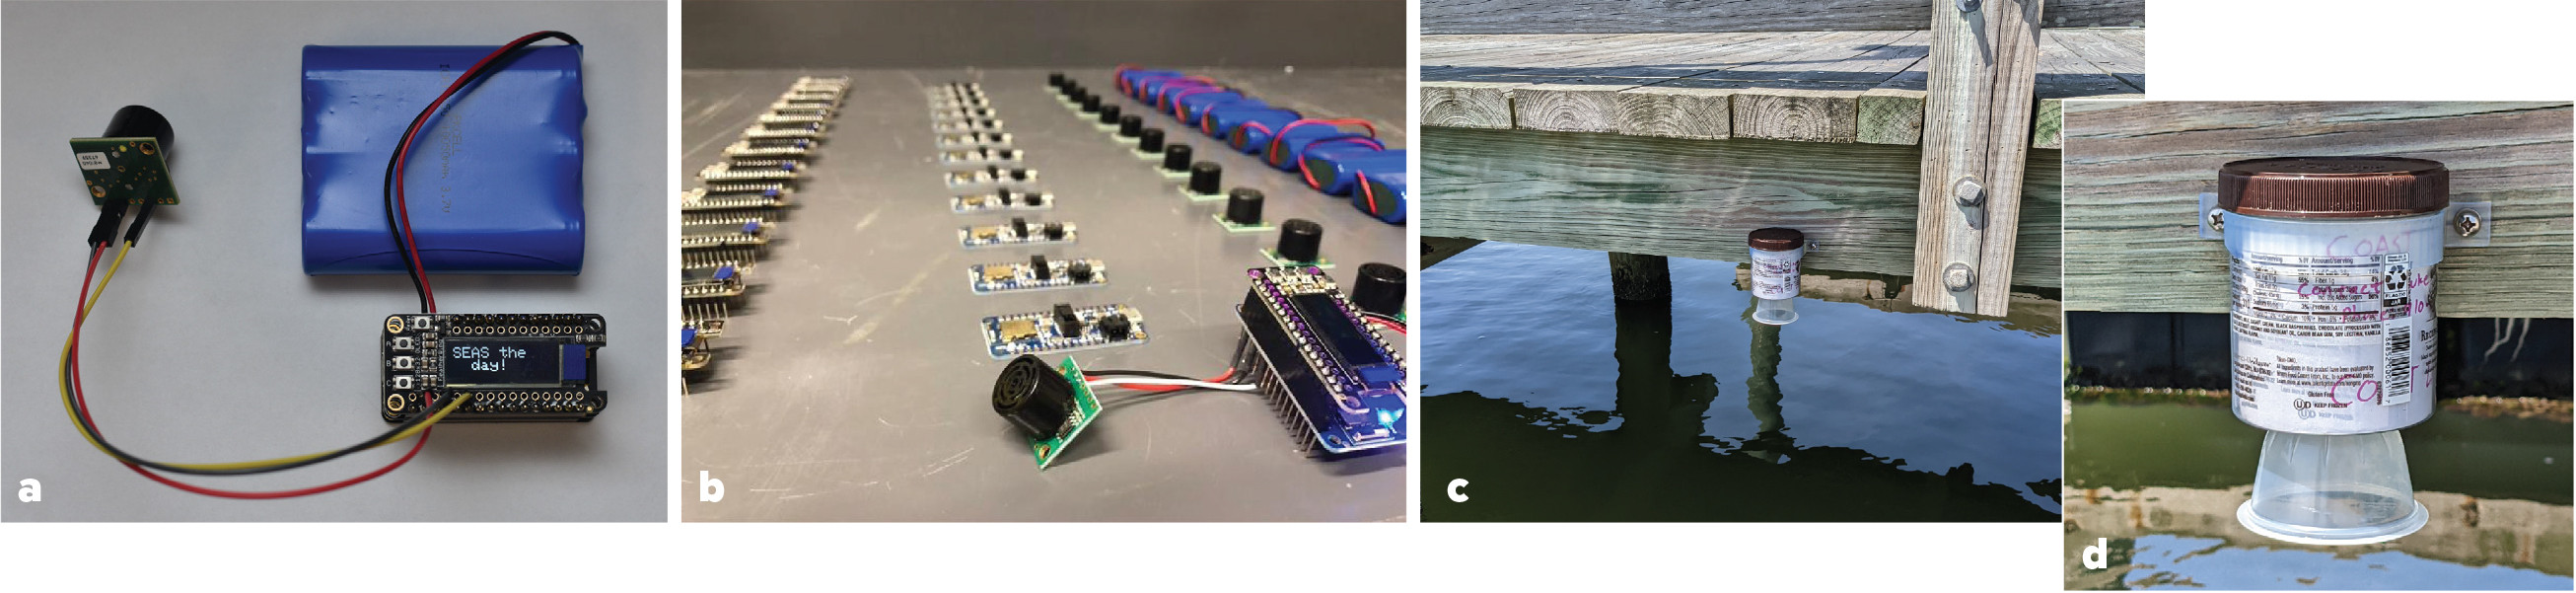
FIGURE 2. (a) One assembled set of water level monitoring electronics. (b) Components for an additional 12 units for the San Diego field trips. (c) North Carolina sensor on the Center for Marine Science dock in Wilmington, North Carolina. (d) Same location, zoomed in to show the mounting bracket screwed into dock. > High res figure
|
The water level sensor relies on an ultrasonic distance sensing component: the Maxbotix MB1040 LV-MaxSonar-EZ4 (hereafter, “MB1040”). This acoustic sensor is based on principles that are similar to those for a variety of other oceanographic sampling methods (e.g., echosounders, acoustic Doppler current profilers), further motivating its use in educational settings. The MB1040 was selected for its range (15–645 cm); its resolution (2.5 cm); its accuracy (5 cm); its maximum sampling frequency (20 Hz); its narrow beam, which reduces interference from nearby objects and improves selectivity for the water surface (as opposed to interferences from nearby objects, like pier pilings); its cost ($24.95 at time of writing); its interfacing options (e.g., analog, pulse-width modulation, and RS232 serial); its low power draw and voltage requirements (~2 mA at 2–5 V, making it easy to interface with 3.3–5 V microcontrollers); and its principle of operation (i.e., ultrasonic rangefinding). The MB1040 operates at 42 kHz.
We tested several different microcontroller development boards and peripheral devices for different applications and across different price ranges (e.g., real-time cellular communications, OLED screen for visual display, onboard datalogging). For example, a version based on the Adafruit M0 or 32u4 Adalogger models with peripheral displays enabled both real-time readouts and integrated microSD datalogging. We developed a version based on the Particle Boron (a cellular Internet of Things [IoT] microcontroller that also follows the Adafruit Feather specification), which enabled real-time remote communication with the device, including the updating of a cloud-based datasheet. Lastly, we tested an nRF52832 Bluefruit Feather in order to explore Bluetooth Low Energy options and to open the possibility of students designing mobile applications to communicate with the water level monitor. We provide firmware for each of these microcontrollers in the Supplemental Materials, though we did not develop a mobile app to accompany the Bluefruit. We refer hereafter to our primary DIY sensor as the North Carolina version, which used the Adalogger M0.
All of the microcontroller options (see Table 2) are built into development boards following the Feather specification from Adafruit (https://learn.adafruit.com/adafruit-feather/feather-specification). In brief, Adafruit specifies the physical form factor, pin placement (e.g., analog/general purpose inputs and outputs or GPIOs), USB interfacing, and use of 3.3 V inputs and outputs, among other standards in power management. Consequently, the designs described here allow for simple interchangeability of the microcontroller without needing to change placement of peripheral devices such as the OLED screen or ultrasonic sensor. Additionally, the Adafruit Feather nRF52 Bluefruit and the Adafruit Feather Adaloggers use the Arduino Wiring coding language with code that can be programmed, compiled, and flashed from within the Arduino integrated development environment (or IDE). The Particle Boron uses a branch of the wiring language, resulting in considerable overlap across firmware for all three versions. The Arduino and VS Code IDEs and the Particle Workbench extension (used for the Boron) are all freely available and straightforward to install on Windows, macOS, and Linux operating systems.
TABLE 2. Description of microcontroller options and their capabilities. Choose one of the following to serve as microcontroller/development board in Table 1. Prices listed were those available at the time of publication. > High res table
|
Sensor Assembly, Calibration, Deployment, and Data Analysis
The simplest electronics assembly requires only three wire connections to the distance sensor for minimal soldering: power (3V3 on microcontroller board to 5V on sensor), ground (GND to GND), and analog input (A1 on microcontroller to AN on sensor). The RTC and OLED FeatherWings are placed on top of the Feather microcontroller/datalogger, and the microSD card and battery are plugged into their proper slots. The three wires to the distance sensor can be soldered to either the Feather or FeatherWing boards, as the pins will be shared among the three once they are stacked as shown in Figure 2a. Once assembled and placed into the complete housing, the distance sensor must point straight down at the water with an unobstructed view for the most accurate readings.
Two unique sensor housings were developed: a water resistant, upcycled clear plastic ice cream jar for the North Carolina and Hawai‘i versions, and a laser-cut acrylic housing for the high school student assembly in San Diego. In the former, a hole was cut in the jar for the rangefinder to gain an unobstructed view of the water surface. Because the exposed region of the rangefinder is not weatherproof but needs to be obstruction-free, an upcycled plastic cup was secured to the jar to provide some protection against rain during deployment (Figure 2c,d). The San Diego housing was designed to provide a hands-on assembly experience but not for unattended deployments and, consequently, was not designed to be waterproof. Instead, the San Diego version used off-the-shelf screws and nuts and a custom laser-cut enclosure that students were to be instructed to assemble during classroom activities prior to their field trips (see Supplemental Materials for enclosure designs). A custom three-dimensional printed bracket was used to fasten the North Carolina version to the Center for Marine Science research pier in Wilmington, North Carolina. Care was taken to ensure that the sensor package was installed level so that the ultrasonic sensor was pointing straight down at the water’s surface.
The microcontroller’s analog input and onboard analog-to-digital converter (ADC) convert the sensor reading to digital counts that can then be converted to physical distances in two ways. The first option utilizes the MB1040’s datasheet conversion equation, which divides the ADC’s recorded voltage by the scaling factor of (Vcc/512) per inch. Vcc is the voltage supplied to the MB1040: 3.3 V for our microcontroller. The second option, given the sensor’s linear voltage-to-distance response, is to convert from counts to inches by individually calibrating each unit and applying linear corrections in the form of sensor gain (or slope) and offset (intercept). We recommend this latter option for both educational and research applications, as it prevents a false sense of confidence in the sensor’s output and requires manual calibration rather than blind trust in the manufacturer’s equation. Our firmware logs sensor values in uncalibrated inches (imperial units used in this step rather than metric because this sensor was designed to report in imperial, following the scaling equations above). We calibrate the sensors after fully assembling them into their water-resistant packages by recording the rangefinder output at five fixed distances (12'', 24'', 100'', 150'', and 200'') from a wall. After calibration and conversion, all field data are reported in metric units.
The North Carolina sensor was deployed on the University of North Carolina’s Center for Marine Science research pier for 18 days in June and July 2022. Tropical Storm Colin made landfall in North Carolina on July 3, 2022, and resulted in a local maximum windspeed of 17.4 m s–1 and 5.8 cm of rain in approximately 36 hours according to https://www.weather.gov/ilm/. Two commercial water level sensors are also operated on this pier: a Campbell Scientific CS475A Radar Water Level Sensor and a Green Stream Technologies Ultrasonic Water Level Sensor Kit. Data for both commercial sensors are referenced to NAVD88 (the North American Vertical Datum of 1988) and are available in real time and for download from the Coastal Ocean Research & Monitoring Program (CORMP; https://cormp.org). The DIY and commercial sensors are all programmed to log data at six-minute intervals, beginning on the hour.
Once our DIY sensor is powered (i.e., the battery is connected), it begins logging data (elapsed time and distance to the water) to the microSD card at six-minute intervals using a 10-second average of distance measurements. To compute the average, 200 points are sampled at 20 Hz (the sensor’s maximum frequency), the highest and lowest 10 values are eliminated, and the remaining 180 samples are averaged. This approach reduces noise from sensor interferences or fleeting signals, such as from short period surface gravity waves, though we note that alternative sampling schemes may need to be considered for certain research and operational applications. To convert the measured distance between the airborne sensor and the water surface to water level, we inverted the sensor readings such that
H = a – x, (1)
where H is the water level, a is a constant representing the sensor’s fixed position, and x is the sensor’s reported distance. For this educational application, a is chosen using a simple guess-and-check procedure wherein values are refined until a graph of H vs. time from the DIY water level sensor agrees with H vs. time from the CORMP Campbell Scientific gauge (by iteratively minimizing the mean difference between the two time series). For operational deployments, a more rigorous calculation of a would require surveying to a known datum and correcting x for changes in sound speed (due to, for example, temperature and humidity variations). For inland flood detection applications, a could instead be defined as the distance from the sensor to the monitored surface, such as a roadway.
Results and Discussion
A linear calibration correction was conducted as described in Methods. Figure 3 shows the results of the calibration and the improvement of our calibration (black line) over the factory calibration (red line). The data from the field deployment were calibrated using the resulting slope/gain of 0.502 inches (1.28 cm) per ADC count and offset of –0.582 in (1.48 cm). Prior to calibration, the root mean squared error (RMSE) of sensor values vs. actual values was 0.811 in (2.06 cm); post-calibration RMSE was 0.704 in (1.79 cm). (As noted above, we report inches in this step because the sensor is designed to output inches.)
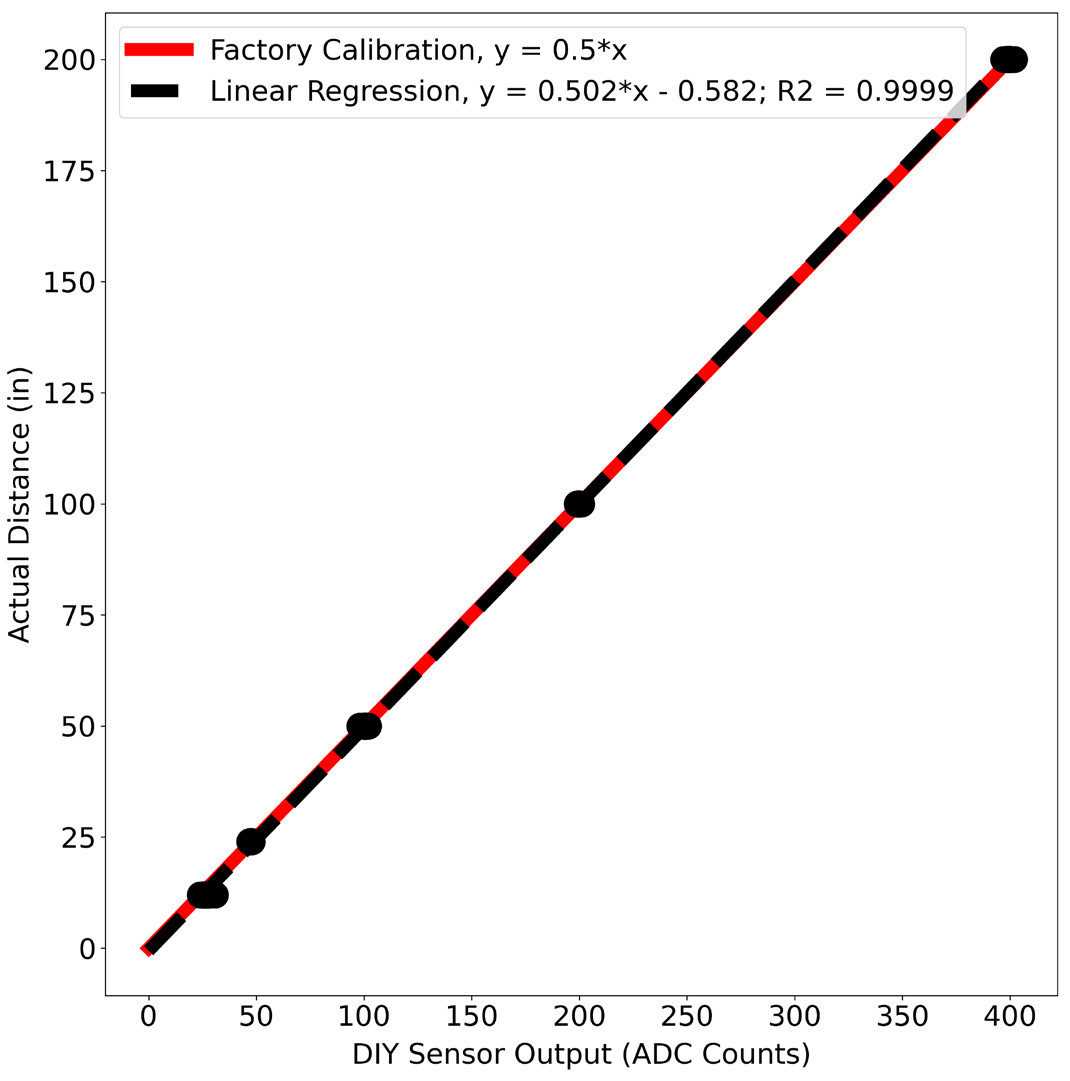
FIGURE 3. Sensor calibration results. Red line depicts the factory calibration and the datasheet’s recommended conversion from analog-to-digital converter (ADC) counts for a 10-bit ADC to distance in inches; black line shows the student calibration to convert from counts to distance. > High res figure
|
Figure 4 shows the results of the North Carolina deployment. There is no visual difference among the three sensors in the top panel. For quantitative comparison, additional processing was required. All sensors were programmed to log data at six-minute intervals, beginning on the hour. However, we detected a small shift in the timing of the DIY sensor (recording took place roughly every five minutes and 57 seconds) due to a firmware error. We note that this timing shift still resulted in accurate timestamps, but at slightly shorter than intended intervals. This shift is not the same as clock drift, which would result in inaccurate timing. To resolve this issue for the sake of comparison with the commercial sensors, we linearly interpolated the DIY sensor values onto the Campbell Scientific sensor timestamps for further comparison, noting that this adjustment could lead to small discrepancies between sensors that are not necessarily due to sensor inaccuracy. The mean anomaly between our DIY sensor and the Campbell Scientific commercial unit (Figure 4b) was forced to zero via the setting of a in Equation 1. The root mean squared error between the DIY and Campbell Scientific sensors was 1.5 cm. Some of this discrepancy can be attributed to the interpolation method rather than sensor accuracy, though this artifact is difficult to quantify. Supporting this claim is the fact that the largest anomalies (Figure 4b) tend to occur when the slope of the water level curve is changing the fastest (i.e., near high and low tides), which would correspond to times when a linearly interpolated time series would fit the actual water level the worst. This artifact also leads to the cyclical (rather than random) nature of the anomaly time series. Infrequent outliers, such as the 0.35 m anomaly on July 7, 2022, can likely be attributed to non-sensor-related issues such as objects floating on the surface of the water. In summary, the roughly $100 DIY water level sensor provided results quantitatively similar to those from the commercial CORMP tide gauges after the calibration and offset procedures described above, demonstrating the quality and value of this instrument. Simple firmware and/or hardware modifications could further improve data quality, as we describe below.
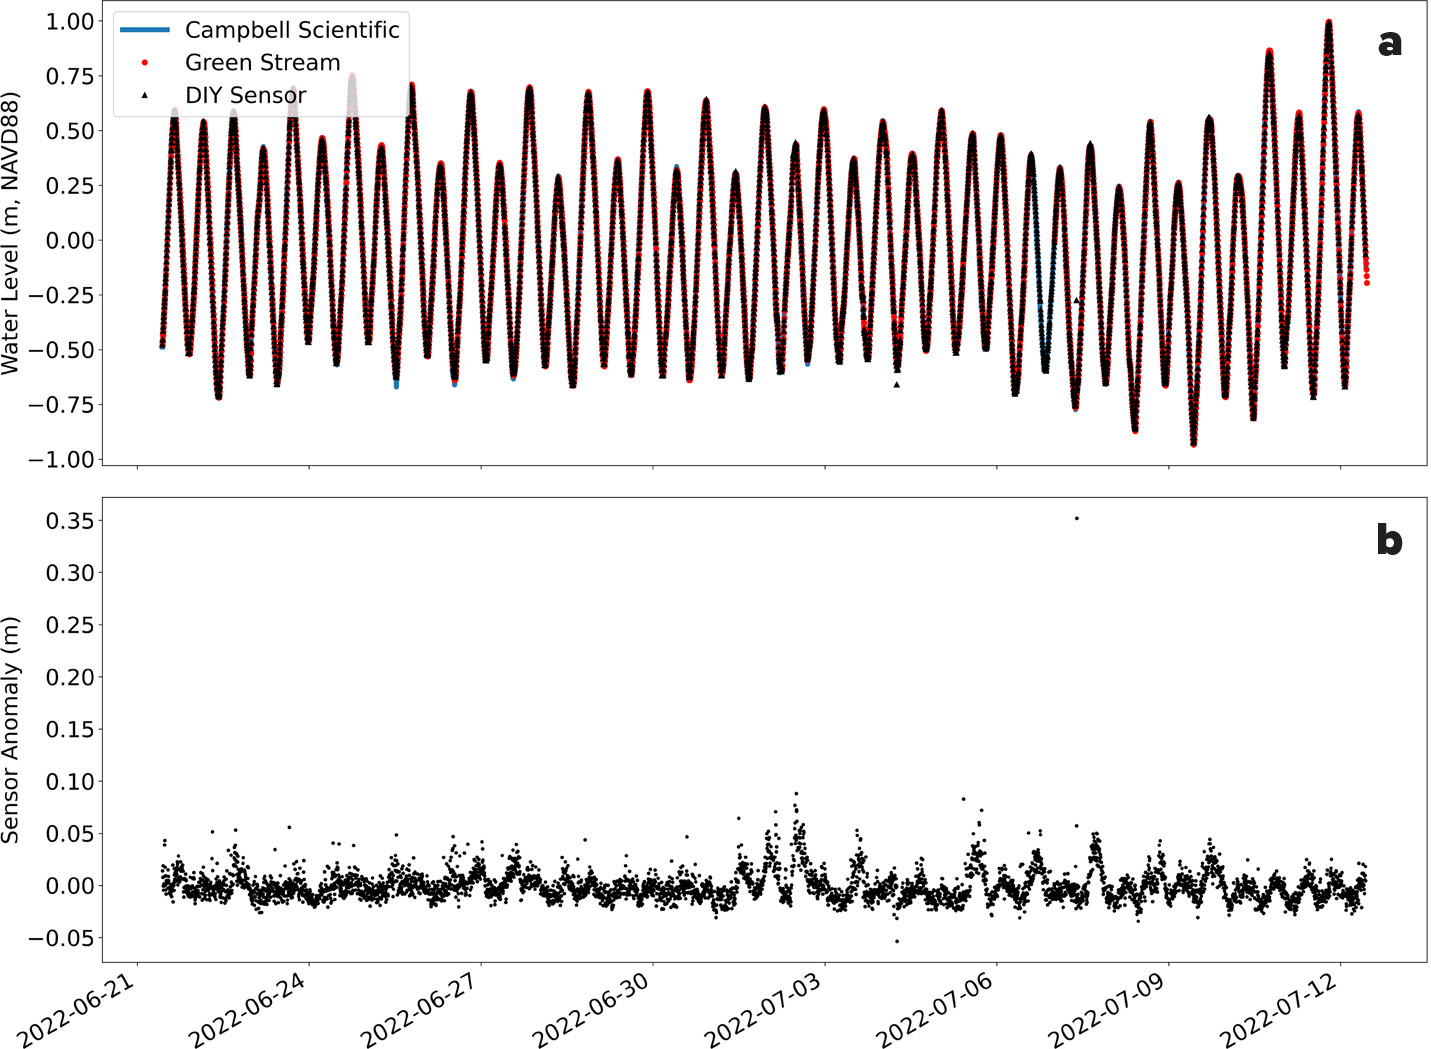
FIGURE 4. (a) Processed water level data from the do-it-yourself (DIY) sensor collected at the University of North Carolina Wilmington’s Center for Marine Science (black dots) overlaid on water level data from two nearby commercial tide stations (blue line and red dots). It is difficult to see the three distinct sensor time series due to their close agreement. (b) Anomaly between readings from the DIY sensor described here and the commercial Campbell Scientific sensor. > High res figure
|
Possible Modifications
The current version of the DIY water level sensor provides the basis for impactful, hands-on, interdisciplinary lessons and yields accurate field observations. However, there are several modifications that could improve the design and result in superior resolution and accuracy, potentially meeting some research and operational needs. In terms of data quality, a higher resolution sensor, such as the MaxBotix HRLV-MaxSonar-EZ4 (1 cm vertical resolution, similar range, and only $5 more), would be advantageous in many applications. The MaxBotix MB7092 XL-MaxSonar-WRMA1 ($99.95) is a ruggedized, waterproof (IP67 rating) sensor and would likely withstand far harsher conditions than the simpler and less expensive versions deployed here. Importantly, however, we note that the North Carolina sensor (non-waterproof LV-EZ4 model enclosed in plastic ice cream jar) suffered no interruptions during Tropical Storm Colin. Finally, the MaxBotix distance sensor output is referenced to its voltage input, which is supplied by the microcontroller boards. Including a voltage regulator, such as the MB7986 from MaxBotix, could aid in measurement stability, although we did not observe a lack of stability in our application and conclude that the microcontroller boards’ on-board voltage regulators suffice for our needs.
Finally, our applications called for an instrument with the ability to monitor changes in water level over periods of hours to weeks. However, other applications would require a geodetic datum, in which case the instrument would need to be surveyed in and referenced to a vertical datum following best surveying practices (NOAA, 2013), after which tools such as NOAA’s Vertical Datum Transformation Tool (VDatum; https://vdatum.noaa.gov/) could be used to yield observations relative to a standard tidal datum. While the time series reported here is 18 days (limited by the end date of coauthor Edwards’s NSF summer REU), the power budget allows for 76-day deployments with a 10 amp-hr battery. A larger battery, solar panels, and/or connection to the electric grid would allow for longer deployments.
Educational Applications
This DIY water level gauge project offered an excellent teaching opportunity to engage students in a hands-on “start to finish” project with real-world applications. For the University of Hawai‘i at Mānoa Surf Science and Culture Lab, this project offered the students an opportunity to learn about: (1) building and deploying simple sensors with breadboarding, writing and loading Arduino-based code, and processing and analyzing the sensor output; (2) sampling strategies and deciding what sampling rate would provide sufficient data to observe changing seawater height compared to other natural phenomena; (3) oceanographic sensing technologies and historical methods compared to more recent advancements in autonomous systems; (4) and what causes changes in coastal water levels such as tidal fluctuations and sea level rise, as well as their implications for coastal communities and ecosystems.
University of Hawai‘i at Mānoa students were provided a kit containing all of the sensor components. They completed a step-by-step exercise (see Supplemental Materials) to assemble and communicate with each component. This involved inserting components into a breadboard and toggling pins high/low to make LEDs blink, writing to the OLED screen, displaying output from the rangefinder to the OLED screen, and then finally saving rangefinder output to an SD card. As described above, the MB1040 has analog, pulse-width modulation and RS232 interfacing options. Students found the analog option to be the easiest to implement.
The students built a support structure to hold the water level sensors that could be pushed out and secured over the edge of the seawall at the UH Marine Center (Figure 5) where research vessels moor. The vertical distance from the seawall to the water was roughly 1.5 m (depending on tide). A plastic tote was secured upside down over the sensors to provide an additional barrier during deployment and to protect the sensors from possible heavy rain or curious birds. The sensors were recovered the following week.
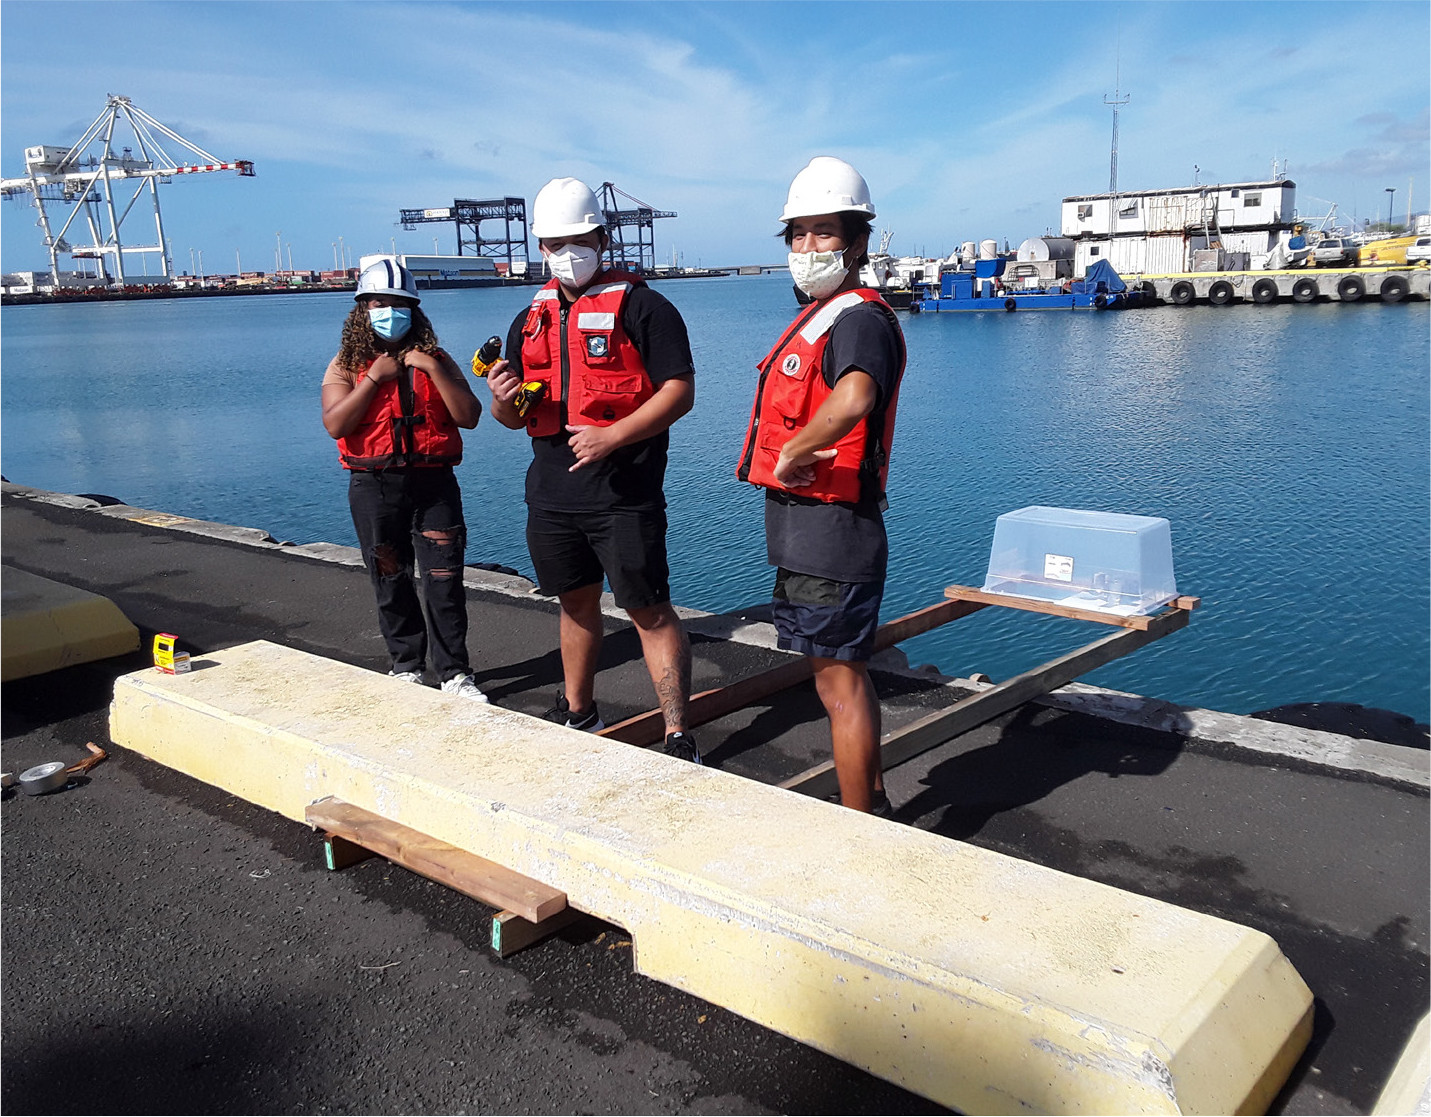
FIGURE 5. University of Hawai‘i at Mānoa students stand next to sensors housed within a support structure at the University of Hawai‘i Marine Center. > High res figure
|
Upon recovery, battery power was removed, and data were downloaded to personal computers from the microSD cards. The students completed a data processing exercise to apply the calibration correction, invert the vertical distance (sensors were looking downward so that a smaller distance from sensor to water corresponds to a higher tidal stage), and compare their sensor output to the local tide station data (NOAA Station 1612340, https://tidesandcurrents.noaa.gov/waterlevels.html?id=1612340).
There was very positive feedback from all of the students who participated in this lab exercise, for example, “The two activities that I enjoyed most were building the tide gauge and deploying it. I thought both of these activities were very fun and something that I have not done before. I enjoyed being able to build the gauges firsthand, program it, deploy it, and see the data” (course evaluation, anonymous ORE 203L student).
Conclusion
We demonstrated the utility of a low-cost, easily constructed DIY water level sensor for educational settings. We combined a MaxBotix ultrasonic rangefinder, real-time displays, and microcontrollers following the Adafruit Feather design specification, and programmed the devices to measure water level within a range of 15–645 cm with a resolution of 2.5 cm. We note that simple modifications could improve resolution to 1 cm. Sensor packages were successfully built, tested, and calibrated in laboratory and classroom settings and deployed in the field by students at the University of North Carolina Wilmington and the University of Hawai‘i at Mānoa. Data from a five-point calibration suggest that the sensor has a linear and predictable response, and comparison of our sensor’s field deployment data with a nearby tide station illustrate good agreement. Sensor accuracy is reported by the manufacturer to be 5 cm, but after a simple calibration procedure, we quantified only a 1.5 cm root mean squared error (for a 10 sec averaged sample every 6 min) between our DIY sensor and a collocated commercial unit. For just over $100, only a small amount of soldering, and installation of ready-to-use code, other students and educators, communities in need of water level monitoring, and potentially researchers can construct a simple but reliable device. Building, deploying, and analyzing data from the sensor can aid in students’ understanding of water level measurements and in the practice of monitoring sea level changes. Ultimately, we believe that this DIY water level sensor can improve ocean and climate literacy while providing a hands-on project that teaches real-world engineering and science skills.
Acknowledgments
The authors thank the Birch Aquarium at Scripps, a grant to Birch from the UC San Diego Office of the Chancellor, and the San Diego Unified School District for motivating and supporting this project. EB was supported by the University of Hawai‘i at Mānoa. ARR was supported by Scripps Institution of Oceanography through Center for Climate Change Impacts and Adaptation postdoctoral funding and not in the author’s current capacity as an employee of the Jet Propulsion Laboratory, California Institute of Technology. LE was supported through the University of North Carolina NSF REU Site: An Interdisciplinary Approach to Research in the Marine Sciences for First-Year Students (NSF Award # 1950542). We thank Dave Wells and UNCW’s Center for Marine Science for CMS dock sensor maintenance, data collection, and access to/support with new deployment locations. We acknowledge CORMP for data management and access.