The Oceanography Society
Volume 02 | Number 1 | April 1989
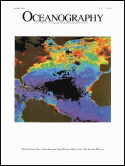
On the Cover: The development and intensity of the North Atlantic spring bloom as shown in a seasonal composite of Coastal Zone Color Scanner (CZCS) data acquired during the spring (April-June). Areas rich in phytoplankton are shown as orange-red (greater than 1 mg/m 3) progressing through yellow, green and blue, with purple (less than 0.1 mg/m 3) representing areas with the lowest chlorophyll concentrations. While the amount of data shown here is several hundred times more than oceanographers have been able to gather from ships, large regions of the central Atlantic are still blank, since the CZCS could operate only intermittently. See the article by Ducklow, p. 4. (Imagery courtesy of NASA/Goddard Space Flight Center: G.C. Feldman, W.E. Esaias, C.R. McClain; and University of Miami/RSMAS: R.H. Evans, J.W. Brown).
Cover PDF
REGULAR ISSUE FEATURES
Joint Global Ocean Flux Study: The 1989 North Atlantic Bloom Experiment
By
Hugh W. Ducklow
Toxic Algal Bloom in Scandinavian Waters, May–June 1988
By
I. Dundas ,
O.M. Johannessen ,
G. Berge, and
B. Heimdal
The 1988 Black Sea Oceanographic Expedition: Overview and New Discoveries
By
James W. Murray and
Erol Izdar
The Slocum Mission
By
Henry Stommel
Particle Deposition in the Present and Holocene Black Sea
By
Bernward Hay and
Susumu Honjo
DEPARTMENTS
QUARTERDECK • Seed Corn
By
David A. Brooks
REVIEW AND COMMENT • Swimmers: A Recapitulation of the Problem and a Potential Solution
By
David M. Karl and
George A. Knauer
REVIEW AND COMMENT • Marine Bioluminescence and Upper Ocean Physics: Seasonal Changes in the Northeast Atlantic
By
John Marra
SOCIETY SOUNDINGS • President's Report
By
D. James Baker
SOCIETY SOUNDINGS • The Inaugural Meeting of The Oceanography Society
By
Stan Wilson,
Dave Brooks ,
Rana Fine, and
Chris Mooers
SOCIETY SOUNDINGS • Smooth Sailing, Letty!
By
David A. Brooks
SOCIETY SOUNDINGS • Bylaws for The Oceanography Society
Bylaws for The Oceanography Society. 1989. Oceanography 2(1):43.
NEWS AND INFORMATION • Bringing the Ocean to the Public at the Monterey Bay Aquarium
By
Julie Packard
NEWS AND INFORMATION • WHOI Names Sixth Director
WHOI Names Sixth Director. 1989. Oceanography 2(1):45.
NEWS AND INFORMATION • NOAA's National Marine Mammal Laboratory
By
Howard W. Braham
NEWS AND INFORMATION • Nansen Remote Sensing Center, Bergen, Norway
By
Ola M. Johannessen
STUDENTIA • We, The Oceanographers
By
Anne M. Arquit
NEWS AND INFORMATION • An Oceanographic Time Capsule
By
Walter Munk and
Peter Worcester
MEETINGS AND WORKSHOPS •
Meetings and Workshops. 1989. Oceanography 2(1):49.
BOOK REVIEW • Sailing Alone Around the World
By
David A. Brooks